Do Malaysian Spin-Offs Create Value?
Nadisah Zakaria (Corresponding author)
Salford Business School, The University of Salford
Salford Greater Manchester, M54WT, United Kingdom
E-mail: [email protected]
Glen Christopher Arnold
Salford Business School, The University of Salford
Salford Greater Manchester, M54WT, United Kingdom
E-mail: [email protected]
Received: March 15, 2012 Accepted: March 25, 2012 Published: June 1, 2012
doi:10.5296/ajfa.v4i1.1518 URL: http://dx.doi.org/10.5296/ajfa.v4i1.1518
Abstract
This paper investigates the short- and long-run share return performance of Malaysian spin-off firms during the period January 1980 to April 2011. Using daily and monthly data, the study examines the performance of spin-off firms against the benchmarks of Malaysian All-Shares indices. The results show that parent firms significantly outperformed the market during the few days surrounding the announcement date even after adjustment for size. In the long-run analysis of three years, however, and after allowing for size, this research failed to find abnormal performance for either parents or spun-off entities. Overall, the results of this research allow us to plausibly argue that the market anticipates both increased value for parent shareholders and potential exploitable stock market efficiency in the short-run period but not in the long-run.
Keywords: Spin-offs, Share return performance, Market efficiency, Size effect, Malaysia
1. Introduction
A crucial question in corporate spin-offs is whether the action creates wealth for shareholders in the short- and long-run periods. Earlier studies in other countries suggest that spin-offs generate positive abnormal returns during the few days surrounding the announcement. However, the evidence on the long-run share returns performance of firms is more mixed. The present study fills a gap in the literature by discovering how Malaysian spin-off firms perform in both the short- and long-run periods.
It makes several contributions. First, as there is no evidence on the influence of the firm size effect in the event of a spin-off in the Malaysian capital market, the present study adds to growing body of international evidence in corporate spin-offs. Second, we employ two novel market indices: Malaysia All-Shares Equal Weight Index (MAS-EWI) and Malaysia All-Shares Value Weight Index (MAS-VWI)1. Both benchmarks are more comprehensive than any used in previous Malaysian event studies which commonly adopt two popular market indices, namely FTSE Kuala Lumpur Composite Index (KLCI) and FTSE Bursa Malaysia EMAS Index which fail to represent the broader Malaysian market2. Third, we use Cumulative Abnormal Returns (CARs), Buy-and-Hold Abnormal Returns (BHARs) and Market Model as the abnormal return metrics to provide a more comprehensive analysis of share return performance, whereas previous international studies used only one of these models in their analysis.
This study defines a corporate spin-off as occurring when the shares of a subsidiary are distributed on a pro-rata basis to the original shareholders of the parent firms. Following the transaction, the subsidiary becomes an independent firm; therefore the parent firm has no controlling relationship with it. The former parent firm’s shareholders, however, now own two different securities: the shares from the parent and the shares from the newly spun-off firm.
Spin-off activity by Malaysian listed firms began in the late 1980s in tandem with the development of the capital market. It gathered momentum with increasing numbers of corporate spin-offs during the bull-run period of 1993 to 1994; and also in the years following the 1997 crisis. Out of 36 cases, 67% of the spin-off announcements occurred during the bear periods from 1999 to 2006.
This study examines a sample of 36 spin-offs completed between January 1980 and April 2008. In a previous study which examined 85 Malaysian firms, only some of which were engaged in spin-offs. Yoon and Ariff (2007) found a significant positive cumulative average abnormal return (CAAR) of +22.7% in a two-day (day -1 to day 0) event window surrounding the announcement date during the period 1986 to 2003. It is unfortunate that the study was not purely focused on spin-offs. It is also unfortunate that the authors did not study long-run share return performance and the influence of size effect. Therefore the present
1
Both benchmarks cover all sizes of all firms (based on the market capitalisation). 2
work represents the first comprehensive study of corporate spin-offs in the Malaysian capital market over the short- and long-run periods against the market benchmarks of MAS-EWI and MAS-VWI.
Indication of the size effects are seen in the different results when we switch from equal-weighted index to value-weighting (we find a reverse size effect in Malaysia with large firms outperforming).
Our study finds that: (1) before size adjustment, there is a significant outperformance in the few days surrounding the announcement date (short-run) for parent firms; (2) before size adjustment, the overall results indicate that parents, spun-offs and combined firms significantly outperformed the MAS-EWI in the three-year period, but failed to produce similar results when the MAS-VWI was used as a market benchmark; (3) after size adjustment, the overall results confirm the presence of a spin-off effect for parent firms over the short-run period; and (4) after size adjustment, there is no significant abnormal performance for parents, spun-offs and combined firms in the long-run period. Overall, these findings imply that spin-offs produce positive abnormal share returns in the short-run period; but fail to demonstrate abnormal performance after adjusting for size in the long-run period.
The remainder of the paper is organised as follows. Section 2 describes a brief literature concerning the short- and long-run share return performance of spin-off firms. Section 3 explains the sample selection and data. Section 4 outlines the methodologies used in the present study. Section 5 presents the results for both short- and long-run share return performance of Malaysian spin-off firms. Section 6 concludes the paper.
2. Literature Review
The spin-off effect has been widely studied internationally. The US studies (e.g. Hite and Owers, 1983; Schipper and Smith, 1983; Miles and Rosenfeld, 1983; Rosenfeld, 1984; Cusatis et al. 1993; Desai and Jain, 1999; Krishnaswami and Subramaniam, 1999; McConnell et al. 2001; and Chemmanur et al. 2010) generally show that investors who buy and then sell shares in the few days surrounding the spin-off announcement (short-run period) and those who hold them for three-year period following the completion date of spin-offs (long-run period) gain superior positive returns.
In Europe, the evidence is more mixed with three-year holding period studies (e.g. Kirchmaier, 2003; Veld-Veld Merkoulova, 2004; Murray, 2008; Boreiko and Murgia, 2007; and Dasilas et al. 2010) failing to find evidence that spin-offs create value. Evidence for short-run value creation, however, is similar in spirit to that reported using the US data.
Although limited empirical research has been conducted outside the US and Europe, the extant studies (e.g. Koh et al. 2005; Yoon and Ariff, 2007; and Uddin, 2010) demonstrate evidence consistent with the earlier works in these markets over the short-run period. However, the long-run period of, say, three years, has not been explored.
They find that an investor could earn an announcement-period abnormal return of +3.47% in the three-day event window (from day -1 through day +1). They also reveal that the markets react differently in the US and European spin-offs: the US spin-offs generate a stronger positive spin-off effect than the European spin-offs, on average +4.21% compared with +1.36%. These findings are similar in spirit to those of the US and Europe spin-off studies: positive and significant announcement-period abnormal returns of the order of +3.28% to +3.84%; using different time periods, methodologies and sample firms.
Given these facts an intriguing question is whether the conclusions drawn by previous empirical studies into spin-offs hold in the Malaysian market. Little attention has been given to the performance of these entities following the listing of spun-off firms in the market, reminding us that the spin-off effect over a long-run period of, say, three years, is open to debate.
3. Sample Selection and Data
Both parents and spun-offs trading on the Main Market (merging of Main Board and the Second Board) and ACE (formerly known as MESDAQ) of Bursa Malaysia from 1st January 1980 to 30th April 2008 are identified. This enables the present study to analyse one to three years’ post spin-off performance up to April 2011. 36 Malaysian parent firms conducting spin-offs have been identified.
Two event dates are specified for this analysis: the spin-off announcement date and the completion month of the spin-off. The announcement date is designated as the one in which the event first receives a mention in the financial press. The event month is defined as the month in which the newly spun-off firm is listed, and trading its shares begins on Bursa Malaysia. The identities of both parents and spun-offs are obtained from the Investors Digest (a monthly publication of KLSE or Bursa Malaysia) and also from Bursa Malaysia’s website. These sources of information is then cross-checked with the relevant press and financial announcements, for instance Nexis Business and News database, local English newspapers, individual firms’ websites and annual reports.
Combined firms are created by weighting the returns of parents and those of spun-offs by the market value of equity on the completion month of a spin-off. As a spin-off involves a pro rata distribution of the shares of a subsidiary, creating combined firms provides information about the return that an investor would have realised if he had held onto the shares of both parents and spun-offs following the completion month of a spin-off (Desai and Jain, 1999).
In the case of daily data, defining t=0 as the announcement date, t=-20 days to t=+20 days represents the event period or observation period, and t=-220 days to t=-21 constitutes the estimation period (to apply in the Market Model for obtaining the value of alpha, α and beta,
4. Methodology
To analyse short-run share return performance, we employ the Market Model (henceforth MM) and Cumulative Abnormal Returns (henceforth CARs). Buy-and-Hold Abnormal Returns (henceforth BHARs) are used to measure the share return performance over the long-run period.
Fama (1998) notes that the choice of weighting scheme depends on the hypothesis of interest to the researcher. Loughran and Ritter (2000, p.363, note 2) state that ‘if one is trying to measure the abnormal returns on the firms undergoing some event, then each firm should be weighted equally.... [This] will produce point estimates that are relevant from the point of view of a manager, investor, or researcher attempting to predict the abnormal returns associated with a random event’. Veld and Veld-Merkoulova (2004) claim that they prefer equal weighted portfolio returns to test whether the random event of spin-offs is associated with long-run superior performance. Therefore, we adopt equal-weighted portfolio returns because spin-offs are random events that occur intermittently from January 1980 to April 2008.
4.1 Market Model and Cumulative Abnormal Returns (CARs) Model
Following the Market Model, the daily abnormal return for security j of spin-off firms in event period t is computed as:
j j mt
jt
jt
R
R
R
A
ˆ
ˆ
ˆ
(1)Where,
A
ˆ
R
jt and Rjt are the daily abnormal return and the daily actual return of security jin event period t, respectively.
R
mt is the daily market return of MAS-EWI and MAS-VWI inevent period t. The parameters of alpha,
ˆ
jand beta,
ˆjare the regression intercept and theslope of characteristic line, respectively; estimated for security j over the pre-event estimation period (e.g. 200 trading days) by running the Ordinary Least Squares (OLS) regression.
Based on the CARs Model, the performance of an individual security is adjusted to the performance of a market index. Therefore, the daily abnormal returns of any security j is given as the difference between daily actual return and the corresponding daily return on the market index during period t, and are computed as follows:
mt jt
jt R R
AR
(2)
The abnormal return for each security j (derived from the above two models) is observed for
each day in the event period and averaged across
N
firms or securities using the following
N j jt t AR N AAR 1 1 (3)Where, AARt is the daily average abnormal return in event period t and N denotes the
number of securities in the sample.
Finally, the
2 1,t
t
CAAR is computed by summing the daily average abnormal returnsAARt
over days from period t1 to period t2 as follows:
2 1 2 , 1 t t t t t t AARCAAR (4)
4.2 Buy-and-Hold Abnormal Returns (BHARs) Model
The main justification for including BHARs for long-run abnormal returns is that this approach is able to accurately simulate the effect of a spin-off event on the investor’s portfolio, because its compounding approach is more accurate than that of CARs.
The three-year holding period return is examined by computing the compounded monthly
Buy-and Hold Return, BHRjT for both parent and spun-off firms in time t as follows:
1 11
T t jt jT r BHR (5)Where,
r
jt is the monthly actual return on security j in event period t. Tis designated as thenumber of months in event period t.
The Buy-and-Hold Returns, BHRmT, for the market benchmarks, proxied by the MAS-EWI
and MAS-VWI are:
1
11
T tmT rmt
BHR
(6)
mt
r
is the corresponding monthly index level of MAS-EWI and MAS-VWI in event period t.
T t mt T t jtjt r r
BHAR 1 1 1 1 1 1 (7)
Where,
BHAR
jt is the Buy-and-Hold Abnormal Return of security j in event period t.4.3 Statistical Tests
The statistical significance of the cumulative average abnormal returns is calculated following Brown and Warner (1980, 1985) and the parametric Test-Statistics for the daily cumulative
average abnormal returns, CAARt1,t2 from period t1 to period t2as follows:
2
1 ) ( / 2 ,
1 AAR T
CAAR
t t t t (8)
Where, CAARt1,t2 is the daily cumulative average abnormal return from period t1 to period t2,
)
(AARt
is the standard deviation of daily average abnormal return and T denotes the totalnumber of days in event period t.
The test-statistic for the monthly buy and hold abnormal returns, BHARt1,t2 during the
clustering period from t1 to period t2 is calculated as:
2
1
,2 / ( )/
1 BHAR T
BHAR
t t t t (9)
Where, BHAR t1,t2 is the monthly average buy and hold abnormal return from period t1 to
period t2; and (BHARt) is the standard deviation of monthly buy and hold abnormal return
in event period t and Tis the total number of firms in the sample.
The non-parametric Sign Test is used to test the significance of percentage of parents, spun-offs and combined firms with positive abnormal returns in both the short-run and long-run periods. The null hypothesis for the Sign Test is given by the proportion of positive abnormal returns equal to 50%. Note that this approach acts as a robust test for those reported results obtained from the parametric Test-Statistics.
5. Results
5.1 Short-run Performance of Parent Firms Following the Spin-Off Announcement
Insert Table 1 about Here
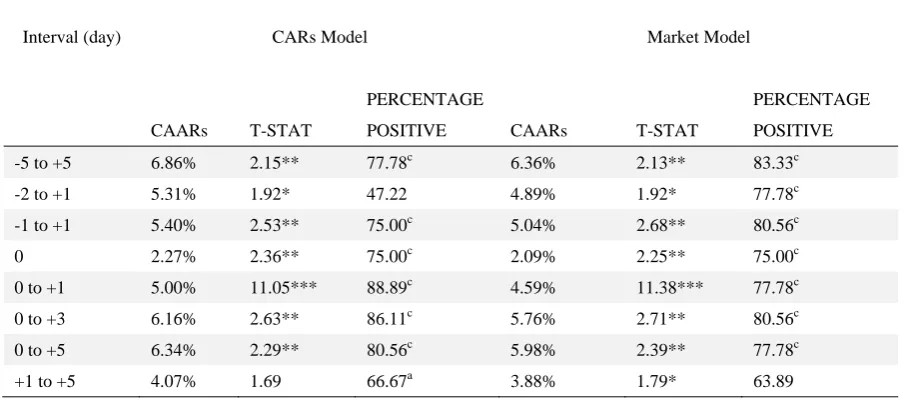
Notably, all the abnormal return metrics (CARs Model and MM), demonstrate positively significant abnormal returns in the three-day event window, from day -1 through day +1. Using the MAS-EWI as a benchmark, spin-offs generate positively significant CAARs of +4.99% and +5.06% for the CARs Model and MM, respectively. When the abnormal returns metrics are measured against the MAS-VWI, the results show that the CAARs for both CARs Model and MM are +5.40% and +5.04%, respectively. Both abnormal returns are positively significant at 5% level. These results are aligned with the findings reported by the non-parametric Sign Test. This approach is used as a robust test to analyse the significance of the percentage of parents with positive abnormal returns3. It can be observed that the percentages of parent firms with positive abnormal returns over this period in both benchmarks are very strong, significant at 1% level.
The presence of strongly significant positive abnormal returns for parent firms in the three-day event window (day -1 through day +1) is of considerable interest, indicating that the market anticipates considerable shareholder wealth enhancement. Although the findings are slightly greater than those documented in the US (e.g. Desai and Jain, 1999), they are comparable to several European studies (e.g. Kirchmaier, 2003; Veld and Veld-Merkoulova, 2004; and Dasilas et al. 2010).
Interestingly, the analysis shows that parent firms outperform both market benchmarks in the five-day event window (day +1 through day +5) following the spin-off announcement date. However, using the MAS-VWI as a benchmark, only the MM is found to show a significant CAAR, +3.88% (at the 10% level). Unfortunately, neither the CARs Model nor the MM posits significant results (though both methods record positive abnormal returns) when the MAS-EWI is used as a market benchmark. So, we find that it is difficult to conclude on this evidence alone that there is a strongly expressed exploitable market pricing inefficiency; especially considering that transaction costs have not been deducted (see later).
5.2 Long-Run Performance of Parents, Spun-Offs and Combined Firms Following the Completion Month of Spin-Offs
Although Lyon et al. (1999, p.198) remind us that ‘analysis of long-run abnormal return is treacherous’, a number of methods are proposed4. Extensive literature favours the use of the BHAR method as it copes better with the effect of compounding than does CAR (e.g. Ritter, 1991; and Barber and Lyon, 1997). In modern event studies, the most commonly accepted
3
Evidence put forward in the literature mentions that the use of a Parametric Test (e.g. Test Statistic) in event studies is not well specified because the distribution of abnormal returns is fat tail and right-skewed. In other words, this approach tends to reject the null hypothesis of positive abnormal returns too often, thus violating the assumption of normality in abnormal returns (Brown and Warner, 1980). A number of papers suggest a Non-Parametric Test (e.g. Sign Test) as a robust test, given that this method is well specified and more powerful in detecting no abnormal returns. Also, this approach does not require as stringent an assumption on return distributions as the Parametric Test (Cowan, 1992). Note that the Non-Parametric Test is often used in event studies and is a better choice when the sample contains thinly traded shares (Cowan, 1992 and Maynes and Rumsey, 1993). On the other hand, Uddin (2010) uses the Non-Parametric Test to overcome the small population problem.
4
methodology is the BHAR approach. Therefore, we adopt this method to capture the effect of a spin-off event on the investor’s portfolio over the long-run period5.
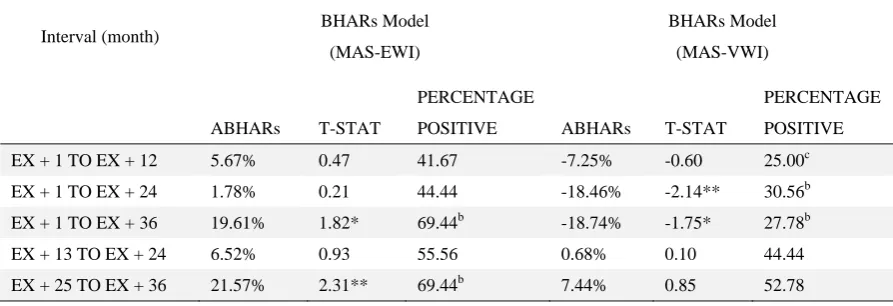
Table 2 presents the percentage monthly buy-and-hold abnormal returns (adjusted to the market) for the full sample of parents, spun-offs and combined firms in the three-year period following the completion month of spin-offs against the MAS-EWI and MAS-VWI benchmarks.
Insert Table 2 Here
In Panel A, the result shows that the parent firms significantly outperformed (at the 10% level) the MAS-EWI, on average by +19.61% in the three-year holding period following the listing of spun-off firms. The result also shows that the percentage of parent firms with positive BHARs (about +69.44%) over this period is considerably strong, significant at 5% level. Both results thus support the earlier findings reported by Cusatis et al. (1993). When the buy-and-hold returns of parent firms are measured against the market benchmark of MAS-VWI, the parent firms show a contrary result. They demonstrate a negative and significant ABHAR of -18.74% over the three years, indicating that in the Malaysian market as a whole, large firms outperformed small firms during the study period.
In Panel B, the result suggests that spun-off firms significantly outperformed the MAS-EWI, on average by +29.19% over the thirty-six months holding periods pursuant their listing month. It can be seen that the long-run share returns performance of the spun-off firms is better than the parent firms’ (perhaps because they are more focused on their core business than their corresponding parent firms as claimed by most Malaysian spin-offs managers). This result supports the evidence documented in both European (e.g. Kirchmaier, 2003) and US (e.g. Cusatis et al. 1993; and Desai and Jain, 1999) markets. In contrast, using the MAS-VWI as a benchmark, the result shows that spun-off firms insignificantly underperformed the market, on average by -12.90% over the three-year holding period following the completion month of a spin-off.
In Panel C, although the combined firms outperformed the MAS-EWI in the three-year holding period following the completion month of a spin-off, the ABHAR at +16.50% is statistically insignificant. Nevertheless, we find that combined firms are associated with a significant negative ABHAR when the MAS-VWI is used as a benchmark. The ABHAR for combined firms over the thirty-six months holding periods is -23.48%, statistically significant at 5% level. Not surprisingly, our finding is substantially different from those in the US (e.g. Cusatis et al. 1993; and Desai and Jain, 1999) and European (e.g. Kirchmaier, 2003; and Veld and Veld-Merkoulova, 2004) studies.
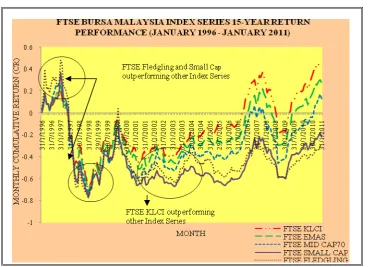
5.3 Index Performance of the FTSE Bursa Malaysia Index Series
This research has already indicated that, in Malaysia, large firms outperformed small firms; we now examine this in more detail. FTSE Asia Research (June, 2009) reports that Malaysian
5
small capitalisation firms consistently underperformed large capitalisation firms over a 12-year period (1997-2008). We analyse the index performance of the FTSE Bursa Malaysia Index Series over a 15-year period (1996-2011) as a preliminary to investigating whether the size effect subsumes the spin-off effect. The historical performance of the FTSE Bursa Malaysia Index Series is shown in Table 3 and Figure 1. Since the Price Index Data for all Index Series (excluding FTSE Bursa Malaysia Kuala Lumpur Composite Index) becomes available in Datastream from 1st January 1996, this analysis therefore begins on this particular date.
Insert Table 3 and Figure 1 Here
The result shows that the FTSE Bursa Malaysia KLCI, a large cap index, has outperformed other indices over a long-run period. Over the 15-year period, the FTSE Bursa Malaysia KLCI generates substantial positive cumulative returns, up to +44.01%. Over the same period, the FTSE Bursa Malaysia Fledgling Index records the worst share returns performance of -29.43%; followed by the FTSE Bursa Malaysia Small Cap Index with negative cumulative returns of -18.13%.
From Figure 1, it can be seen that both the FTSE Bursa Malaysia Fledgling and Small Cap indices outperformed the FTSE Bursa Malaysia KLCI during the bull periods of 1996 (prior to the 1997 financial crisis) and 2000. Nevertheless, the trend is reversed during the bear periods from 2001 to 2006. The large capitalisation firms continue to demonstrate superior performance in the subsequent years. It is important to note that the test period of one to three years’ post spin-off performances coincides with the several periods of a Malaysian bear market. Two-thirds of the spin-off events occurred during the period 1999 to 2006, following the 1997-98 massive decrease in Malaysian share prices, disproportionately affecting small capitalisation firms. These findings thus support the results documented by Nathrah (2006); using all the firms listed on the Bursa Malaysia during the period 1994 to 2003, she observed that a reverse size effect was seen during the bear months; while a small firm effect tended to occur during the bull months.
To show the size composition of Malaysian spin-off firms, this study presents the percentage of parents and spun-offs on the basis of size-ranked decile portfolios for the whole market (in Table 4) with the largest market capitalisation portfolio in decile 1 and the smallest in decile 10.
Insert Table 4 Here
Clearly the percentage of spun-off firms is distributed fairly evenly across the deciles. On the other hand, approximately 70% of the total number of parent firms are categorised in the largest market capitalisation quintile; hence, this research needs to test if the performance of spin-off firms is a manifestation of the size effect.
5.4 Size Adjustment
portfolio’ is created. To generate these, the completion month of a spin-off is taken. On that date, we allocate all shares in the Malaysian market into decile on the basis of market capitalisation. Size decile 1 consists of the largest market capitalisation firms, whilst size decile 10 includes firms with the smallest market capitalisation. This allows us to observe the returns for the size decile appropriate for the sample firm. We then have data for the returns (for each of 36 spin-off firms) over the 36 months following the spin-off completion as a result of belonging to size decile. If these returns are subtracted from the actual returns for the sample firm, we have the size-adjusted returns, and can then comment on whether the size effect subsumes the spin-off effect. A similar analysis is conducted for the few days around the spin-off announcement by forming size decile for each sample parent firm at the date of announcement and observing the average returns for the size decile that the sample firm falls into.
Table 5 displays the daily size-adjusted abnormal returns for parent firms during the period surrounding the announcement date. Table 6 shows the percentage monthly size-adjusted abnormal returns for the full sample of parents, spun-offs and combined firms in the three-year holding period following the completion month of a spin-off.
Insert Table 5 and 6 Here
After adjusting for size, the results confirm the presence of a spin-off effect for parent firms during the few days surrounding the announcement date (as shown in Table 5). The size-adjusted abnormal returns (SAARs) in the three-day event window (day -1 through day +1) and in the five-day event window (day +1 through day +5) are recorded at +4.81% and +4.21%, respectively, indicating that the short-run outperformance of parent firms persists following the size-adjustment analysis. Interestingly, the size adjustment increases the strength of evidence in favour of a pricing inefficiency. In the five days following the announcement there is a jump in returns, indicating some post-announcement drift, although the results are significant only at the 10% level.
In contrast to the results obtained using market adjusted buy-and-hold abnormal returns as reported in Table 2, it can be observed that there are no significant spin-off abnormal returns for parents, spun-offs and combined firms over the three-year holding period after eliminating the influence of size (as shown in Table 6); thus any spin-off effect is subsumed by the size effect.
6. Summary and Conclusion
An interesting question arises from this work: ‘What do the findings say about the efficiency of
the stock market in pricing the shares?’
There is the possibility of a reasonably consistent delay in the positive reaction by investors for a few days after the spin-off announcement, which may be exploitable. A study put forth by Barnes (1986) suggests that poor dissemination of new information, or a lag in the information process, generally causes a delay in market participants’ reactions. At this point, the results suggest that the action of buying and selling shares in the few days after the news concerning spin-offs has been made public would offer investors significant abnormal returns.
Stoll and Whaley (1983), however, claim that on the basis of currently available information, a market is inefficient if it is possible for an investor to earn abnormal returns (adjusted to the market) net of all transaction costs. To avoid mistakenly concluding that the Malaysian market is inefficient, and at the same time not to underestimate the transaction costs associated with the share purchases of parent firms, we need to consider the average trading costs in the order-driven Malaysian share market.
Trading of shares on Bursa Malaysia involve the following costs: brokerage fees, clearing fees and stamp duty fees6. Taking these costs into the calculation, an average roundtrip transaction cost in buying and selling shares on Bursa Malaysia is approximately +0.66% of the contract value7. Madun (2008) reports that a typical transaction cost in the Malaysian share market is on average nearly +1% of the contract value, comparable to the share markets of Singapore (around +1%) and Hong Kong (around +0.6%). Taking the highest estimated cost of 1%, it appears that an investor could possibly earn an abnormal return net of transaction cost of +2.88% (3.88%-1.00%) by concentrating his investment on parent firms during the five-day event window (day +1 through day +5) following the spin-off announcement date. It is apparent that by opting for such action investors would ‘beat the market’, and hence provide some evidence contradictory to the assertion of semi-strong efficiency.
Our findings sit alongside the view put forward in most of the literature on the Malaysian market. Malaysian studies (e.g. Dawson, 1981; Sadique and Siverpulle, 2001; Sharma and Wongbappo, 2002; Morck et al. 2000; Drew and Veeraraghanan, 2002; Hameed and Ting, 2000, Ahmad and Hussain, 2001; Natrah, 2006; Choudary et al. 2007; Lim et al. 2007; and Norli et al. 2010) agree that the Malaysian share market is not semi-strong efficient, even though their methodology, sample size and length of period taken are significantly different from each other.
6
It should be noted the brokerage fees could change depending on the order size. For example, the minimum brokerage fees are +0.3% of contract value (retail trades valued above RM100, 000), +0.6% of contract value (retail trades below RM100, 000) and up to a maximum of +0.7% of the contract value. For simplicity, this study applies the +0.3% of contract value in the calculation. This study also takes account of the +0.001% stamp duty and +0.03% clearing fee.
7
This study calculates the roundtrip transaction cost as follows:
Roundtrip transaction cost = (2 * brokerage fees) + (2 * stamp duty) + (2 * clearing fees) = (2 * 0.3%) + (2 * 0.001%) + (2 * 0.03%) = +0.66%
This research is subject to some limitations. First, the present study only includes firms conducting spin-offs. Other divestiture announcements including split-offs, sell-offs and equity carve-outs are excluded. Second, the results of the study are based on a relatively small sample of firms over a limited period of study.
Considering the scarcity of this area of research in the Asian region, a similar attempt should be made to discover whether spin-offs create value in other capital markets in an effort to provide an integral framework for comparative study.
References
Ahmad, Z., and Hussain, S. (2001). KLSE long-run overreaction and the Chinese New Year
effect. Journal of Business, Finance and Accounting, 28, 63-112.
http://dx.doi.org/10.1111/1468-5957.00366
Arnold, G. C., and Baker, R. D. (2007). Return reversal in UK shares. Social Science
Research Network [online] p.1-59. Available at SSRN: http:// ssrn.com/abstract=602902
[Accessed 28/03/2011]
Barber, B. M., and Lyon, J.D. (1997). Detecting long-run abnormal stock return: The empirical power and specification of test statistics. Journal of Financial Economics, 43 (3), 341-372. http://dx.doi.org/10.1016/S0304-405X(96)00890-2
Barnes, P. (1986). Thin trading and stock market efficiency: The case of KLSE. Journal of
Business Finance and Accounting, 13, 609-617.
http://dx.doi.org/10.1111/j.1468-5957.1986.tb00522.x
Boreiko, D., and Murgia, M. (2007). Which spin-offs generate value and performance improvement?. Social Science Research Network [online] p.1-44. Available at SSRN: http:// ssrn.com/abstract=1554267 [Accessed 28/03/2011]
Brown, S. J., and Warner, J. B. (1980). Measuring security price performance. Journal of
Financial Economics, 8, 205-258. http://dx.doi.org/10.1016/0304-405X(80)90002-1
Brown, S. J., and Warner, J. B. (1985). Using daily stock returns: The case of event studies.
Journal of Financial Economics, 14, 3-31. http://dx.doi.org/10.1016/0304-405X(85)90042-X
Chemmanur, T. J., Jordan, B. D., Liu, H., and Wu, Q. (2010). Antitakeover provisions in
corporate spin-offs. Journal of Banking and Finance, 34, 813-824.
http://dx.doi.org/10.1016/j.jbankfin.2009.09.011
Choudary, T., Lu, L., and Peng, K. (2007). Common stochastic trends among Far East stock price: Effects of the Asian financial crisis. International Review of Financial Analysis, 16 (3), 242-261. http://dx.doi.org/10.1016/j.irfa.2006.12.001
Cusatis, P. J., Miles, J. A., and Woolridge, J. R. (1993). Restructuring through spin-offs: The
stock market evidence. Journal of Financial Economics, 33 (3), 293-311.
Daley, L., Mehrotra, V., and Sivakumar, R. (1997). Corporate focus and value creation:
Evidence from spin-offs. Journal of Financial Economics, 45, 257-281.
http://dx.doi.org/10.1016/S0304-405X(97)00018-4
Dasilas, A., Laventis, S., Sismanidou, M., and Koulikidou, K. (2010). Wealth effects and
operating performance of spin-offs: International evidence. Working Paper. International
Hellinic University, Greece.
Dawson, S. M. (1981). A test of stock market recommendation and market efficiency for the Kuala Lumpur Stock Exchange. Singapore Management Review, July, 69.
Desai, H., and Jain, P. C. (1999). Firm performance and focus: Long run stock market performance following spin-offs. Journal of Financial Economics, 54, 75-101. http://dx.doi.org/10.1016/S0304-405X(99)00032-X
Drew, M. E., and Veeraraghavan, M. (2002). A closer look at the size and value premium in emerging markets: Evidence from the Kuala Lumpur Stock Exchange. Asian Economic
Journal, 16 (4), 337-351. http://dx.doi.org/10.1111/1467-8381.00156
Fama, E. F. (1998). Market efficiency, long term returns, and behavioural finance. Journal of
Financial Economics, 49, 283-306. http://dx.doi.org/10.1016/S0304-405X(98)00026-9
FTSE Asia Research (2009). Report of the enhancement of the Kuala Lumpur Composite
Index (KLCI). Kuala Lumpur: FTSE Bursa Malaysia KLCI.
Hameed, A., and Ting. S. (2000). Trading volume and short horizon contrarian profit: Evidence from the Malaysian market. Pacific Basin Finance Journal, 8, 67-84. http://dx.doi.org/10.1016/S0927-538X(99)00029-3
Hite, G. K., and Owers, J. E. (1983). Security price reaction around corporate spin-off
announcements. Journal of Financial Economics, 12, 409-436.
http://dx.doi.org/10.1016/0304-405X(83)90042-9
Hite, G. K., and Owers, J. E. (1983). Security price reaction around corporate spin-off
announcements. Journal of Financial Economics, 12, 409-436.
http://dx.doi.org/10.1016/0304-405X(83)90042-9
Kirchmaier, T. (2003). The performance effects of European demergers. Center for Economic
Performance Discussion [online], 1-37.
Koh, C. C., Koh, T. H., and Koh, S. K. (2005). Corporate divestitures and spinoffs in
Singapore. Journal of Restructuring Finance, 2 (1), 69-79.
http://dx.doi.org/10.1142/S0219869X05000191
Krishnaswami, S., and Subramaniam, V. (1999). Information asymmetry, valuation, and the
corporate spin-off decision. Journal of Financial Economies, 73-112.
Lim, K. P., Brooks, R. D., and Kim, J. H. (2007). Financial crisis and stock market efficiency: Empirical evidence from Asian countries. International Review of Financial Analysis, 17, 571-591. http://dx.doi.org/10.1016/j.irfa.2007.03.001
Loughran, T., and Ritter, J. R. (2000). Uniformly least powerful tests of market efficiency.
Journal of Financial Economics, 55, 361-389.
http://dx.doi.org/10.1016/S0304-405X(99)00054-9
Lyon, J. D., Barber, B. M., and Tsai, C. L. (1999). Improved methods for tests of long-run
abnormal stock returns. Journal of Finance, 54 (1), 165-201.
http://dx.doi.org/10.1111/0022-1082.00101
Madun, A. (2008). The impact of financial analyst coverage or stock properties: the
experience of Malaysian research incentive scheme. Unpublished thesis (PhD). University of
Bath, United Kingdom.
McConnell, J. J., Ozbilgin, M., and Wahal, S. (2001). Spin-offs and ex ante. The Journal of
Business, 74 (2), 245-280. http://dx.doi.org/10.1086/209672
Miles, J., A., and Rosenfeld, J. D. (1983). The effect of voluntary spin-off announcements on
shareholder wealth. The Journal of Finance, 38 (5), 1597- 1606.
http://dx.doi.org/10.2307/2327589
Morck, R., Yeung, B., and Yu, B. (2000). The information content of stock markets: Why do emerging markets have synchronous stock price movements?, Journal of Financial
Economics, 58 (2), 215-260. http://dx.doi.org/10.1016/S0304-405X(00)00071-4
Murray, L. (2008). Spin-offs in an environment of bank debt. Journal of Business Finance
and Accounting, 35(3) & (4), 406-433.
Nathrah, Y. (2006). The evidence of size effect during bull and bear markets. Unpublished Thesis (MSc). Universiti Putra Malaysia.
Norli, A., Annuar, M. N., Taufik, H., and Sazali, Z. A. (2010). Short-run stock overreaction: Evidence from Bursa Malaysia. International Journal of Economics and Management, 4, 319-333.
Ritter, J. (1991). The long-run performance of initial public offerings. Journal of Finance, 46, 3-28. http://dx.doi.org/10.2307/2328687
Rosenfeld, J. D. (1984). Additional evidence on the relation between divestiture announcement and shareholder wealth’. Journal of Finance, 39, 1437-1447. http://dx.doi.org/10.2307/2327736
Schipper, K., and Smith, A. (1983). Effects of recontracting on shareholder wealth: The case of voluntary spin-offs. Journal of Financial Economics, 12 (4), 437-467. http://dx.doi.org/10.1016/0304-405X(83)90043-0
Shamsher. M., Taufik, H., and Ariff, M. (2007). Research in an emerging Malaysian capital market: A guide for future direction. International Journal of Economics and Management, 1 (2), 173-202.
Sharma, S. C., and Wongnbangpo, P. (2002). Long-term trends and cycles in ASEAN stock
market. Review of Financial Economics, 11 (4), 299-315.
http://dx.doi.org/10.1016/S1058-3300(02)00062-9
Stoll, H. R., and Whaley, R.E. (1983). Transaction costs and the small firm effect. Journal of
Financial Economics, 12, 57-79. http://dx.doi.org/10.1016/0304-405X(83)90027-2
Uddin, M. H. (2010). Corporate spin-offs and shareholders’ value: Evidence from Singapore.
The International Journal of Business and Finance Research, 4 (4), 43-56.
Veld, C., and Veld-Merkoulova, Y. V. (2004). Do divestiture create value? The case for
European spin-off. Journal of Banking and Finance, 28 (5), 1111-1135.
http://dx.doi.org/10.1016/S0378-4266(03)00045-1
Yoon, C. S., and Ariff, M. (2007). Corporate spin-offs, their price reactions and determinants in Malaysia. International Journal of Banking and Finance, 5, 83-112.
Table 1. Announcement period: share returns performance of the parent firms over a short-run adjusted for MAS-EWI and MAS-VWI using the CARs Model and Market Model
Panel A: Adjusted for MAS-EWI
Panel B: Adjusted for MAS-VWI
Note:
0 denotes the announcement date of the spin-off event. Asterisks indicate statistical significance at the 10% (*), 5% (**) and 1% (***) levels, using a two-tailed test. The non-parametric Sign Test is used to test the significant percentage of firms with positive abnormal returns. The null hypothesis for the Sign Test is given as the proportion of positive abnormal returns equal to 50%. a, b and c indicate significance at the 10%, 5% and 1% levels.
Interval (day) CARs Model Market Model
CAARs T-STAT
PERCENTAGE
POSITIVE CAARs T-STAT
PERCENTAGE POSITIVE
-5 to +5 6.86% 2.15** 77.78c 6.36% 2.13** 83.33c -2 to +1 5.31% 1.92* 47.22 4.89% 1.92* 77.78c -1 to +1 5.40% 2.53** 75.00c 5.04% 2.68** 80.56c 0 2.27% 2.36** 75.00c 2.09% 2.25** 75.00c 0 to +1 5.00% 11.05*** 88.89c 4.59% 11.38*** 77.78c 0 to +3 6.16% 2.63** 86.11c 5.76% 2.71** 80.56c 0 to +5 6.34% 2.29** 80.56c 5.98% 2.39** 77.78c +1 to +5 4.07% 1.69 66.67a 3.88% 1.79* 63.89
Interval (day) CARs Model Market Model
CAARs T-STAT
PERCENTAGE
POSITIVE CAARs T-STAT
Table 2. Long-run performance: share returns performance of the parents, spun-offs and combined firms adjusted for MAS-EWI and MAS-VWI using the BHAR Model
Panel A: Parent firms
Interval (month) BHARs Model (MAS-EWI)
BHARs Model (MAS-VWI)
ABHARs T-STAT
PERCENTAGE
POSITIVE ABHARs T-STAT
PERCENTAGE POSITIVE EX + 1 TO EX + 12 5.67% 0.47 41.67 -7.25% -0.60 25.00c EX + 1 TO EX + 24 1.78% 0.21 44.44 -18.46% -2.14** 30.56b EX + 1 TO EX + 36 19.61% 1.82* 69.44b -18.74% -1.75* 27.78b EX + 13 TO EX + 24 6.52% 0.93 55.56 0.68% 0.10 44.44 EX + 25 TO EX + 36 21.57% 2.31** 69.44b 7.44% 0.85 52.78
Panel B: Spun-off firms
Interval (month) BHARs Model (MAS-EWI)
BHARs Model (MAS-VWI)
ABHARs T-STAT
PERCENTAGE
POSITIVE ABHARs T-STAT
PERCENTAGE POSITIVE EX + 1 TO EX + 12 11.24% 0.99 50.00 -2.59% -0.22 25.00c EX + 1 TO EX + 24 33.08% 1.88* 52.78 12.44% 0.66 36.11 EX + 1 TO EX + 36 29.19% 2.51** 61.11 -12.90% -0.98 38.89 EX + 13 TO EX + 24 27.68% 2.31** 50.00 22.54% 1.72* 50.00 EX + 25 TO EX + 36 16.58% 1.83* 61.11 0.15% 0.01 41.67
Panel C: Combined firms
Interval (month) BHARs Model (MAS-EWI)
BHARs Model (MAS-VWI)
ABHARs T-STAT
PERCENTAGE
POSITIVE ABHARs T-STAT
PERCENTAGE POSITIVE EX + 1 TO EX + 12 1.20% 0.12 38.89 -11.83% -1.20 13.89c EX + 1 TO EX + 24 1.43% 0.20 44.44 -19.44% -2.56** 25.00c EX + 1 TO EX + 36 16.50% 1.60 69.44b -23.48% -2.26** 22.22c EX + 13 TO EX + 24 9.79% 1.44 58.33 3.30% 0.49 47.27 EX + 25 TO EX + 36 16.13% 2.12** 72.22b 1.50% 0.21 50.00
Note:
hypothesis for the Sign Test is given as the proportion of positive abnormal returns equal to 50%. a, b and c indicate significance at the 10%, 5% and 1% levels.
Table 3. Monthly cumulative returns of the Bursa Malaysia Index Series (January 1996 – January 2011)
Indices
FTSE Bursa Malaysia KLCI
FTSE Bursa Malaysia EMAS Index
FTSE Bursa Malaysia Mid 70 Index
FTSE Bursa Malaysia Small Cap Index
FTSE Bursa Malaysia Fledgling Index
Number of constituents 30 100 70 260 431
Market Capitalisation (RM) 485,666.50 690,859.41 137,745.02 67,447.92 18,958.84
1 Month (%) from 1996 2.75 2.60 3.08 0.30 4.16 3 Month (%) from 1996 12.71 13.45 14.34 19.04 40.15 6 Month (%) from 1996 1.21 1.33 2.19 3.59 18.27 12 Month (%) from 1996 15.28 18.87 26.66 19.66 27.46 36 Month (%) from 1996 -43.96 -47.88 -55.87 -55.43 -52.95 60 Month (%) from 1996 -31.05 -37.88 -52.91 -57.40 -53.07 120 Month (%) from 1996 -13.40 -27.34 -40.66 -64.36 -55.79
132 Month (%) from 1996 12.69 -2.41 -14.22 -48.10 -44.22 144 Month (%) from 1996 32.01 17.37 -2.42 -28.86 -37.18 156 Month (%) from 1996 -16.20 -27.99 -42.54 -58.42 -58.28 168 Month (%) from 1996 19.30 5.44 -13.01 -33.22 -39.37 180 Month (%) from 1996 44.01 30.12 17.25 -18.13 -29.43 Note:
1. Price Index data for FTSE Bursa Malaysia EMAS, FTSE Bursa Malaysia Mid 70, FTSE Bursa Malaysia Small
Cap and FTSE Bursa Malaysia Fledgling indices became officially available in Datastream on 1st January 1996.
2. FTSE Bursa Malaysia KLCI comprises the 30 largest firms in the FTSE Bursa Malaysia EMAS Index by full
market capitalisation.
3. FTSE Bursa Malaysia EMAS comprises the constituent of the FTSE Bursa Malaysia Top 100 Index (constituting
FTSE Bursa Malaysia Mid 70 Index and FTSE Bursa Malaysia KLCI) and FTSE Bursa Malaysia Small Cap
Index.
4. FTSE Bursa Malaysia Mid 70 Index comprises 70 medium size firms in the FTSE Bursa Malaysia EMAS Index
by full market capitalisation.
5. FTSE Bursa Malaysia Small Cap Index comprises those eligible firms within the top 98% of the Bursa Malaysia
Main Market excluding constituents of the FTSE Bursa Malaysia KLCI and FTSE Bursa Malaysia Mid 70 Index.
6. FTSE Bursa Malaysia Fledgling Index comprises the Main Market firms that meet stated eligibility requirements
but are not in the top 98% by full market capitalisation and are not constituents of the FTSE Bursa Malaysia
EMAS Index.
Table 4. Percentage of parents and spun-offs on the basis of size-ranked deciles
Size Deciles Percentage of Parent Firms Percentage of Spun-off Firms 1 (largest market capitalisation) 31.43% 17.14%
2 40.00% 8.57%
3 11.43% 17.14%
4 8.57% 5.71%
5 2.86% 11.43%
6 2.86% 5.71%
7 2.86% 11.43%
8 0% 5.71%
9 0% 14.29%
10 (smallest market capitalisation) 0% 2.86%
Note:
Size deciles are created using the market capitalisations on the completion month of spin-offs.
Table 5. Size adjusted announcement period: share returns performance of the parent firms
Interval (day) Size-Adjusted Abnormal Return (CARs Approach)
SAARs T-STAT PERCENTAGE POSITIVE
-5 to +5 6.70% 2.15** 80.56c
-2 to +1 5.16% 2.10** 77.78c
-1 to +1 4.81% 2.13** 83.33c
0 2.25% 2.23** 77.78c
0 to +1 4.70% 22.57*** 91.67c
0 to +3 6.70% 3.50*** 83.33c
0 to +5 6.45% 2.45** 77.78c
+1 to +5 4.21% 1.86* 63.89
Note:
Table 6. Size adjusted long-run performance: share returns performance of the parents, spun-offs and combined firms
Panel A: Parent firms
Interval (month)
Size Adjusted Abnormal Returns (BHARs Approach)
SAARs T-STAT PERCENTAGE POSITIVE
EX + 1 TO EX + 12 -1.01% -0.11 27.78b
EX + 1 TO EX + 24 -4.19% -0.63 36.11
EX + 1 TO EX + 36 -8.09% -0.87 41.67
EX + 13 TO EX + 24 3.15% 0.55 50.00
EX + 25 TO EX + 36 -0.68% -0.09 33.33a
Panel B: Spun-off firms
Interval (month) Size Adjusted Abnormal Returns (BHARs Approach)
SAARs T-STAT PERCENTAGE POSITIVE
EX + 1 TO EX + 12 2.24% 0.25 36.11
EX + 1 TO EX + 24 8.90% 0.86 41.67
EX + 1 TO EX + 36 5.58% 0.48 41.67
EX + 13 TO EX + 24 11.06% 1.68 55.56
EX + 25 TO EX + 36 4.70% 0.61 44.44
Panel C: Combined firms
Interval (month) Size Adjusted Abnormal Returns (BHARs Approach)
SAARs T-STAT PERCENTAGE POSITIVE
EX + 1 TO EX + 12 -4.35% -0.56 19.44c
EX + 1 TO EX + 24 -6.22% -1.02 38.89
EX + 1 TO EX + 36 -9.24% -1.01 38.89
EX + 13 TO EX + 24 3.33% 0.62 50.00
EX + 25 TO EX + 36 -1.81% -0.26 38.89
Note:
Figure 1. Long-run return performances of FTSE Bursa Malaysia Index Series