29
Development and Implementation of a
Conceptual Survey in Thermodynamics
Pornrat Wattanakasiwich1,2, Preeda Taleab1, Manjula Devi Sharma3, and Ian D. Johnston3Corresponding author: [email protected]
1Physics Education Research Unit, Faculty of Science, Chiang Mai University, Chiang Mai, Thailand 2Thailand Center of Excellence in Physics (ThEP), Commission on Higher Education, Bangkok, Thailand 3School of Physics, University of Sydney, NSW, Australia
Keywords: thermodynamic understanding, conceptual survey, misconceptions
International Journal of Innovation in Science and Mathematics Education, 21(1), 29-53, 2013.
Abstract
Thermodynamics is a basic topic for both science and engineering disciplines. There have been many studies on heat and temperature, but only few focused on laws of thermodynamics. This research aims to develop a conceptual survey for assessing student understanding of fundamental principles in thermodynamics. The construction of the survey is based on previous physics education research studies, in order to shorten the process of conceptual survey construction. The final version called the Thermodynamic Concept Survey (TCS) has both Thai and English versions and is divided into two parts—Part I consists of temperature and heat transfer, and ideal gas law and Part II consists of the first law of thermodynamics and processes. The content validity was analyzed by both Thai and Australian physicists. The reliability of the survey was determined by using more than 2,000 student responses from Australia and Thailand. The statistical analyses showed that the survey is reliable and valid. We also report on the implementation of the survey to investigate alternative conceptions in thermodynamics. We find that students did better on the earlier set of questions than the latter which involved integration of concepts. Ranges of understanding from the extant literature have been used to explore student answers.
Introduction
30
optics (Sokoloff, 2006) and quantum mechanics (Wuttiprom, Sharma, Johnston, Chitaree, & Soankwan, 2009; McKagan, Perkins, Wieman, 2010; Cataloglu & Robinett, 2002).
Before proceeding, it is worthwhile asking: what value does concept surveys add and what is the philosophy underpinning them? Most directly, concept surveys provide a rapid and effective strategy for gauging students’ alternative conceptions. The feedback thus gained, provides the teacher with information that can be used to adapt teaching strategies or to examine if particular strategies are working. But, most importantly, the results of the survey are not designed to be used for summative assessment. In this sense the survey is fundamentally different from a summative test or an examination. This subtle but critical difference has been noted by Adams and Wieman (2011) who note that ‘summative tests intended to provide maximum discrimination among individual students’, a constraint that can be relaxed for formative assessments such as concept surveys. The need to ‘tease out’ student understandings in concept surveys provides certain affordances which are particularly pertinent in thermodynamics and have been exploited in this study. In developing any concept survey, whether a student’s answer is correct is of lesser importance than why they answered as they did.
In general, the procedure for developing multiple-choice conceptual surveys involves several steps. These include reviewing of important content by physics experts, interviewing students, and/or administering a free-response questionnaire. Results are used to construct the first draft which is then administered to a pilot group of students. Then validity and reliability of the survey are determined from the pilot responses and the survey usually does have revisions before emerging as a final draft. The whole process in constructing a particular multiple-choice conceptual survey can take a few years.
Purpose of this study
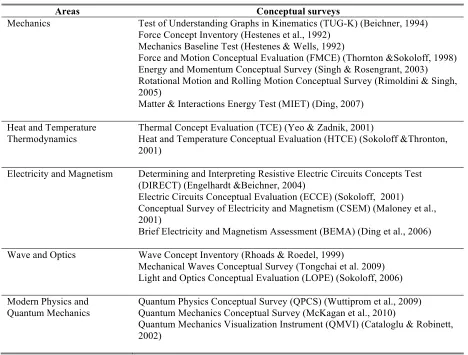
Currently available multiple-choice surveys do not evenly cover the whole range of physics topics taught in first year physics. Generally, areas covered in the calculus first year physics course can be divided into mechanics, properties of matter, thermodynamics, electricity and magnetism, waves, optics and modern physics. Many multiple-choice conceptual surveys have been developed, especially in the areas of mechanics, electricity and magnetism, and quantum physics, as shown in Table 1.
In Table 1, there are only two conceptual surveys in the area of heat, temperature and thermodynamics. The Thermal Concept Evaluation is a 26-item survey on beliefs or understandings of heat transfer, temperature change and thermal properties of materials (Yeo & Zadnik, 2001). The Heat and Temperature Conceptual Evaluation is a 28-item survey concerning heat and temperature, and heat transfer (Sokoloff & Thronton, 2001). There is no multiple-choice survey on the first law of thermodynamics and processes. However, previous qualitative research studies have shown that many students have difficulties in understanding and applying thermodynamic laws and processes (Niaz, 2000; Kautz, Heron, Shaffer, & McDermott, 2005b; Loverude, Kautz, & Heron, 2002; Meltzer, 2004; Taleab & Wattanakasiwich, 2010).
31
• Firstly, we describe the construction of TCS based on previous physics education research studies, in order to shorten the process of conceptual survey construction.
• Secondly, we evaluate the validity and reliability of the survey by using results from
Australia and Thailand.
• Thirdly, we implement the survey to investigate alternative conceptions in
thermodynamics.
Each objective is presented as a section within this paper.
Table 1: Summary of physics conceptual surveys developed
Areas Conceptual surveys
Mechanics Test of Understanding Graphs in Kinematics (TUG-K) (Beichner, 1994) Force Concept Inventory (Hestenes et al., 1992)
Mechanics Baseline Test (Hestenes & Wells, 1992)
Force and Motion Conceptual Evaluation (FMCE) (Thornton &Sokoloff, 1998) Energy and Momentum Conceptual Survey (Singh & Rosengrant, 2003) Rotational Motion and Rolling Motion Conceptual Survey (Rimoldini & Singh, 2005)
Matter & Interactions Energy Test (MIET) (Ding, 2007)
Heat and Temperature Thermodynamics
Thermal Concept Evaluation (TCE) (Yeo & Zadnik, 2001)
Heat and Temperature Conceptual Evaluation (HTCE) (Sokoloff &Thronton, 2001)
Electricity and Magnetism Determining and Interpreting Resistive Electric Circuits Concepts Test (DIRECT) (Engelhardt &Beichner, 2004)
Electric Circuits Conceptual Evaluation (ECCE) (Sokoloff, 2001) Conceptual Survey of Electricity and Magnetism (CSEM) (Maloney et al., 2001)
Brief Electricity and Magnetism Assessment (BEMA) (Ding et al., 2006)
Wave and Optics Wave Concept Inventory (Rhoads & Roedel, 1999)
Mechanical Waves Conceptual Survey (Tongchai et al. 2009) Light and Optics Conceptual Evaluation (LOPE) (Sokoloff, 2006)
Modern Physics and Quantum Mechanics
Quantum Physics Conceptual Survey (QPCS) (Wuttiprom et al., 2009) Quantum Mechanics Conceptual Survey (McKagan et al., 2010)
Quantum Mechanics Visualization Instrument (QMVI) (Cataloglu & Robinett, 2002)
Part I: Construction of the TCS
32
topics as other questions and we wanted the survey to be shorter. The acceptable number of questions per hour will depend on contents and complexity of the questions (Lowe, 1991). Most conceptual surveys consist of 25-35 multiple choices within an hour testing period (Hestenes et al., 1992; Sokoloff &Thronton, 2001; Maloney et al., 2001). We aimed to have the TCS consisting of 30-35 items so that students have time to think carefully for their answer. During 2009 to 2010, the final version of TCS was administered to the first-year students taking a calculus-based introductory physics for science majors (Phys-1, Phys-2, Phys-3, Phys-4) and the second-year students taking a thermodynamics course (2nd Phys). Please see Table 4 for a detailed explanation of the abbreviation used here.
In 2011, a few items on the TCS, developed in Thai TCS version, were translated from Thai back to English. The content validity was checked again with a group of Australian physics experts at the University of Sydney. In order to make the survey match with Australian high school curriculum, the survey was separated into two parts. Part I consisted of temperature and heat transfer, and ideal gas law. Part II consisted of the first law of thermodynamics and processes. Therefore, this is considered a second version of TCS. Only part I of the survey was given to first-year undergraduates taking three introductory physics courses at the University of Sydney (Fund, Reg-1 and 1st Adv) on the first week of semester. The full survey consisting of both part I and II was administered to 2nd Adv and Reg-2, each group profile is displayed in Table 4.
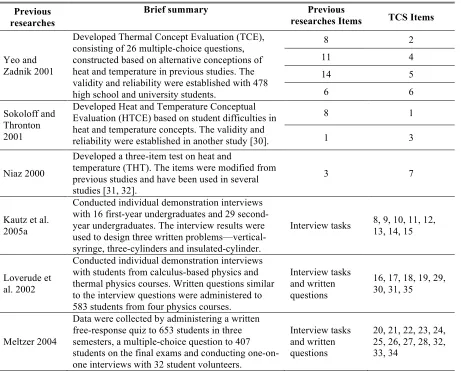
Table 2: Items modified from previous physics education researches
Previous researches
Brief summary Previous
researches Items TCS Items
Yeo and Zadnik 2001
Developed Thermal Concept Evaluation (TCE), consisting of 26 multiple-choice questions, constructed based on alternative conceptions of heat and temperature in previous studies. The validity and reliability were established with 478 high school and university students.
8 2
11 4
14 5
6 6
Sokoloff and Thronton 2001
Developed Heat and Temperature Conceptual Evaluation (HTCE) based on student difficulties in heat and temperature concepts. The validity and reliability were established in another study [30].
8 1
1 3
Niaz 2000
Developed a three-item test on heat and
temperature (THT). The items were modified from previous studies and have been used in several studies [31, 32].
3 7
Kautz et al. 2005a
Conducted individual demonstration interviews with 16 first-year undergraduates and 29 second-year undergraduates. The interview results were used to design three written problems—vertical-syringe, three-cylinders and insulated-cylinder.
Interview tasks 8, 9, 10, 11, 12, 13, 14, 15
Loverude et al. 2002
Conducted individual demonstration interviews with students from calculus-based physics and thermal physics courses. Written questions similar to the interview questions were administered to 583 students from four physics courses.
Interview tasks and written questions
16, 17, 18, 19, 29, 30, 31, 35
Meltzer 2004
Data were collected by administering a written free-response quiz to 653 students in three semesters, a multiple-choice question to 407 students on the final exams and conducting one-on-one interviews with 32 student volunteers.
Interview tasks and written questions
33
Table 3: Conceptual areas and corresponding item numbers for the TC
Figure 1: Summary of the Thermodynamic Conceptual Survey (TCS) construction procedure
Topics Item
Pa
rt
I I. Temperature and heat transfer
1, 2, 3, 4 5, 6, 7
II. Ideal gas law Isobaric process 8, 9, 10, 11, 12 Adiabatic process 13, 14, 15, 16
Pa
rt
I
I
III. The 1st law of
thermodynamics
Adiabatic process 17, 18, 19 Isobaric process 20, 21 Isothermal process 22, 23 Isochoric process 24
Cyclic process 26, 27, 28, 29, 30, 31 P-V diagram 25, 32 , 33, 34, 35
Item pool: Generate 40 multiple-choice questions from previous results in
English and then translate into Thai
Literature Review: Select previous results on topics of heat and
temperature, ideal gas law, the 1st law and thermodynamic processes.
Validity: Three physics experts review 40 multiple choices questions with
regards to the validity of the translation from English into Thai
Content validity (1): Three physics experts in teaching thermodynamics
reviewed questions for the content validity
Pilot study: TCS consisting of 40 questions was administered to physics
graduate students for readability. 5 questions were removed.
Thai data collection: Thai-version of TCS was administered to Phys-1,
Phys-2, Phys-3, Phys-4 and 2nd Phys students in 2009.
Content validity (2): TCS was translated from Thai to English and
reviewed for the content validity by Australian physicists.
Final version: TCS version 2 was divided into 2 parts—I) heat,
temperature, ideal gas law; II) the 1st law and thermal processes.
Australian data collection: TCS was administered to several groups of
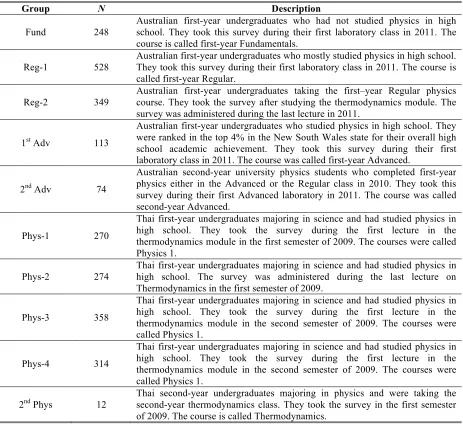
34 Table 4: Summary of student profiles
Group N Description
Fund 248
Australian first-year undergraduates who had not studied physics in high school. They took this survey during their first laboratory class in 2011. The course is called first-year Fundamentals.
Reg-1 528
Australian first-year undergraduates who mostly studied physics in high school. They took this survey during their first laboratory class in 2011. The course is called first-year Regular.
Reg-2 349
Australian first-year undergraduates taking the first–year Regular physics course. They took the survey after studying the thermodynamics module. The survey was administered during the last lecture in 2011.
1st Adv 113
Australian first-year undergraduates who studied physics in high school. They were ranked in the top 4% in the New South Wales state for their overall high school academic achievement. They took this survey during their first laboratory class in 2011. The course was called first-year Advanced.
2nd Adv 74
Australian second-year university physics students who completed first-year physics either in the Advanced or the Regular class in 2010. They took this survey during their first Advanced laboratory in 2011. The course was called second-year Advanced.
Phys-1 270
Thai first-year undergraduates majoring in science and had studied physics in high school. They took the survey during the first lecture in the thermodynamics module in the first semester of 2009. The courses were called Physics 1.
Phys-2 274
Thai first-year undergraduates majoring in science and had studied physics in high school. The survey was administered during the last lecture on Thermodynamics in the first semester of 2009.
Phys-3 358
Thai first-year undergraduates majoring in science and had studied physics in high school. They took the survey during the first lecture in the thermodynamics module in the second semester of 2009. The courses were called Physics 1.
Phys-4 314
Thai first-year undergraduates majoring in science and had studied physics in high school. They took the survey during the first lecture in the thermodynamics module in the second semester of 2009. The courses were called Physics 1.
2nd Phys 12 Thai second-year undergraduates majoring in physics and were taking the second-year thermodynamics class. They took the survey in the first semester
of 2009. The course is called Thermodynamics.
Part 2: Validity and reliability of the TCS
A. Overall results
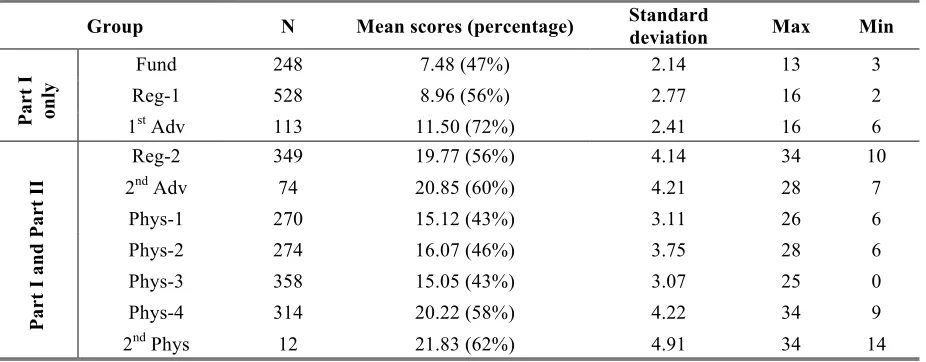
The TCS had been administered to different groups of university-level students both in Thailand and Australia. The overall results in terms of mean scores, standard deviation; maximum and minimum scores are displayed in Table 5. The Fund, Reg-1 and 1st Adv groups took only Part I of the TCS, so the possible maximum score is 16. The maximum score for the whole survey is 35.
B. Validity of the survey
35
Content validity
Content validity is a judgment of how appropriate the items seem to a panel of experts in the subject matter. The validity of TCS was evaluated twice by two techniques at two points on the survey construction process, as shown in Figure 1. The first content validity was conducted for the Thai version of TCS and used the Index of Item – Objective Congruence (IOC), a procedure used in evaluating content validity at an item development stage (Sireci, 1998). The IOC process consists of experts in that particular content rate each item based on the. Three physics experts were asked to rate each item on a five-point scale (1 being particularly unclear and 5 being particularly clear) for correlation between each question and its objective. Every item in the TCS was rated higher than 4.
The second evaluation of content validity was conducted when the TCS was translated from Thai to English. The technique employed was a research protocol known as the Delphi technique (Wuttiprom et al., 2009). To achieve content validity, discussion among a group of physics experts was repeated for several weeks. The discussion involved the survey’s reasonableness and appropriateness. As a result, the survey was divided into two parts, so it is more appropriate and suitable for the Australian curriculum. The experts agreed that the questions covered important topics on thermodynamics, so this establishes the content validity of TCS.
Table 5: Overall results for different groups of students
Group N Mean scores (percentage) Standard
deviation Max Min
Pa
rt
I
on
ly
Fund 248 7.48 (47%) 2.14 13 3
Reg-1 528 8.96 (56%) 2.77 16 2
1st Adv 113 11.50 (72%) 2.41 16 6
Pa
rt
I
a
n
d
Pa
rt
I
I
Reg-2 349 19.77 (56%) 4.14 34 10
2nd Adv 74 20.85 (60%) 4.21 28 7
Phys-1 270 15.12 (43%) 3.11 26 6
Phys-2 274 16.07 (46%) 3.75 28 6
Phys-3 358 15.05 (43%) 3.07 25 0
Phys-4 314 20.22 (58%) 4.22 34 9
2nd Phys 12 21.83 (62%) 4.91 34 14
Construct validity
36
Table 6: The known group difference between the 2nd Phys and Phys-1 group
Group N Mean 95 % Confidence
interval
t statistic* df Significance
Lower Upper
Phys-1 270 15.119 14.75 15.49 79.81 269 0.000
2nd Phys 12 21.833 18.71 24.96 15.39 11 0.000
Note: *Using two-tailed and assuming equal variances.
C. Item analysis
The TCS was administered to large groups of undergraduates (> 2000) both in Thailand and Australia, an item analysis were applied to determine which items were carrying out as intended. Item analysis includes three measures: item difficulty index, item discrimination, and point biserial coefficient. In order to perform item analysis, we only used the post-instructional data including Reg-2, Phys-2, Phys-4, and 2nd Adv. We did not use the responses from 2nd Phys because they had learned advance thermodynamics and our main purpose is to develop the survey for introductory thermodynamics.
Item difficulty index
Item difficulty index (P) is a measure of how difficult an item is. It is calculated as a ratio between the numbers of correct response over the total responses. The average difficulty ratings (if no one answers correctly P = 0.0 and P = 1.0 if everyone answers correctly) from four groups of students (N = 1011) are displayed in Figure 2. The range of item difficulty can be varied between 0.3> P > 0.9 (Wuttiprom et al., 2009; Ding & Beichner, 2009) and 0.2 > P > 0.8 (Bardar, Prather, Brecher, & Slater, 2006; Singh & Rosengrant, 2003). In order to investigate student performance on items with a wide range of cognitive complexity, the item is considered too easy if P > 0.9 and too difficult if P < 0.3. As seen in Figure 2, most items have the difficulty index around 0.3-0.8 with a few items slightly below 0.3 to slightly above 0.9. The average is 0.55 which is quite close to an ideal value of 0.5.
Figure 2: Item difficulty index for all items
Item discrimination index
The discrimination index (D) is a measure of the ability of a question to differentiate between competent and less competent students; in other words, those who scored well overall (top 25%) on the survey from those who did not (bottom 25%). A satisfactory item discrimination index is D ≥ 0.3 (Wuttiprom et al., 2009; Ding & Beichner, 2009). Figure 3 presents the item discrimination index of each item. More than 20 items have the discrimination index higher than 0.3 and the average discrimination index is 0.3. Other 15 items that falls slightly below
0 0.1 0.2 0.3 0.4 0.5 0.6 0.7 0.8 0.9 1
1 2 3 4 5 6 7 8 9 10 11 12 13 14 15 16 17 18 19 20 21 22 23 24 25 26 27 28 29 30 31 32 33 34 35
Dif
ficult
y
Ind
ex
37
the standard range are acceptable according to Adams and Wieman (2011). They stated that “the standard acceptable range of values for item analysis was determined for single construct, and summative tests intended to provide maximum discrimination among individual students. However, the instrument using as formative assessment “may have statistics that fall outside of the ‘standard’ range” (Adams & Wieman, 2011).
Figure 3: Item discrimination index for all items
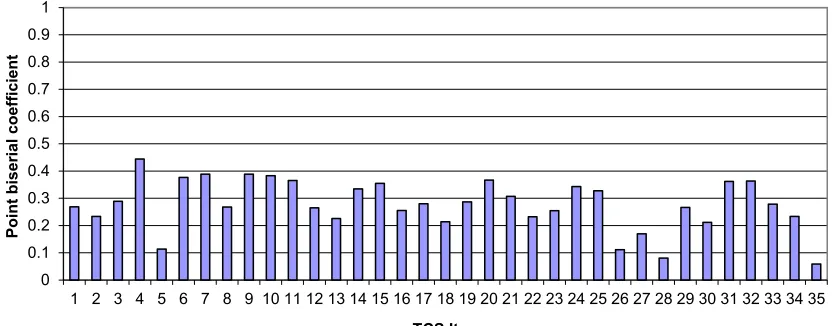
Point biserial coefficient
Point biserial coefficient (PBI) is a measure of correlation of each item to the whole survey score. If the PBI is high, this indicates that students who answered this question correctly are most likely to have a high total score. The desired value of the coefficient is larger than 0.2 (Wuttiprom et al., 2009; Ding & Beichner, 2009). Figure 4 displays the point biserial coefficient of each item. Most items have a coefficient higher than the criterion value, except questions 5, 26, 27, 28 and 35. These questions will be discussed in the next section. The average coefficient is 0.27, implying that the TCS items have self-consistency with the whole survey.
Figure 4: Point biserial coefficient for all items
D. Whole-test analysis
The overall analysis of the survey consisted of Kuder-Richardson reliability and Ferguson’s delta (Ding & Beichner, 2009). In this study, Kuder-Richardson formula 20 (KR-20) was used to measure the internal consistency of the whole survey. In an ideal situation, if the
0.0 0.1 0.2 0.3 0.4 0.5 0.6 0.7 0.8 0.9 1.0
1 2 3 4 5 6 7 8 9 10 11 12 13 14 15 16 17 18 19 20 21 22 23 24 25 26 27 28 29 30 31 32 33 34 35
Disc
rimin
atio
n
ind
ex
TCS Item
0 0.1 0.2 0.3 0.4 0.5 0.6 0.7 0.8 0.9 1
1 2 3 4 5 6 7 8 9 10 11 12 13 14 15 16 17 18 19 20 21 22 23 24 25 26 27 28 29 30 31 32 33 34 35
P
o
int
biser
ial
coef
fici
ent
38
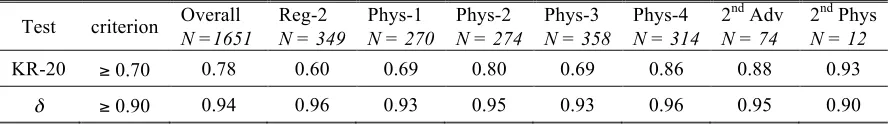
survey is administered twice at different times to the same group of students, then two survey scores should be highly correlated. This could be because students might remember questions on the survey and study for the survey. On the other hand the level of understanding of the students when they took the test for the first time could be different to the level of the same students when they took the test for the second time because they have been learning. Therefore this method of measuring reliability is quite often referred to as re-test. The method used in this study is KR-20 and the values for different groups of students are displayed in Table 7. The KR-20 criterion is ≥ 0.70 (Ding & Beichner, 2009). Most groups have a value higher than the criterion and the overall KR-20 for the TCS is about 0.78, which is a reasonable value. Ferguson’s Delta (δ) measures the discriminating ability of the whole
survey via how broadly it spreads the distribution of scores. The possible value is 0.0 to 1.0, and the survey is considered to sufficiently discriminate if δ> 0.9 (Ding & Beichner, 2009).
The TCS values for each group are above 0.9, as displayed in Table 7. Both the item analysis and the whole survey analysis indicate that the TCS is a valid and reliable instrument.
Table 7: KR-20 and Ferguson’s Delta for each group of students taking the TCS
Test criterion Overall Reg-2 Phys-1 Phys-2 Phys-3 Phys-4 2
nd Adv 2nd Phys
N =1651 N = 349 N = 270 N = 274 N = 358 N = 314 N = 74 N = 12
KR-20 ≥ 0.70 0.78 0.60 0.69 0.80 0.69 0.86 0.88 0.93
δ ≥ 0.90 0.94 0.96 0.93 0.95 0.93 0.96 0.95 0.90
Part 3: Investigation of concepts with the TCS
Multiple-choice questions were administered to more than 2,000 students. Specific question results for the TCS are presented in Table 8. We only present responses of 663 students from both Reg-2 and Phys-4 because we wanted to investigate their conceptions after instruction in thermodynamics. Student overall scores on part I of the TCS were higher than their overall scores on part II, as shown in Table 7. This result suggested that they did have a better understanding on topics of temperature and heat transfer than the first law of thermodynamics and thermal processes. Students’ post-instruction responses (both correct and incorrect) indicated similar misconceptions described in previous literatures (Yeo and Zadnik 2001; Niaz 2000; Kautz et al. 2005a; Loverude et al., 2002; Meltzer, 2004; Kautz et al., 2005b; Taleab & Wattanakasiwich, 2010; Sireci, 1998), and these are discussed in detail in this section.
39
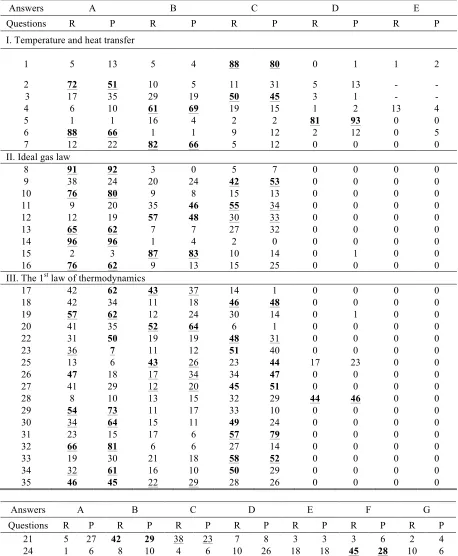
Table 8: Distribution of alternative choices (correct choices are underlined and most commonly-chosen are bold). The percentage of responses of 663 students from both Reg-2 (R) and Phys-4 (P) groups of Australian and Thai students are presented.
Answers A B C D E
Questions R P R P R P R P R P
I. Temperature and heat transfer
1 5 13 5 4 88 80 0 1 1 2
2 72 51 10 5 11 31 5 13 - -
3 17 35 29 19 50 45 3 1 - -
4 6 10 61 69 19 15 1 2 13 4
5 1 1 16 4 2 2 81 93 0 0
6 88 66 1 1 9 12 2 12 0 5
7 12 22 82 66 5 12 0 0 0 0
II. Ideal gas law
8 91 92 3 0 5 7 0 0 0 0
9 38 24 20 24 42 53 0 0 0 0
10 76 80 9 8 15 13 0 0 0 0
11 9 20 35 46 55 34 0 0 0 0
12 12 19 57 48 30 33 0 0 0 0
13 65 62 7 7 27 32 0 0 0 0
14 96 96 1 4 2 0 0 0 0 0
15 2 3 87 83 10 14 0 1 0 0
16 76 62 9 13 15 25 0 0 0 0
III. The 1st law of thermodynamics
17 42 62 43 37 14 1 0 0 0 0
18 42 34 11 18 46 48 0 0 0 0
19 57 62 12 24 30 14 0 1 0 0
20 41 35 52 64 6 1 0 0 0 0
22 31 50 19 19 48 31 0 0 0 0
23 36 7 11 12 51 40 0 0 0 0
25 13 6 43 26 23 44 17 23 0 0
26 47 18 17 34 34 47 0 0 0 0
27 41 29 12 20 45 51 0 0 0 0
28 8 10 13 15 32 29 44 46 0 0
29 54 73 11 17 33 10 0 0 0 0
30 34 64 15 11 49 24 0 0 0 0
31 23 15 17 6 57 79 0 0 0 0
32 66 81 6 6 27 14 0 0 0 0
33 19 30 21 18 58 52 0 0 0 0
34 32 61 16 10 50 29 0 0 0 0
35 46 45 22 29 28 26 0 0 0 0
Answers A B C D E F G
Questions R P R P R P R P R P R P R P
21 5 27 42 29 38 23 7 8 3 3 3 6 2 4
24 1 6 8 10 4 6 10 26 18 18 45 28 10 6
A. Temperature and heat transfer
40
Both Australian and Thai students still had difficulties with question 3, as shown in Figure 5, which looks at heat transfer when the system reaches thermal equilibrium. The predominant alternative choice B indicated that many students thought that heat transfer is in a single relation with either mass or temperature. Also in question 4, which looks at heat transfer during phase change, a noticeable percentage of students seem notto take different phases of water into account in considering the heat transfer, answer C. Both questions 3 and 4 provide good examples of student common reasoning in dealing with a complexity of multi-variable problems, called “functional reduction” (Rozier & Viennot, 1991). When faced with a multi-variable problem, people commonly reduce the complexity by either ignoring some multi-variables or combining variables into a single-variable relationship (Rozier & Viennot, 1991). In this case, many students only considered either mass or temperature in affecting the heat transfer.
3. Cup A contains 100 grams of water and cup B contains twice as much water. The water in both cups was initially at room temperature. Then the water in cup A was heated to 75°C and the water in cup B was heated to 50°C. When the water in both cups cooled down to room temperature, which cup had more heat transferred from it?
A) Cup A had more heat transferred out.
B) Cup B had more heat transferred out.
C) Both cups had the same amount of heat transferred.
D) Not enough information is given to determine the answer.
Figure 5: Question 3 on the Thermodynamic Concept Survey (TCS)
B. Ideal gas law
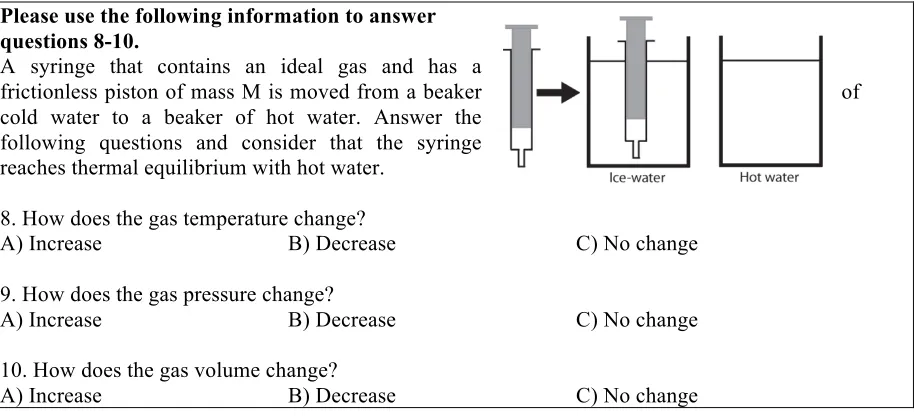
Questions 8-16 were modified from interview questions of the previous study by Kautz et al., (2005a). They were designed to investigate student understanding of the ideal gas law from “a macroscopic perspective” (Kautz et al., 2005a). When considering these questions in terms of thermal processes, they can be categorized into isobaric process (questions 8-12) and adiabatic process (questions 13-14). From Table 8, most students (> 70%) answered questions 8, 14 and 15 correctly. However in questions 9 -13, many students chose incorrect answers. These questions revealed student difficulties with pressure, temperature and relationships between pressure, temperature and volume. These dominant difficulties suggested from the results of the TCS are discussed below.
Students often relating pressure with temperature
41
incorrectly reasoned that when the syringe is put into hot water, the gas molecules inside move faster and hit the syringe wall more often, so the gas pressure increased. This is a pictorial reasoning, explaining why students strongly relate temperature with pressure.
Please use the following information to answer questions 8-10.
A syringe that contains an ideal gas and has a
frictionless piston of mass M is moved from a beaker of
cold water to a beaker of hot water. Answer the following questions and consider that the syringe reaches thermal equilibrium with hot water.
8. How does the gas temperature change?
A) Increase B) Decrease C) No change
9. How does the gas pressure change?
A) Increase B) Decrease C) No change
10. How does the gas volume change?
A) Increase B) Decrease C) No change
Figure 6: Question 8-10 on the Thermodynamic Concept Survey (TCS)
Students lack of understanding of mechanical equilibrium
Questions 11-12, as shown in Figure 7, were modified from Kautz et al. (2005a), in which they found that many students did not understand that the cylinders were in mechanical equilibrium. They had difficulties noting that all three cylinders with identical pistons were at mechanical equilibrium with the ideal gas inside the cylinders, so the pressure of gas in all three cylinders must be the same. Thus we added the term ‘mechanical equilibrium’ in the three-cylinder context for questions 11-12 to clarify as, “The piston of each cylinder is in mechanical equilibrium with the environment.” However, most students still answered incorrectly in both questions, especially question 12. This question which asked students to compare the same type of gas with different temperature had more students answering incorrectly by choosing choice B. Most students (> 50%) answered that the gas pressure was higher in the cylinder with higher temperature. Adding the term ‘mechanical equilibrium’ did not help trigger students to answer correctly, so this result indicated that most students lacked of understanding of this term (Kautz et al., 2005a). This may also point to a weak or even incorrect connection between concepts of force and pressure (Kautz et al., 2005a).
Students related temperature with heat transfer
42
Zitzewitz, 2006; Madden et al. 2011), so this indicated that students in the 21st century held a similar misconception of heat as held by scientists in the 18th century (Brush, 1976) in Niaz (2006). Another explanation of student strongly relating heat transfer and temperature is that students are familiar with the equation Q=mcΔT (Taleab & Wattanakasiwich, 2010). Both Australian and Thai students had been taught this equation in school science, so the students may have a strong conception relating heat transfer with temperature.
Please use the following information to answer questions 11-12.
Three identical cylinders are filled with unknown
quantities of ideal gases. The cylinders are closed with
identical frictionless pistons of mass M. Cylinder A and
B are in thermal equilibrium with the room at 20°C, and cylinder C is kept at a temperature of 80°C. The piston of each cylinder is in mechanical equilibrium with the environment.
11. How does the pressure of nitrogen gas in cylinder A compare with the pressure of hydrogen gas in cylinder B?
A) Greater B) Less than C) Same
12. How does the pressure of hydrogen gas in cylinder B compare with the pressure of hydrogen gas in cylinder C?
A) Greater B) Less than C) Same
Figure 7: Question 11-12 on the Thermodynamic Concept Survey (TCS)
C. The first law of thermodynamics
Adiabatic Process
Questions 17-19 (as shown in Figure 8) were designed to be applications of the first law of thermodynamics in an adiabatic process. As shown in Table 8, most students still had difficulties, especially with work done by the system (question 17) and heat transfer between the system and the environment (question 18). In question 17, a noticeable percentage of students (40-60%) seem to be confused saying that the work done by the system increases during a compression adiabatic process, answer A. An earlier study found the same results when interviewing students confirming that they had difficulties recognizing the sign assigned to work (Loverude et al., 2002; Meltzer, 2004). In question 18, the predominant alternative choice A indicates that most students did not recognize that the given process is adiabatic. In question 19, most students answered correctly about the change of internal energy in the compressed adiabatic process. Most of them might not have a problem because they relate the change in internal energy with temperature, as they thought that the temperature of the system increases with the internal energy.
Isobaric Process
43
conservation of energy and overlook the work done when the system expanded (Meltzer, 2004).
Please use the following information to answer questions 16-19.
A cylindrical pump contains one mole of an ideal gas. The piston fits tightly so that no gas escapes, and friction is negligible between the piston and the cylinder walls. The piston is quickly pressed inward so the volume of gas reduces instantly.
16. How does the temperature of the gas change?
A) Increase B) Decrease C) Remains unchanged
17. How does the total work done by the system (gas) change?
A) Increase B) Decrease C) Remains unchanged
18. How does the heat transferred into the system (gas) change?
A) Increase B) Decrease C) Remains unchanged
19. How does the internal energy of the gas change?
A) Increase B) Decrease C) Remains unchanged
Figure 8: Question 17-19 on the Thermodynamic Concept Survey (TCS)
Isothermal Process
Questions 22 and 23 are applications of the first law in the isothermal process. In question 22, most students seemed to understand that the total kinetic energy of gas molecules remains unchanged because it was stated that the temperature was the same. This result indicated that most students had no problem related the temperature to the total kinetic energy. However in question 23, most answered incorrectly when asked about the net heat transfer. The predominant choice A indicated that most students thought that there is no heat transfer because the temperature remains the same. This result indicated the same misconception of heat and temperature which were found to correspond to most incorrect answers.
Isochoric Process
Question 24 is the only question investigating an isochoric process. Many students seemed to have difficulties relating work and energy-transfer in the isochoric process. Answer D and E indicated that students might not understand that this system is an isochoric process, so they still considered that the work done by the system is not zero. This result agreed with analysis of one-on-one interviews from a Meltzer (2004) study.
Cyclic Process
44
In question 27, many students chose answer A. The total heat transfer from water to gas equals zero and they might be confusing the total heat transfer with total change of internal energy. Many students also picked answer C. They might only focus on step 1 in the process where the water container is gradually heated and the heat transfer from water to gas is greater than zero.
P-V diagram
In questions 29-31, we investigated an application of the first law of thermodynamics on the P-V diagram of a cyclic process. Question 29 asked about the total work done by the gas, most students answered correctly. However, a predominant answer C indicated that students still did not understand the total work done by the enclosed area, so they answered the total work done is zero. Question 30 is about heat transfer and most students responded incorrectly by choosing choice C, that the total heat transfer is zero. This result might indicate student misunderstanding of heat transfer and temperature, and students did not apply the first law of thermodynamics to answer about heat transfer. In question 31, most students understood correctly that the change in internal energy is zero in a cyclic process. In conclusion, most students had misconceptions that total heat transfer and net work done in a cyclic process were zero. Meltzer (2004) interviewed students and found that students who answered net heat transferred to the system were zero because they believed that there was no net change in temperature. Similar reasoning was used to explain a zero net work done by a system. Students thought that there was no net change in volume.
In questions 32-34, we also investigated an application of the first law of thermodynamics on the P-V diagram of two processes. Most students (more than 50%) answered both questions 32 and 33 about work done by the system and the change in internal energy correctly. However, many students answered question 34 about heat transfer incorrectly. The dominant incorrect answer C, the heat transfer is zero, indicated that students did not apply the first law of thermodynamics to answer this question. They can interpret the work done from the area underneath the graph. The changes of internal energy of these two processes are the same because they start and finish at the same states. Students could use the interpretation of the work and the change in internal energy with the first law of thermodynamics to determine the heat transfer. The same question was posted and students interviewed by Meltzer (2004), finding that many students believed heat is a state function. The students provided reasoning that if the two processes end up at the same points; they will have the same heat transfer (Meltzer, 2004).
Question 35 investigated student interpretation of work done by the system from a P-V diagram. Most students (46% and 45%) answered incorrectly. This result indicated that most students still had difficulties associating work done by the system with the area enclosed by the graph. Students who answered C might relate the work done on a system to the net change in volume, so they thought that works from both processes are equal (Meltzer, 2004). Also, students might misunderstand that work is path independent (Meltzer, 2004).
45
employ them as concept questions during Peer Instruction (Mazur, 1997). Otherwise, interactive lecture demonstrations (Tanahoung et al., 2009; Sokoloff & Thornton, 1997) similar to several contexts in the TCS can be used to engage students and confront their misconception through discussions with their peers.
Conclusion
Firstly, this study described the construction of the TCS based on previous physics education research studies in the area of thermodynamics in order to shorten the process of conceptual survey construction. After a trial with graduate students, five questions that covered the same topics as other questions were removed. The trials of TCS were conducted with first-year undergraduates and second-year undergraduatess at one university in Thailand and at one in Australia. In order to cover both Thai and Australian high school curriculums, the survey was divided into two parts. The shorter first part can be used independently or integrated into the whole survey as a post-test.
Secondly, the validity and reliability of the survey were established by using results from Australia and Thailand. A few items have a low point-biserial coefficient and item discrimination index. However, they are not necessarily bad items; they are an important indicator of concepts that most students have difficulties with or of predominant misconceptions (Adams & Wieman, 2011). Therefore, the TCS is considered to be valid and reliable.
Thirdly, we implemented the survey to investigate areas of student difficulty. After instruction in first year thermodynamics, students’ responses imply that they still had the misconceptions described in previous studies (Yeo & Zadnik, 2001; Sokoloff & Thronton, 2001; Niaz, 2000; Kautz et al., 2005a; Loverude et al., 2002; Meltzer, 2004; Kautz et al., 2005b). However in the earlier questions on temperature and heat transfer, students did much better than in later questions on the first law of thermodynamics and more complicated thermal processes. Examples of predominant misconceptions are: (1) incorrectly relating pressure with temperature, (2) incorrectly relating heat transfer with temperature, (3) mixing up work done on and work done by the system, and (4) treating heat transfer as a state function. Also, students had difficulties applying the first law of thermodynamics to determining heat transfer from P-V diagram. Our results also supported the observation that students used functional-reduction reasoning when encountering multi-variable situations, in this case the specific heat equation and the ideal gas law. Rozier and Viennot (1991) found that many students used functional-reduction reasoning when they had to consider multiple variables (>2). They reduced those variables to two variables so that they could comprehend that situation using a linear casual reasoning or a linear chain of argument. Previous studies found students using functional-reduction reasoning in many conceptual areas such as three kinematic variables (Rozier & Viennot, 1991) and propagation of waves in strings (Maurines, 1986).
In conclusion, the thermodynamic conceptual survey provides teachers with a valuable resource for evaluating student understandings both at the beginning of a thermodynamic course and at the end, and the questions in the TCS can be used as teaching materials to help students overcome major difficulties in learning thermodynamics.
46
The authors would like to thank Thailand Center of Excellence in Physics (ThEP), Graduate school and Faculty of Science, Chiang Mai University, Thailand. The research would not have been possible without students from both universities completing surveys and support from the School of Physics, University of Sydney. Also, the authors would like to thank 2011 Endeavour Research Fellowship award for supporting the first author in conducting this research in Australia.
References
Adams, W. K., & Wieman, C. E. (2011). Development and validation of instruments to measure learning of expert-like thinking. International Journal of Science Education, 33, 1289-1312.
Bardar, E. M., Prather, E. E., Brecher, K., & Slater, T. F. (2006). Development and validation of the light and spectroscopy concept inventory. Astronomy Education Review, 2, 103-113.
Beichner, R. (1994). Testing student interpretation of kinetics graphs. American Journal of Physics, 62, 750-756.
Cataloglu, E., & Robinett, R. W. (2002). Testing the development of student conceptual and visualization understanding in quantum mechanics through the undergraduate career. American Journal of Physics, 70, 238-251.
Ding, L., Chabay, R., Sherwood, B., & Beichner, R. (2006). Evaluating an electricity and magnetism assessment tool: Brief electricity and magnetism assessment. Physical Review Special Topics-Physics Education Research, 2(010105), 1-7.
Ding, L. (2007). Designing an energy assessment to evaluate student understanding of energy topics (Doctoral dissertation). Retrieved March 2, 2008, from http://www.lib.ncsu.edu/theses/available/etd-06032007-181559/.
Ding, L., & Beichner, R. (2009). Approaches to data analysis of multiple-choice questions. Physical Review Special Topics-Physics Education Research, 5(020103), 1-17.
Engelhardt, P. V., & Beichner, R. J. (2004). Students’ understanding of direct current resistive electrical circuits.
American Journal of Physics, 72, 98-115.
Harrison, A. G., Grayson, D. J., & Treagust, D. F. (1999). Investigating a grade 11 student’s evolving conceptions of heat and temperature. Journal of Research in Science Teaching, 36, 55-87.
Hestenes, D., Wells, M., & Swackhamer, G. (1992). Force concept inventory. The Physics Teacher, 30, 141-158.
Hestenes, D., & Wells, M. (1992). A mechanics baseline test. The Physics Teacher, 30, 159-166.
Jasien, P. G., & Oberem, G. E. (2002). Understanding of elementary concepts in heat and temperature among college students and K-12 teachers. Journal of Chemical Education, 79, 889-895.
Kautz, C. H., Heron, P. R. L., Loverude, M. E., & McDermott, L. C. (2005a). Student understanding of the ideal gas law, Part I: A macroscopic perspective. American Journal of Physics, 73, 1055-1063.
Kautz, C. H., Heron, P. R. L., Shaffer, P. S., & McDermott, L. C. (2005b). Student understanding of the ideal gas law, Part II: a microscopic perspective. American Journal of Physics, 73, 1064-1071.
Laburú, C. E., & Niaz, M. (2002). A Lakatosian framework to analyse situations of cognitive conflict and controversy in students’ understanding of heat energy and temperature. Journal of Science Education and Technology, 11, 211-219.
Loverude, M. E., Kautz, C. H., & Heron, P. R. L. (2002). Student understanding of the first law of
thermodynamics: Relating work to the adiabatic compression of an ideal gas. American Journal of Physics, 70, 137-148.
Lowe, D. (1991). How to do it: Set a multiple choice question (MCQ) examination. BMJ, 302, 780-782. Luera, G. R., Otto, C. A., & Zitzewitz, P. W. (2006). Use of the thermal concept evaluation to focus instruction.
The Physics Teacher, 44, 162-166.
Madden, S. P., Jones, L. L., & Rahm, J. (2011). The role of multiple representations in the understanding of ideal gas problems. Chemistry Education Research and Practice, 12, 283-293.
Maloney, D. P., O’ Kuma, T. L., Hieggelke, C. J., & Van Heuvelen, A. (2001). Surveying students’ conceptual understanding of electricity and magnetism. American Journal of Physics, 69, S12-S23.
Maurines, L. (1992). Spontaneous reasoning on the propagation of visible mechanical signals. International Journal of Science Education, 14, 279-293.
Mazur, E. (1997). Peer Instruction: A User’s Manual. Upper Saddle River, New Jersey: Prentice Hall. McDermott, L. C. (2001). Oersted medal lecture 2001: “Physics Education Research—the key to student
learning”. American Journal of Physics, 69, 1127-1137.
47
Meltzer, D. E. (2004). Investigation of students’ reasoning regarding heat, work, and the first law of
thermodynamics in an introductory calculus-based general physics course. American Journal of Physics, 72, 1432-1446.
Niaz, M. (2000). A framework to understand students’ differentiation between heat energy and temperature and its educational implications. Interchange, 31, 1-20.
Niaz, M. (2006). Can the study of thermochemistry facilitate students’ differentiation between heat energy and temperature? Journal of Science Education and Technology, 15, 269-276.
Paosawatyanyong, B., & Wattanakasiwich, P. (2010). Implication of physics active-learning in Asia. Latin American Journal of Physics Education, 4, 501-505.
Portney, L. G., & Watkins, M. P. (2008). Foundations of Clinical Research: Applications to Practice. Boston, Massachusetts: Prentice Hall.
Rhoads, T. R., & Roedel, R. J. (1999). The wave concept inventory—A cognitive instrument based on Bloom’s taxonomy. Proceedings of the 29th ASEE/IEEE Frontiers in Education Conference, USA, 13c1, 14-18.
Rimoldini, L. G., & Singh, C. (2005). Student understanding of rotational and rolling motion concepts. Physical Review Special Topics-Physics Education Research, 1(010102), 1-9.
Rozier, S., & Viennot, L. (1991). Students’ reasoning in thermodynamics. International Journal of Science Education, 13, 159-170.
Sharma, M. D., Johnston, I. D. , Johnston, H., Varvell, K., Robertson, G., Hopkins, A., Stewart, C., Cooper, I. & Thornton, R. (2010). Use of interactive lecture demonstrations: A ten year study, Physical Review Special Topics-Physics Education Research, 6(020119), 1-9.
Shayer, M., & Wylam, H. (1981). The development of the concepts of heat and temperature in 10-13 year-olds.
Journal of Research in Science Teaching, 18, 419-434.
Singh, C., & Rosengrant, D. (2003). Multiple-choice test of energy and momentum concepts. American Journal of Physics, 71, 607-617.
Sireci, S. G. (1998). Gathering and analyzing content validity data. Educational Assessment, 5, 299-321. Sokoloff, D. R., & Thornton, R. K. (1997). Using interactive lecture demonstrations to create an active learning
environment. The Physics Teacher, 35, 340-347.
Sokoloff, D. R. (2001). Electric Circuits Conceptual Evaluation. Retrieved June 10, 2007, from http://physics.dickinson.edu/~wp_web/wp_resources/ wp_assessment.html.
Sokoloff , D. R., & Thronton, R. K. (2001). Heat and Temperature Conceptual Evaluation. Retrieved June 10, 2007, from http://physics.dickinson.edu/∼wp_web/wp_resources/wp_assessment.html.
Sokoloff, D. R. (2006). Light and Optics Conceptual Evaluation. Active Learning in Optics and Photonics: Training Manual, UNESCO.
Taleab, P., & Wattanakasiwich, P. (2010). Development of thermodynamic conceptual evaluation. In B. Paosawatyanyong & P. Wattanakasiwch (Eds.), Proceedings of International Conference on Physics Education 2009 (pp.183-186). Melvilled, NY: American Institute of Physics.
Tanahoung, C., Chitaree, R., Soankwan, C., Sharma, M. D., & Johnston, I. D. (2009). The effect of interactive lecture demonstrations on students’ understanding of heat and temperature: a study from Thailand. Research in Science & Technological Education, 27, 61-74.
Thornton, R., & Sokoloff, D. R. (1998). Assessing student learning of Newton’s laws: The force and motion conceptual evaluation and the evaluation of active learning laboratory and lecture curricula. American Journal of Physics,66, 338-352.
Tongchai, A., Sharma, M. D., Johnston, I. D., Arayathanitkul, K., & Soankwan, C. (2009). Developing, evaluating and demonstrating the use of a conceptual survey in mechanical waves. International Journal of Science Education, 31, 2437-2457.
Wieman, C., & Perkins, K. (2005). Transforming Physics Education. Physics Today, 58, 36-41.
Wuttiprom, S., Sharma, M. D., Johnston, I. D., Chitaree, R., & Soankwan, C. (2009). Development and use of a conceptual survey in introductory quantum physics. International Journal of Science Education, 31, 631-654.
48
Appendix: Supplementary auxiliary material
Directions: For each question, please indicate your answer by circling a choice.
1. Cup A contains 100 grams of water at 0°C but cup B contains 200 grams of water at 50°C. The contents of the two cups are mixed together in an insulated container (no heat transfer occurs). When it reaches thermal equilibrium, what is the final temperature of the water in the container?
A) Between 0°C and 25°C B) 25°C
C) Between 25°C and 50°C D) 50°C
E) Higher than 50°C
2. Jim believes he must use boiling water to make a cup of tea. He tells his friends that, “I couldn’t make tea if I was camping on a high mountain because water doesn’t boil at high altitudes.” Which statement do you strongly agree with?
A) Joys says, “Yes it does, because the water boils below 100°C because the pressure decreases.” B) Tay says, “Jim is incorrect because water always boils at the same temperature.”
C) Lou says, “The boiling point of the water decreases, but the water itself is still at 100°C.” D) Mai says, “I agree with Jim. The water never gets to its boiling point.”
3. Cup A contains 100 grams of water and cup B contains twice as much water. The water in both cups was initially at room temperature. Then the water in cup A was heated to 75°C and the water in cup B was heated to 50°C. When the water in both cups cooled down to room temperature, which cup had more heat transferred from it?
A) Cup A had more heat transferred out. B) Cup B had more heat transferred out.
C) Both cups had the same amount of heat transferred. D) Not enough information is given to determine the answer.
4. If 100 grams of ice at 0°C and 100 grams of water at 0°C are put into a freezer, which has a temperature below 0°C. After waiting until their temperature equals to the freezer temperature, which one will eventually lose the greatest amount of heat?
A) The 100 grams of ice.
B) The 100 grams of water.
C) They both lose the same amount of heat because their initial temperatures are the same. D) There is no answer because ice does not contain any heat.
E) There is no answer because you cannot get water at a temperature of 0°C.
5. Jan announces that she does not like sitting on the metal chairs in the room because “when touching it, they are colder than the plastic ones.” Which statement do you strongly agree with?
A) Jim agrees and says, “The metal chairs feel colder because metal is naturally colder than plastic.” B) Kip says, “The metal chairs are not colder because they are at the same temperature.”
C) Lou says, “The metal chairs are not colder, the metal ones just feel colder because they are heavier.”
D) Mai says, “The metal chairs are colder because metal absorbs the heat from body faster.”
6. Kim picks up two rulers, a metal one and a wooden one. He announces that the metal one feels colder than the wooden one. What is your preferred explanation for this situation to Kim?
A) Metal conducts heat faster than wood.
B) Wood is naturally a warmer substance than metal.
C) Metals are better heat radiators than wood.
49
A
2 L B
1 L 7. Cup A contains 2 liters of water and cup B contains 1 liter of water. The water in both cups was initially at room temperature. Then both cups are placed on a hot plate and
heated until the water in the cup is boiling (100°C). Which statement is correct?
A) Water in both cups has the same heat transfer. B) Water in cup A has more heat transfer. C) Water in cup B has more heat transfer.
Please use the following information to answer questions 8-10.
A syringe that contains an ideal gas and has a frictionless piston of mass M is moved from a beaker of cold water to a beaker of hot water. Answer the following questions and consider that the syringe reaches thermal equilibrium with hot water.
8. How does the gas temperature change?
A) Increase B) Decrease C) No change
9. How does the gas pressure change?
A) Increase B) Decrease C) No change
10. How does the gas volume change?
A) Increase B) Decrease C) No change
Please use the following information to answer questions 11-12.
Three identical cylinders are filled with unknown quantities of ideal gases. The cylinders are closed with identical frictionless pistons of mass M. Cylinder A and B are in thermal equilibrium with the room at 20°C, and cylinder C is kept at a temperature of 80°C. The piston of each cylinder is in mechanical equilibrium with the environment.
11. How does the pressure of nitrogen gas in cylinder A compare with the pressure of hydrogen gas in cylinder B?
A) Greater B) Less than C) Same
12. How does the pressure of hydrogen gas in cylinder B compare with the pressure of hydrogen gas in cylinder C?
A) Greater B) Less than C) Same
Please use the following information to answer questions 13-15.
An ideal gas is contained in a cylinder with a tightly-fitting piston so that no gas escapes. Several small masses are on the piston. (Neglect friction between the piston and the cylinder walls.) The cylinder is placed in an insulating jacket. A large number of masses are quickly added to the piston.
13. How does the temperature of the gas change?
A) Increase B) Decrease C) Remains unchanged
14. How does the pressure of the gas change?
50
15. How does the volume of the gas change?
A) Increase B) Decrease C) Remains unchanged
Please use the following information to answer questions 16-19.
A cylindrical pump contains one mole of an ideal gas. The piston fits tightly so that no gas escapes, and friction is negligible between the piston and the cylinder walls. The piston is quickly pressed inward so the volume of gas reduces instantly.
16. How does the temperature of the gas change?
A) Increase B) Decrease C) Remains unchanged
17. How does the total work done by the system (gas) change?
A) Increase B) Decrease C) Remains unchanged
18. How does the heat transferred into the system (gas) change?
A) Increase B) Decrease C) Remains unchanged
19. How does the internal energy of the gas change?
A) Increase B) Decrease C) Remains unchanged
Please use the following information to answer questions 20-25.
A fixed quantity of ideal gas is contained within a metal cylinder that is sealed with a movable, frictionless, insulating piston. (The piston can move up or down without the slightest resistance from friction, but no gas can enter or leave the cylinder. The piston is heavy, but there can be no heat transfer to or from the piston itself.) The cylinder is surrounded by a large container of water with high walls as shown.
Step 1. Start of Process # 1: The water container is gradually heated, and the piston very slowly moves upward. At time B the heating of the water stops, and the piston stops moving when it is in the position shown in the diagram below:
51
remains practically constant. (That is, it remains at the temperature it reached at time B, after the water had been heated up.)
Step 3. At time C we stop adding lead weights to the container and the piston stops moving. (The weights that were added until now are still in the containers.) The piston is now found to be at exactly the same position it was at time A.
Step 4. Now, the piston is locked into place so it cannot move; the weights are removed from the piston. The system is left to sit in the room for many hours, and eventually the entire system cools back down to the same room temperature it had at time A. When this finally happens, it is time D.
Step 5. Now let us begin Process # 2. The piston is unlocked so it is again free to move. We start from the same initial situation as shown at time A and D (i.e., same temperature and position of the piston). Just as before, the water is heated and we watch as the piston rises. However, this time, heat transfers to the water for a longer period of time. As a result, the piston ends up higher than it was at time B in Process # 1. The piston then continues from step 2 to step 4 and the final state when the weights are removed occurs at time E.
20. During the process that occurs from time A to time B, which following statement about work is true?
A) Positive work is done on gas by the environment. B) Positive work is done by the gas on the environment. C) No net work is done on or by the gas.
21. During the process that occurs from time A to time B, the gas absorbs x Joules of energy from the water. What happens to the total kinetic energy of all of the gas molecules?
A) Increases by more than x Joules. B) Increases by x Joules.
C) Increases, but less than x Joules. D) Remains unchanged.
E) Decreases by less than x Joules. F) Decreases by x Joules.
52
22. During the process that occurs from time B to time C, what happens to the total kinetic energy of all gas molecules?
A) Increase B) Decrease C) Remain unchanged
23. During the process that occurs from time B to time C, is there any net heat transferred between the gas and the water?
A) There is the net heat transferred from gas to water. B) There is the net heat transferred from water to gas. C) There is no heat transferred.
24. During the process that occurs from time C to time D, y Joules of heat transfer occurs from the gas to the water. What happens to the total kinetic energy of all of the gas molecules?
A) Increases by more than y Joules. B) Increases by y Joules.
C) Increases, but by less than y Joules. D) Remains unchanged.
E) Decreases by less than y Joules. F) Decreases by y Joules.
G) Decreases by more than y Joules.
25. Which P-V diagram best describes the process that occurs from time A to time D?
A) B)
C) D)
For questions 26-28, please consider the process that occurs from time A to time D, and then to time E.
26. What is the net work done by the gas on the environment during that process?
A) Equal to zero. B) Less than zero. C) Greater than zero.
27. What is the heat transfer from water to gas during the process?
A) Equal to zero. B) Less than zero. C) Greater than zero.
28. Consider the total kinetic energy of all the gas molecules at time A, D, and E; call thoseKEA,
D
KE , and KEE. Rank these in order of magnitude of total kinetic energy of the gas molecules at these times.
A) KEA>KED >KEE B) KEA<KED <KEE
53
Please use the following information to answer questions 29-31.
A student performs an experiment with an ideal gas that is contained in a cylinder with a piston. The P-V diagram below shows the values of pressure and volume of the gas throughout the experiment, starting at point X, continuing to points Y and Z, and returning to point X. Process Z à X is isothermal.
29. What is the total work done by the gas in the entire cycle (XàYàZàX)?
A) Positive B) Negative C) Zero
30. What is the total heat transfer for the entire cycle (XàYàZàX)?
A) Positive B) Negative C) Zero
31. What is the change of internal energy of the gas in the entire cycle (XàYàZàX)?
A) Positive B) Negative C) Zero
Please use the following information to answer questions 32-34.
This P-V diagram represents a system consisting of a fixed amount of ideal gas that can undergo two different processes in going from state A to state B through Process #1 and Process #2.
32. Work done by the system in Process # 1 is ________ than Process # 2.
A) greater than B) less than C) equal to
33. The change in internal energy of all molecules in the system for Process #1 is _____ than Process # 2.
A) greater than B) less than C) equal to
34. Heat transferred into the system in Process # 1 is ________ than Process # 2.
A) greater than B) less than C) equal to
35. A student performs an experiment with an ideal gas that is confined to a cylinder with a piston. The P-V diagram below shows the values of pressure and volume of the gas throughout the experiment, starting at point X and ending at point Z. Compare the absolute value of the work done during process X→2→Z (a dash
line) and process X→1→Z (a bold line). Which statement is correct?
A) X→2→Z is greater than X→1→Z. B) X→2→Z is less thanX→1→Z.