RESEARCH
Reproducibility of serum IgE, Ara h2 skin
prick testing and fraction of exhaled nitric oxide
for predicting clinical peanut allergy in children
Elizabeth Percival
1,2,4, Rani Bhatia
3,4, Kahn Preece
1,5, Patrick McElduff
4, Mark McEvoy
4, Adam Collison
1,4and Joerg Mattes
1,4,6*Abstract
Background: Ara h2 sIgE serum levels improve the diagnostic accuracy for predicting peanut allergy, but the use of Ara h2 purified protein as a skin prick test (SPT), has not been substantially evaluated. The fraction of exhaled nitric oxide (FeNO) shows promise as a novel biomarker of peanut allergy. Reproducibility of these measures has not been determined. The aim was to assess the accuracy and reproducibility (over a time-period of at least 12 months) of SPT to Ara h2 in comparison with four predictors of clinical peanut allergy (Peanut SPT, Ara h2 specific Immunoglobulin E (sIgE), Peanut sIgE and FeNO).
Methods: Twenty-seven children were recruited in a follow-up of a prospective cohort of fifty-six children at least 12 months after an open-labelled peanut food challenge. Their repeat assessment involved a questionnaire, SPT to peanut and Ara h2 purified protein, FeNO and sIgE to peanut and Ara h2 measurements.
Results: Ara h2 SPT was no worse in accuracy when compared with peanut SPT, FeNO, Ara h2 sIgE and peanut sIgE (AUC 0.908 compared with 0.887, 0.889, 0.935 and 0.804 respectively) for predicting allergic reaction at previous food challenge. SPT for peanut and Ara h2 demonstrated limited reproducibility (ICC = 0.51 and 0.44); while FeNO dem-onstrated good reproducibility (ICC = 0.73) and sIgE for peanut and Ara h2 were highly reproducible (ICC = 0.81 and 0.85).
Conclusions: In this population, Ara h2 SPT was no worse in accuracy when compared with current testing for the evaluation of clinical peanut allergy, but had—like peanut SPT—poor reproducibility. FeNO, peanut sIgE and Ara h2 sIgE were consistently reproducible despite an interval of at least 12 months between the repeated measurements. Keywords: Peanut, Allergy, Anaphylaxis, Predict, Reproducibility, Ara h2, Skin prick test, Fraction exhaled nitric oxide, Peanut sIgE, Ara h2 sIgE
© 2016 The Author(s). This article is distributed under the terms of the Creative Commons Attribution 4.0 International License (http://creativecommons.org/licenses/by/4.0/), which permits unrestricted use, distribution, and reproduction in any medium, provided you give appropriate credit to the original author(s) and the source, provide a link to the Creative Commons license, and indicate if changes were made. The Creative Commons Public Domain Dedication waiver (http://creativecommons.org/ publicdomain/zero/1.0/) applies to the data made available in this article, unless otherwise stated.
Background
Peanut allergy can be a life threatening event and accounts for approximately two-thirds of all fatal food-induced anaphylaxis [1]. In a recent Australian population based study [2], the prevalence of peanut sensitisation [by skin prick testing (SPT)] in infants was 6.4 %, with a prevalence of clinical allergy (confirmed by
oral food challenge) of 2.9 %. Furthermore, clinical pea-nut allergy resolves in up to 20 % of children [3] but the processes involved in resolution are not fully understood [4].
Current testing to confirm sensitisation to peanut includes SPT to peanut protein and specific immu-noglobulin E (sIgE) antibodies to peanut [5]. The gold standard for diagnosing clinical allergy is a double-blind placebo-controlled oral food challenge [6]. However, there is the associated risk of severe allergic reaction (including anaphylaxis), financial cost to health care (to provide beds and supervision), and finally time involved
Open Access
*Correspondence: [email protected]
1 Experimental & Translational Respiratory Medicine Group, Hunter Medical Research Institute, University of Newcastle, Lookout Road, New Lambton, Newcastle, NSW 2305, Australia
for patients, their families and health care professionals. To alleviate this, in clinical practice it is routine to con-duct open-labelled food challenges [2, 7] and to exclude children at extremely low or high risk for clinical allergy from food challenge employing (a set of) non-invasive biomarkers. For instance, the resulting size of SPT wheal to whole peanut antigen or levels of sIgE antibodies to peanut is thought to correlate with an increasing likeli-hood of reaction [8, 9], but not with increasing severity of the reaction at food challenge [6]. While these tests con-firm an allergy based on a significant clinical history, they do not suggest how severe the reaction will be on subse-quent exposures. Monitoring these values over time may assist with identifying patients who are likely to outgrow their allergies (decreasing size of SPT wheal). However, as SPT is an operator driven test this type of deduction may at times be erroneous, placing children at risk of allergic reaction at a food challenge.
Prospectively measured levels of serum sIgE against the peanut component Ara h2 have been investigated and when used in combination with peanut SPT, found to improve the diagnostic accuracy and reduce the need for oral peanut challenge [5, 7]. Two studies published in 2007 [10, 11] have investigated the use of Ara h2 purified protein as a SPT reagent, but there has been no further published data reporting on its use.
Fraction of exhaled nitric oxide (FeNO) is a non-invasive marker that has been shown to correlate with allergic airways inflammation and IgE sensitisation [12]. Additionally, there appears to be enhanced prediction of peanut allergy prior to food challenge when combining measurement of FeNO with current testing (peanut SPT and Ara h2 sIgE) [7].
The primary aim of this study was to assess the accu-racy of purified Ara h2 protein SPT in comparison with four predictors of peanut allergy (peanut SPT, peanut sIgE, Ara h2 sIgE and FeNO). The secondary aim was to assess the reproducibility (over a time-period of at least 12 months) of Ara h2 SPT, in comparison with the same four predictors of peanut allergy, by following-up a popu-lation of children studied previously [7].
Methods Study population
Twenty-seven children were able to be recruited in fol-low-up from a cohort of fifty-six children enrolled in an earlier prospective study [7] that had involved chil-dren scheduled for open-labelled peanut food challenge by their paediatric allergist at a tertiary referral paedi-atric allergy centre in Newcastle, Australia. Their food challenge in the initial study had been scheduled to (1) confirm a peanut allergy diagnosis, (2) assess for the pos-sibility of acquired tolerance, (3) test for clinical reactivity
in children who had not consumed peanut but were sen-sitised, or (4) had significant parental concern and anxi-ety [7]. Participants were excluded from the earlier study if their SPT to whole peanut extract was ≥10 mm [7].
The original cohort (of fifty-six children) included thirty-two participants with a history of IgE mediated reactions, including anaphylaxis, not within the previous 12 months. Three participants who underwent food chal-lenge in the original study had equivocal chalchal-lenge results and were excluded from the data analysis.
Ethics and consent
The Hunter New England Health Human Research Eth-ics Committee approved both studies. Informed written consent was obtained from all parents or guardians prior to entry into the study, and from children as appropri-ate for their age. Participants from the earlier study were invited by telephone call from the Allergy Clinical Nurse Consultant to participate in this follow-up study.
Original cohort assessment
Prior to the food challenge, the original cohort (of fifty-six children) was assessed in a pre-challenge clinic. This clinic included assessing personal atopy and family his-tory of atopy by way of a modified version of a previ-ously validated parental questionnaire [13, 14]. Allergic rhinitis was assessed using paediatric validated allergic rhinitis and its impact on asthma (ARIA) criteria [15], where classification is according to symptom duration (intermittent or persistent) and severity (mild or moder-ate/severe). Each was then scored 1—intermittent mild, 2—intermittent moderate/severe, 3—persistent mild or 4—persistent moderate/severe. Eczema was assessed based on any previous medical diagnosis, and current “active treatment” including any current management other than emollients. Visible eczema was scored using the validated SCORing Atopic Dermatitis (SCORAD) system [16].
Serum was collected and analysed using ImmunoCAP 250 system (Phadia, AB, Uppsala, Sweden) for peanut sIgE and Ara h2-specific IgE.
FeNO was measured according to the American Tho-racic Society and European Respiratory Society (ATS/ERS) guidelines [18]. Online single-breath analysis (ECOMED-ICS, Duernten, Switzerland) was used with the requirement of an expiratory flow rate of 50 mL/s for a minimum of 2-s during at least a 4-s expiration time. A flow limiter main-taining constant minimum exhalation pressure of 5 cm H2O prevented nasal nitric oxide (NO) measurement. Measure-ments were repeated until criteria were met (2 results within 5 % or 3 within 10 %) and the mean was recorded.
The open-labelled food challenge to peanut was con-ducted according to Australasian Society of Clinical Immunology and Allergy (ASCIA) food challenge pro-tocol [19]. A medical officer, blinded to the results from the pre-challenge clinic, supervised all challenges. Chal-lenges were declared successful if there was no reaction during the food challenge and throughout the following week with regular ingestion of peanut. Challenges were declared unsuccessful if they had (1) anaphylaxis [which was defined according to ASCIA guidelines [20] or (2) clinical allergy, not anaphylaxis (CANA) when they dem-onstrated an IgE mediated reaction consistent with pub-lished pre-defined objective criteria [21].
Follow‑up cohort assessment
The follow-up study assessment was conducted over a six-month period and ranged from fifteen to thirty-two months after the individual participant’s original assess-ment. The assessment was conducted in the paediatric outpatients department of a tertiary children’s hospital and involved two stages—(1) undertaking the previously validated questionnaire [13, 14] (assessing the current degree of atopic disease and their family history of atopy) and —(2) SPT to whole peanut extract and purified Ara h2 protein, measuring FeNO, and blood collection to measure sIgE to peanut and Ara h2 (as described above).
Statistical methods
STATA 13.1 and GraphPad Prism 6.0 were used for sta-tistical evaluation and graphical presentation. Participant clinical features are presented as medians with minimum and maximum values for continuous variables (due to non-normal distribution), and frequency and percentages for categorical variables. Differences in participant clinical features between groups (defined by the results of their open food challenge in the original study) were tested using Mann–Whitney two-tailed test for continuous vari-ables and Fisher’s exact test for categorical varivari-ables.
Receiver Operator Characteristic (ROC) curves were produced in STATA 13.1 and used to assess the
ability of each measure in predicting an allergic reaction to peanuts. The area under the curve (AUC) is a sum-mary measure of the sensitivity and specificity of the measure for all possible cut points.
Reproducibility was assessed using repeatability coeffi-cient (CR) (calculated using Bland–Altman test in Graph-Pad Prism) and the Intra-class Correlation Coefficient (ICC) was calculated using a one-way random effects model in STATA 13.1.
Results
Participant clinical features
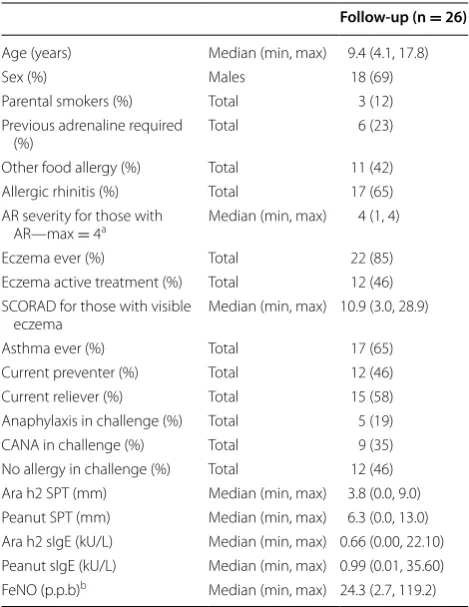
The median time between the original and follow-up measurements was 2.2 years. The clinical features are outlined in Table 1. There were no significant differ-ences when comparing the follow-up cohort with those who did not return for follow-up. (Additional file 1: Table S1).
Table 1 Participant clinical features of the follow-up cohort
One patient had an equivocal result at challenge and was excluded from the analysis
AR allergic rhinitis; SCORAD SCORing Atopic Dermatitis; CANA clinical allergy not anaphylaxis; SPT skin prick test; sIgE serum-specific IgE; FeNO fraction of exhaled nitric oxide
a For determination of rhinitis severity, see ‘‘Methods’’ section b Only 22 individuals in the follow-up cohort were able to perform FeNO
Follow‑up (n = 26)
Age (years) Median (min, max) 9.4 (4.1, 17.8)
Sex (%) Males 18 (69)
Parental smokers (%) Total 3 (12)
Previous adrenaline required
(%) Total 6 (23)
Other food allergy (%) Total 11 (42)
Allergic rhinitis (%) Total 17 (65)
AR severity for those with
AR—max = 4a Median (min, max) 4 (1, 4)
Eczema ever (%) Total 22 (85)
Eczema active treatment (%) Total 12 (46) SCORAD for those with visible
eczema Median (min, max) 10.9 (3.0, 28.9)
Asthma ever (%) Total 17 (65)
Current preventer (%) Total 12 (46)
Current reliever (%) Total 15 (58)
Anaphylaxis in challenge (%) Total 5 (19)
CANA in challenge (%) Total 9 (35)
Clinical features of follow up cohort
In the follow-up cohort there were statistically sig-nificant differences between the successful [no clinical allergy (CA) at food challenge] and unsuccessful (CA at food challenge) groups in regards to age, male sex ratio, previous adrenaline usage, and current use of a preven-ter for asthma (Table 2). The patients without CA were younger (P value 0.015, Table 2). There were more males in the group of children without CA (P value 0.036, Table 2). Previous adrenaline usage in the CA group was higher (P value 0.017, Table 2). There were more par-ticipants currently using a preventer for asthma in the group of children without CA (P value 0.045, Table 2). As expected, children with CA did not have exposure to peanuts subsequent to the challenge test (<0.0001, Table 2). Interestingly, two children who were described as tolerant (no CA at food challenge) in the original study have subsequently developed symptoms of food allergy after eating peanut subsequent to the original study and as such now avoid eating peanut. All other clinical features across the two groups did not reach sta-tistical significance for difference.
Data availability
Data for the peanut SPT were available for all twenty-seven individuals at the two time points. Only twelve individuals from the original group had data available for Ara h2 SPT, while twenty-seven individuals from the fol-low-up group had data available for Ara h2 SPT. Data for FeNO were available for twenty individuals at the two time points. Seven children had data missing from one or both time points due to being unable to perform sin-gle breath measurement of FeNO. Data were also avail-able for peanut sIgE and Ara h2 sIgE for all twenty-seven individuals at the two time points. Due to an equivocal result in their challenge in the original study, one indi-vidual was excluded from the analysis of the follow-up cohort.
Accuracy of Ara h2 SPT at predicting clinical outcome There was a statistically significant difference between groups for Ara h2 SPT wheal size (P value 0.0001, Table 2). This compared with peanut SPT (P value 0.0004, Table 2), Ara h2 sIgE (P value <0.0001, Table 2), peanut sIgE (P
value 0.0073, Table 2) and FeNO (P value 0.0018, Table 2).
Table 2 Follow-up cohort – divided by clinical allergy or not at food challenge in original study
One patient had equivocal result at food challenge and was therefore excluded from the analysis Italics indicate statistical significance P < 0.05
AR allergic rhinitis; No CA no clinical allergy; CA clinical allergy; SCORAD SCORing Atopic Dermatitis; CANA clinical allergy not anaphylaxis; SPT skin prick test; sIgE serum-specific IgE; FeNO fraction of exhaled nitric oxide
a For determination of rhinitis severity, see ‘‘Methods’’ section
b Following the successful challenge, two children subsequently developed symptoms at home after eating peanut and now avoid eating peanut c Only 9 individuals in the No CA group were able to perform FeNO, while 12 individuals in the CA group were able to perform FeNO
No CA n = 12 CA n = 14 P value
Age (years) Median (min, max) 6.8 (4.1, 15.9) 13.6 (4.5, 17.8) 0.015
Sex (%) Males 11 (92) 7 (50) 0.036
Parental smokers (%) Total 1 (8) 2 (14) 1.000
Previous adrenaline required (%) Total 0 (0) 6 (43) 0.017
Other food allergy (%) Total 6 (50) 5 (36) 0.692
AR (%) Total 9 (75) 8 (57) 0.429
AR severity for those with AR—max = 4a Median (min, max) 4 (1, 4) 3 (1, 4) 0.698
Eczema ever (%) Total 12 (100) 10 (71) 0.478
Eczema active treatment (%) Total 7 (58) 5 (36) 0.431
SCORAD for those with visible eczema Median (min, max) 19.2 (3.0, 28.9) 7.4 (3.4, 24.4) 0.460
Asthma ever (%) Total 9 (75) 8 (57) 0.429
Current preventer (%) Total 8 (67) 3 (21) 0.045
Current reliever (%) Total 8 (67) 7 (50) 0.453
Further exposure to peanut since challenge (%) Total 12 (100 %) 0 (0 %) <0.0001
Still eating peanuts at time of follow-up (%)b Total 10 (83 %) 0 (0 %) <0.0001
Ara h2 SPT (mm) (min, max) Median (min, max) 2.3 (0.0, 5.0) 6.5 (2.0, 9.0) 0.0001
Peanut SPT (mm) (min, max) Median (min, max) 4.0 (0.0, 8.5) 8.0 (5.0, 13.0) 0.0004
Ara h2 sIgE (kU/L) Median (min, max) 0.08 (0.00, 4.79) 2.21 (0.41, 22.1) <0.0001
Peanut sIgE (kU/L) Median (min, max) 0.31 (0.01, 35.60) 2.84 (0.32, 23.3) 0.0073
Clinical features of follow‑up cohort stratified for severity of clinical allergy
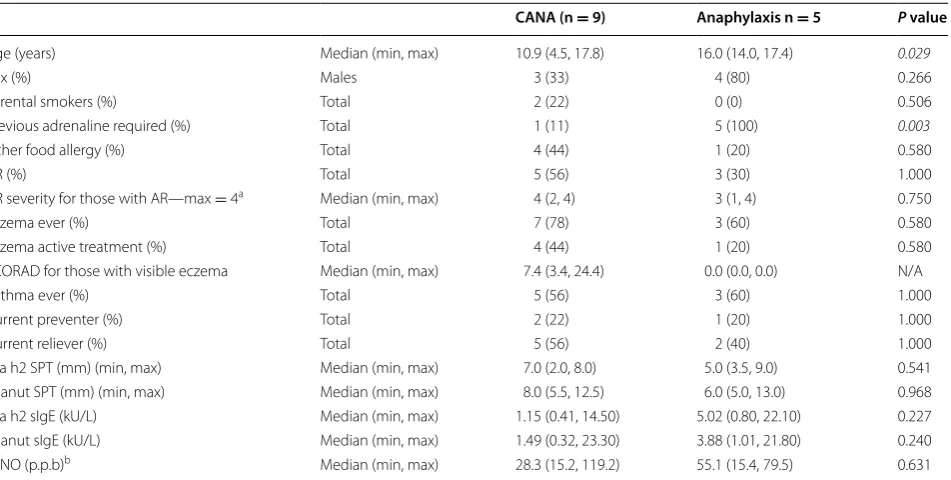
In the follow-up cohort, when the CA group was divided into subgroups of children with anaphylaxis or clinical allergy not anaphylaxis (CANA) based upon the result of their food challenge, there were significant differences between the groups in regards to age and previous adren-aline usage (Table 3). Median age was 16.0 years in the anaphylaxis group compared to 10.9 years in the CANA group (P value 0.029, Table 3). Previous adrenaline usage in the anaphylaxis group was higher than the CANA group (P value 0.003, Table 3). All other clinical features across the two groups did not reach statistical signifi-cance for difference.
Accuracy of Ara h2 SPT at predicting severity of reaction at challenge
When stratifying the clinical allergy group by severity of reaction at challenge (CANA or anaphylaxis), Ara h2 SPT did not show ability to differentiate between the groups (P value 0.541, Table 3). This compared with peanut SPT, Ara h2 sIgE, peanut sIgE and FeNO (P values between 0.227 to 0.968).
Accuracy of Ara h2 SPT at predicting clinical outcome— Allergy
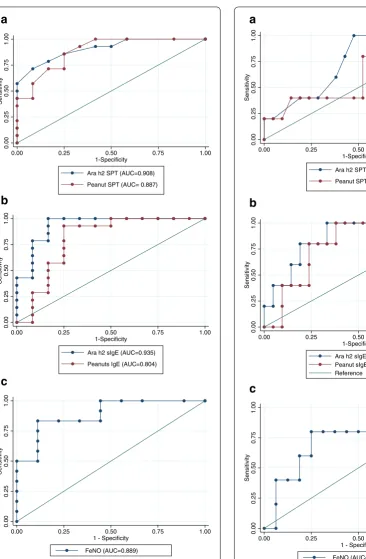
The AUC for Ara h2 SPT predicting allergy was 0.908, which compared with the AUC for peanut SPT, Ara h2 sIgE, peanut sIgE, and FeNO for predicting allergy (0.887, 0.935, 0.804 and 0.889 respectively, Fig. 1).
Accuracy of Ara h2 SPT at predicting clinical outcome— Anaphylaxis
The AUC for Ara h2 SPT predicting anaphylaxis was 0.738. This compared with the AUC for peanut SPT, Ara h2 sIgE, peanut sIgE and FeNO for predicting anaphy-laxis (0.638, 0.857, 0.791 and 0.763 respectively. Figure 2). Reproducibility
Reproducibility for Ara h2 SPT was limited [ICC = 0.44 and CR value −2.0 (Table 4)]. Peanut SPT reproducibility was also limited [ICC = 0.51 and CR value 0.85 (Table 4)]. Reproducibility was higher for FeNO [ICC = 0.73 and CR value −8.2 (Table 4)]. Finally, reproducibility was highest for Ara h2 sIgE [ICC = 0.85 and CR value 0.03 (Table 4)] and Peanut sIgE [ICC = 0.81 and CR value −0.10 (Table 4)].
Table 3 Follow-up cohort – divided by severity of clinical allergy at food challenge in original study
Italics indicate statistical significance P < 0.05
AR allergic rhinitis; SCORAD SCORing Atopic Dermatitis; CANA clinical allergy not anaphylaxis; SPT skin prick test; sIgE serum-specific IgE; FeNO fraction of exhaled nitric oxide
a For determination of rhinitis severity, see ‘‘Methods’’ section
b Only 7 individuals in the CANA group were able to perform FeNO, while all 5 individuals in the anaphylaxis group were able to perform FeNO
CANA (n = 9) Anaphylaxis n = 5 P value
Age (years) Median (min, max) 10.9 (4.5, 17.8) 16.0 (14.0, 17.4) 0.029
Sex (%) Males 3 (33) 4 (80) 0.266
Parental smokers (%) Total 2 (22) 0 (0) 0.506
Previous adrenaline required (%) Total 1 (11) 5 (100) 0.003
Other food allergy (%) Total 4 (44) 1 (20) 0.580
AR (%) Total 5 (56) 3 (30) 1.000
AR severity for those with AR—max = 4a Median (min, max) 4 (2, 4) 3 (1, 4) 0.750
Eczema ever (%) Total 7 (78) 3 (60) 0.580
Eczema active treatment (%) Total 4 (44) 1 (20) 0.580
SCORAD for those with visible eczema Median (min, max) 7.4 (3.4, 24.4) 0.0 (0.0, 0.0) N/A
Asthma ever (%) Total 5 (56) 3 (60) 1.000
Current preventer (%) Total 2 (22) 1 (20) 1.000
Current reliever (%) Total 5 (56) 2 (40) 1.000
Ara h2 SPT (mm) (min, max) Median (min, max) 7.0 (2.0, 8.0) 5.0 (3.5, 9.0) 0.541
Peanut SPT (mm) (min, max) Median (min, max) 8.0 (5.5, 12.5) 6.0 (5.0, 13.0) 0.968
Ara h2 sIgE (kU/L) Median (min, max) 1.15 (0.41, 14.50) 5.02 (0.80, 22.10) 0.227
Peanut sIgE (kU/L) Median (min, max) 1.49 (0.32, 23.30) 3.88 (1.01, 21.80) 0.240
0.00
0.25
0.50
0.75
1.00
Sensitivity
0.00 0.25 0.50 0.75 1.00
FeNO (AUC=0.889)
0.00
0.25
0.50
0.75
1.00
Sensitivity
0.00 0.25 0.50 0.75 1.00
Ara h2 sIgE (AUC=0.935)
Peanuts IgE (AUC=0.804)
0.00
0.25
0.50
0.75
1.00
Sensitivity
0.00 0.25 0.50 0.75 1.00
Ara h2 SPT (AUC=0.908)
Peanut SPT (AUC= 0.887)
a
b
c
Fig. 1 ROC curves for predicting allergy. a Ara h2 SPT and Peanut SPT for predicting allergy, b Ara h2 sIgE and Peanut sIgE for predicting allergy, c FeNO predicting allergy
0.00
0.25
0.50
0.75
1.00
Sensitivit
y
0.00 0.25 0.50 0.75 1.00
FeNO (AUC=0.763)
0.00
0.25
0.50
0.75
1.00
Sensitivity
0.00 0.25 0.50 0.75 1.00
Ara h2 sIgE (AUC=0.857) Peanut sIgE (AUC=0.791) Reference
0.00
0.25
0.50
0.75
1.00
Sensitivity
0.00 0.25 0.50 0.75 1.00
Ara h2 SPT (AUC=0.738)
Peanut SPT (AUC=0.638)
a
b
c
Discussion
This study demonstrates that Ara h2 SPT had similar accuracy to Peanut SPT, FeNO, Peanut sIgE, and Ara h2 sIgE at predicting allergic reaction at food challenge. While the accuracy of Ara h2 SPT was also similar with Peanut SPT, FeNO, Peanut sIgE and Ara h2 sIgE at pre-dicting severity of reaction at food challenge, the AUC for that question is too low to be clinically useful. Larger population numbers would need to be studied to deter-mine appropriate thresholds of Ara h2 SPT for diagnosis of peanut allergy or anaphylaxis.
To further clarify the utility of FeNO at predicting clinical allergy, we re-calculated the area under the ROC curve after excluding patients with a history of asthma but it remained unchanged (0.90). We acknowledge that this analysis is based on small numbers and future studies are required to confirm our observations.
Overall the accuracy of all tests for predicting allergic reaction at food challenge was higher than that previ-ously reported [5, 7]. It is possible that a selection bias contributed to this result because only 48 % of the origi-nal cohort participated in the follow-up visit despite our very best recruitment efforts. Everyone who participated in the follow up study lived within 50 km of the research centre, while the original study included participants from up to 250 km away from the research centre pro-viding some clue as why recruitment may have been less successful. It could be hypothesised that those with per-sisting allergy were more likely to return, as they are likely to have ongoing contact with the clinical team (some of whom were involved in the research) or having persisting allergy may make them more likely to contribute with the desire of improving diagnosis and management of peanut allergy. Thus in clinical practice all tests can be expected to have a lower predictive value than found in this study due to a regression to the mean phenomenon [22].
This study has demonstrated relatively poor reproduc-ibility for both Ara h2 SPT and peanut SPT. This possi-bly relates to different operators performing the SPT in each cohort as would commonly happen in clinical prac-tice. The ASCIA SPT manual highlights the likelihood of operator dependant technique significantly affecting SPT
results [17]. Another possible cause for this poor repro-ducibility may be due to changes in SPT size related to further exposure to peanut, for instance by inclusion into regular diet or by accidental exposures. However, we did not observe such great variability in sIgE. Recent research on the natural history of SPT would suggest that those with persisting clinical allergy would have increas-ing SPT wheal size, while those with resolved clinical allergy would have decreased [23].
Despite the poor reproducibility of both Ara h2 SPT and peanut SPT, this study has demonstrated high levels of reproducibility for FeNO, and for Ara h2 sIgE and pea-nut sIgE serum levels. The excellent reproducibility of the sIgE results is likely contributed to by the lack of poten-tial variation in operator technique affecting the serum sIgE result. A significant limitation remains the small population and that it may not be representative of the true value in the total population.
Two results of interest relate to the participants who appear to have lost tolerance to peanut after a suc-cessful challenge in the original study. While one par-ticipant’s peanut and Ara h2 SPT and sIgE results have decreased compared to the original challenge, the other participant’s peanut and Ara h2 SPT and sIgE results have increased. These seemingly contradictory results do not provide insight into why these two participants have developed symptoms of allergy after successful challenge (and therefore presumed tolerance) in the original study. While it is known that peanut sIgE tends to increase in children with persisting peanut allergy with repeated exposure to peanut [24], there is no published data of the natural history of peanut sIgE or Ara h2 sIgE results in children previously sensitised to peanut whose clinical allergy has resolved.
An obvious weakness of this study is the time that has passed since the food challenge with no repeat conducted on the second visit. Therefore we cannot be certain if each individual is still allergic based upon that original challenge. Those with unsuccessful challenges reported no further accidental exposures since the challenge, and all but two children who had successful challenges were continuing to eat peanut in their diet regularly. This
Table 4 Reproducibility of tests
Variables Ara h2 SPT
(n = 12) Peanut SPT (n = 26) FeNO (n = 19) Ara h2 sIgE (n = 26) Peanut sIgE (n = 26)
Subgroup assessment (median & min, max) 6.5 (0.0, 10.0) 6.3 (0.0, 9.0) 32.5 (4.6, 170.5) 0.35 (0.00, 17.90) 0.90 (0.01, 31.60) Repeat assessment (median & min, max) 3.5 (0.0, 7.5) 6.3 (0.0, 13.0) 26.6 (5.2, 119.2) 0.66 (0.00, 22.10) 0.99 (0.01, 35.60)
P value 0.039 0.170 0.332 0.974 0.259
unfortunately does not help clarify their current allergy status. However, with no further clinical indication for food challenge arising in that period, we did not believe that a repeat food challenge at that time would have been ethically sound in this cohort of children.
Another limitation is the use of open challenges in the original study. While double-blind placebo-controlled food challenges are the gold standard for diagnosing food allergy [6], in clinical practice, open-labelled food chal-lenges are routinely used [2, 7]. In the original study [7], to help minimise the chance of false positive results, out-comes were designated based upon pre-defined objective criteria [5, 25, 26], as participants were recruited sequen-tially from a list of children referred clinically for open-labelled food challenge at a tertiary referral paediatric allergy centre to alleviate the lack of a placebo-controlled challenge [7].
Conclusion
In summary, Ara h2 SPT was no worse in accuracy when compared with current testing for the evaluation of peanut allergy in this population of children. SPT with purified Ara h2 protein and peanut protein in this study demonstrate poor reproducibility and further studies could help determine inter-and intra-operator variability. FeNO demonstrated high accuracy and good reproduc-ibility. Finally, peanut and Ara h2 sIgE collected in this study demonstrate high accuracy and excellent reproduc-ibility over time, reaffirming the utility of these markers in assessing peanut allergy.
Abbreviations
ARIA: allergic rhinitis and its impact on asthma; ASCIA: Australasian Society of Clinical Immunology and Allergy; ATS/ERS: American Thoracic Society and European Respiratory Society; AUC: area under the curve; CA: clinical allergy; CANA: clinical allergy, not anaphylaxis; CR: coefficient of repeatability; FeNO: fraction of exhaled nitric oxide; ICC: intra-class correlation coefficient; NO: nitric oxide; ROC: receiver operator characteristic; SCORAD: SCORing Atopic Dermatitis; sIgE: specific immunoglobulin E; SPT: skin prick test.
Authors’ contributions
EP conducted measurements, recruited patients, and collected data. AC provided laboratory support and expertise. EP, AC, PM and JM analysed data. RB, EP and JM conceived study design. EP, RB and JM wrote manuscript. All authors read and approved the final manuscript.
Author details
1 Experimental & Translational Respiratory Medicine Group, Hunter Medical Research Institute, University of Newcastle, Lookout Road, New Lambton, Newcastle, NSW 2305, Australia. 2 Department of Paediatric Medicine, John Hunter Children’s Hospital, Newcastle, NSW, Australia. 3 Department of Paedi-atric Allergy & Immunology, John Hunter Children’s Hospital, Newcastle, NSW, Australia. 4 School of Medicine and Public Health, University of Newcastle, Additional file
Additional file 1: Table S1. Comparison of original cohort—divided by whether returned for follow-up.
Newcastle, NSW, Australia. 5 Department of Paediatric Immunology & Allergy, Starship Children’s Health, Auckland, New Zealand. 6 Department of Paediatric Respiratory & Sleep Medicine, John Hunter Children’s Hospital, Newcastle, NSW, Australia.
Acknowledgements
We wish to acknowledge Jan Belcher (Allergy CNC) for helping with recruit-ment, Matthew Morten for conducting skin prick tests and the children and their families for participating in the studies.
This work was funded by a Thrasher Children’s Research foundation grant to AC and JM and a Hunter Children’s Research Foundation grant to AC and RB.
Competing interests
RB, AC, MM and JM are inventors on a provisional patent that describes a biomarker for peanut allergy.
Received: 25 October 2015 Accepted: 13 July 2016
References
1. Bock SA, Munoz-Furlong A, Sampson HA. Fatalities due to anaphy-lactic reactions to foods. J Allergy Clin Immunol. 2001;107(1):191–3. doi:10.1067/mai.2001.112031.
2. Osborne NJ, Koplin JJ, Martin PE, Gurrin LC, Lowe AJ, Matheson MC, et al. Prevalence of challenge-proven IgE-mediated food allergy using population-based sampling and predetermined challenge criteria in infants. J Allergy Clin Immunol. 2011;127(3):668–76 e1–2. doi:10.1016/j. jaci.2011.01.039.
3. Hourihane JO. Peanut allergy. Pediatr Clin North Am. 2011;58(2):445–58, xi. doi:10.1016/j.pcl.2011.02.004.
4. Byrne AM, Malka-Rais J, Burks AW, Fleischer DM. How do we know when peanut and tree nut allergy have resolved, and how do we keep it resolved? Clin Exp Allergy. 2010;40(9):1303–11. doi:10.1111/j.1365-2222.2010.03554.x.
5. Dang TD, Tang M, Choo S, Licciardi PV, Koplin JJ, Martin PE, et al. Increas-ing the accuracy of peanut allergy diagnosis by usIncreas-ing Ara h 2. J Allergy Clin Immunol. 2012;129(4):1056–63. doi:10.1016/j.jaci.2012.01.056. 6. Sicherer SH, Sampson HA. Food allergy. J Allergy Clin Immunol.
2010;125(2 Suppl 2):S116–25. doi:10.1016/j.jaci.2009.08.028.
7. Preece K, Bhatia R, Belcher J, Patchett K, McElduff P, Collison A, et al. The fraction of exhaled nitric oxide improves prediction of clinical allergic reaction to peanut challenge in children. Clin Exp Allergy. 2014;44(3):371– 80. doi:10.1111/cea.12258.
8. Chapman JA, Bernstein IL, Lee RE, Oppenheimer J. Food allergy: a prac-tice parameter. Ann Allergy Asthma Immunol. 2005;96:S1–68. 9. Sampson HA. Utility of food-specific IgE concentrations in predicting
symptomatic food allergy. J Allergy Clin Immunol. 2001;107(5):891–6. doi:10.1067/mai.2001.114708.
10. Flinterman AE, van Hoffen E, den Hartog Jager CF, Koppel-man S, PasKoppel-mans SG, Hoekstra MO, et al. Children with peanut allergy recognize predominantly Ara h2 and Ara h6, which remains stable over time. Clin Exp Allergy. 2007;37(8):1221–8. doi:10.1111/j.1365-2222.2007.02764.x.
11. Peeters KA, Koppelman SJ, van Hoffen E, van der Tas CW, den Hartog Jager CF, Penninks AH, et al. Does skin prick test reactivity to purified aller-gens correlate with clinical severity of peanut allergy? Clin Exp Allergy. 2007;37(1):108–15. doi:10.1111/j.1365-2222.2006.02628.x.
12. Patelis A, Gunnbjornsdottir M, Malinovschi A, Matsson P, Onell A, Hog-man M, et al. Population-based study of multiplexed IgE sensitization in relation to asthma, exhaled nitric oxide, and bronchial responsive-ness. J Allergy Clin Immunol. 2012;130(2):397–402 e2. doi:10.1016/j. jaci.2012.03.046.
• We accept pre-submission inquiries
• Our selector tool helps you to find the most relevant journal
• We provide round the clock customer support
• Convenient online submission
• Thorough peer review
• Inclusion in PubMed and all major indexing services
• Maximum visibility for your research
Submit your manuscript at www.biomedcentral.com/submit
Submit your next manuscript to BioMed Central
and we will help you at every step:
14. Powell CVE. A parent completed questionnaire to describe the pat-terns of wheezing and other respiratory symptoms in infants and preschool children. Arch Dis Child. 2002;87(5):376–9. doi:10.1136/ adc.87.5.376.
15. Jauregui I, Davila I, Sastre J, Bartra J, del Cuvillo A, Ferrer M, et al. Valida-tion of ARIA (Allergic Rhinitis and its Impact on Asthma) classificaValida-tion in a pediatric population: the PEDRIAL study. Pediatr Allergy Immunol. 2011;22(4):388–92. doi:10.1111/j.1399-3038.2010.01108.x.
16. Kunz B, Oranje AP, Labreze L, Stalder JF, Ring J, Taieb A. Clinical validation and guidelines for the SCORAD index: consensus report of the European Task Force on Atopic Dermatitis. Dermatology. 1997;195(1):10–9. 17. ASCIA Skin prick test working party. ASCIA skin prick testing for the
diagnosis of allergic disease. Sydney: ASCIA; 2013.
18. American Thoracic Society. European Respiratory Society. ATS/ERS recommendations for standardized procedures for the online and offline measurement of exhaled lower respiratory nitric oxide and nasal nitric oxide, 2005. Am J Respir Crit Care Med. 2005;171(8):912–30. doi:10.1164/ rccm.200406-710ST.
19. ASCIA. ASCIA food challenge protocol peanut 2014. Sydney: ASCIA; 2014. 20. ASCIA. ASCIA HP clinical update anaphylaxis 2014. Sydney: ASCIA; 2014.
21. Osborne NJ, Koplin JJ, Martin PE, Gurrin LC, Thiele L, Tang ML, et al. The HealthNuts population-based study of paediatric food allergy: validity, safety and acceptability. Clin Exp Allergy. 2010;40(10):1516–22. doi:10.1111/j.1365-2222.2010.03562.x.
22. Barnett AG, van der Pols JC, Dobson AJ. Regression to the mean: what it is and how to deal with it. Int J Epidemiol. 2005;34(1):215–20. doi:10.1093/ ije/dyh299.
23. Peters RL, Allen KJ, Dharmage SC, Koplin JJ, Dang T, Tilbrook KP, et al. Natural history of peanut allergy and predictors of resolution in the first 4 years of life: A population-based assessment. J Allergy Clin Immunol. 2015;135(5):1257–66. doi:10.1016/j.jaci.2015.01.002.
24. Neuman-Sunshine DL, Eckman JA, Keet CA, Matsui EC, Peng RD, Lenehan PJ, et al. The natural history of persistent peanut allergy. Ann Allergy Asthma Immunol. 2012;108(5):326–331 e3. doi:10.1016/j.anai.2011.11.010. 25. Koplin JJ, Tang ML, Martin PE, Osborne NJ, Lowe AJ, Ponsonby AL, et al.
Predetermined challenge eligibility and cessation criteria for oral food challenges in the HealthNuts population-based study of infants. J Allergy Clin Immunol. 2012;129(4):1145–7. doi:10.1016/j.jaci.2011.09.044. 26. ASCIA. Health professional information paper: anaphylaxis January 2013.