Issues
ISSN: 2146-4138
available at http: www.econjournals.com
International Journal of Economics and Financial Issues, 2020, 10(2), 53-60.
Blockchain Technology and Systemic Risk
Aymen Mselmi*
University of Jeddah, College of Business at Alkamil, Department of Finance, Saudi Arabia. *Email: [email protected]
Received: 06 November 2019 Accepted: 28 January 2020 DOI: https://doi.org/10.32479/ijefi.9069
ABSTRACT
This paper examine the effect of financial institutions management information system migration to blockchain technology on systemic risk. Our study examines a sample of 40 financial institutions around the world. The aim is to identify to what extent the migration of financial company management information system to blockchain system contribute to minimize systemic risk measures through regressions on panel data. We have reached the empirical evidence which indicates that the change we mentioned earlier affect immediately the systemic risk level. Companies that have adopted the blockchain technology recorded a significant reduction in systemic risk level. In addition, financial institutions that have adopted this latter system recorded a significant decrease in long-run marginal expected shortfall and systemic risk index.
Keywords: Blockchain, Systemic Risk, Financial Institutions JEL Classifications: G21, G32
1. INTRODUCTION
In 2008, the financial world saw the emergence of a very important new technology called (Blockchain). With “Satoshi Nakamoto,” founder of the most famous cryptocurrency “Bitcoin,” that is accelerate innovation and technical progress in financial security such as Blockchain process. Indeed, it is about a complex mathematical algorithm which makes it possible to validate the financial transactions of the type peer-to-peer and through the (DLT)1 to ensure the reliability and confidentiality of the
transaction between stakeholders.
The blockchain system appeared for some time, except that he rode to the media in recent years and thanks to the ICO excessive operations at the Chicago exchange in the one hand and the dramatic increase of the cryptocurrencies stock prices during 2017 in the other hand. In 2017, the market capitalization of all cryptocurrencies reached $75 Billion, after a year it reached the threshold of $280 Billion, see an increase of 273%.
1 Distibuted ledger technology
The security of financial market infrastructure is undoubtedly a very important topic that needs to be further developed in view of the technical progress of trading platforms and banking systems. The malfunctioning of a system functioning as a financial market infrastructure could disrupt the system and consequently affect investor confidence. According to the Davis et al (2016), “The risk that failures of information systems or internal processes, human errors, management failures or disruptions resulting from external events may result in a reduction, deterioration or failure of services provided by (financial market infrastructure)… including physical threats.”
The problem that arises by the big financial conglomerates is, will they have to adopt the public, consortia or private blockchains? Several experts in this field believe that the blockchains infrastructure is a secure port for data retention systems and financial registers, Kaminska (2016). This is based on the hypothesis of the adoption of public blockchains. Except that, the problem is that public blockchains rely on open-source codes In other words, there is no governance structure. According to the Davis et al (2016), if we migrate the infrastructures of
the financial markets to the platform of public blockchains as they exist today, we would face a new form of operational risk. Contrariwise, private blockchains are intended for companies seeking to maintain total control over their registers on the one hand, and to maintain a totally secure mode of governance on the other hand. In addition, these implementations are put in place to keep communication between secure partners whose participants decide to jointly manage a business process.
Indeed, many companies in the financial sector have benefited from this technology and have proceeded through cross-border financial transactions. Eha (2016) postulates that the MUFG Financial Group (one of the largest banking groups in Japan) announced in October 2016 that it has worked with Coin-base (bitcoin exchange) to make cross-border payments via Bitcoin. Al Rajhi Bank proceeded through cross-border interbank transfers thanks to the blockchains system and between two sectors belonging to the same group. This allowed them to save transaction costs on the one hand and to minimize the time elapsed during these types of financial transactions on the other hand. Therefore, it is true that this technology is profitable for financial institutions from the point of view of speed and cost minimization, but it has revealed other types of operational and systemic risk.
Moreover, new forms of operational risk have emerged with the development of blockchain technology that are related to “smart-contracts” when minimizing and automating interactions makes the discovery of tortious actions more harder, Kiran and Stannett (2014), Peters et al. (2014) and Walch (2015). In addition, there are other types of operational risks related to this technology such as the risk of hacking and indirect proxy mining, which has led to the proliferation of crypto-jacking viruses. For exemple, in recent years there has been hacking of the cryptocurrency exchange of South Korea (Bithumb). A second event occurred confirming the system’s vulnerability of Blockchains. In December 2018, following the death of the CEO of a Canadian crypto-currency exchange portal, approximately $145 million is frozen in the “off-line” cold wallet of the owner of the “Gerry Cotten Fund.”
It is true that the blockchain system with its three main applications (DLT, cryptocurrency and smart-contract) will have significant repercussions in the banking system. Some authors argue that the latter system will upset the global financial order and create new forms of systemic risk. Others believe that this system has potential for financial security since it is considered to be secure and more transparent compared to traditional banking tools. Consequently, there is the possibility of minimizing the famous operational risk following the minimization of risk of fraud or intentional mistakes.
In addition, technical progress in blockchain infrastructure will upset corporate governance codes. Indeed, the governance of public blockchains technology codes is also decentralized and informal. Blockchain codes are under development, which requires upgrading and adding new features.
Furthermore, proponents of this technology postulate that the importance of blockhain lies in the fact that it can solve the problem
of Byzantine Generals. It is a “mathematical metaphor dealing with the questioning of the reliability of the transmissions and the integrity of the interlocutors” Leloup (2017). The problem lies in how many computers have connected at the same time and can reach a consensus without relying on a central authority, Wright and De Filippi (2015).
In addition, the blockchain solved the double payment problems that occur in any electronic payment system using the time stamp, Antonopoulos (2014).
Recent research on blockchain technology has proliferated and treated many facets of this new invention. For example, some authors have studied the dynamic interaction between different types of crypto-currencies such as Eyal and Sirer (2014) and Gandel and Halaburda (2016). Other authors have studied smart contracts, Cong and He (2019) and FINRA (2017).
Indeed, this technology appeared just after the crisis of confidence that followed the global financial crisis 2007-2008. According to Nakamoto (2008), the goal is to establish a more confident, secure, transparent and decentralized transaction system. This decentralized system and deemed more secure, Chouli et al. (2017).
Thus, the importance of such a system arises because operational risk does not directly affect the customers of the banks but influences the confidence that they may have in it. The blockchain comes then to fill this gap of confidence between the customers of the banks and the banks themselves through a more secure peer-to-peer algorithm and avoiding financial transactions via the intermediation of financial institutions. Swan (2015) considers financial transactions via the blockchain system based on the principle of disintermediation represent a cheaper alternative for the various stakeholders.
It is in this framework of analysis is enrolled our study. Indeed, we will exploit and try to validate the hypothesis according to which the application of the Blockchain system reduces the systemic risk incurred by financial institutions.
Therefore, to what extent does the application of the Blockchains system reduce the systemic risk incurred by financial institutions?
Given the importance of this technology, studies have proliferated and led to new research paths. In this regard, regarding the relationship between Blockchain technology and transaction costs, Kroll et al. (2013) have studied the impact of immigration to Blockchains platforms on transaction costs and found a weak effect. As for risk, Easley et al. (2019) perceive a weak relationship between the adoption of blockchain technology by banks on the one hand and systemic risk and probability of bankruptcy on the other hand. In addition, they state that Nakamoto in (2008) found that in the absence of transaction costs, blockchain technology has no added value, with the exception of minimizing the time elapsed by a typical financial transaction.
2. METHODOLOGY
risk. To do this, we will proceed by linear regressions. In fact, we will progress by panel regressions to analyze the impact of implementation of blockchain system by financial institutions on the systemic risk. Where the dependent variable is a several of systemic risk measures and the independent variable is a binary variable witch tell us about the integration or not to this platform (blockchain) on the hand and the size of bank’s on the other hand.
Indeed, the preliminary sample of this study concerns 142 financial companies around the world. To identify the number of financial companies that have joined the blockchain system, we chose to proceed with the Forbes report (2018) which lists all the companies that have adhered to the blockchain since the year (2015).
Indeed, the study data are collected from of two databases, “ORBIS” for financial data and “V-Lab Volatility2” for systemic
risk measures. Finally, harmonization of databases has resulted in a final sample of 40 companies only. This is mainly due to the lack of data on systemic risk measures.
3. VARIABLES
3.1. Dependent Variables
• Long-run marginal expected shortfall (LRMES)
“The expected fractional loss of the firm equity in a crisis when the aggregate market declines significantly in a 6-month period
(LRMES).” This measure is developed by Acharya et al. (2012) and Brownlees and Engle (2011).
LRMESi,t:t+T= 1- exp log 1- d i,t (1)
With:
d= The 6-month crisis threshold for the market index decline and its default value is 40%.
Beta=The firm’s beta coefficient.
• Systemic risk index (SRISK)
According to Acharya et al. (2010), “SRISK is the expected
capital shortfall of this firm if there is another crisis. The NYU Stern Systemic Risk Ranking, SRISK%, is the firm’s percentage of financial sector capital shortfall.”
Capital shortfall (SRISK) is computed as:
SRISK = k.D - 1-k 1-LRMESi,t i,t
i,tEi,t (2)Where:
K=The capital requirement
LRMES=Long run marginal expected shortfall E=t he current market capitalization of this firm.
However, in order to refine and standardize our study, we will proceed by measuring systemic risk that describes the firm’s percentage of financial sector capital shortfall by country.
2 www.vlab.stern.nyu.edu
According to Acharya et al (2012), the contribution to systemic risk for each financial institution is defined as follows:
SRISK% = SRISK SRISK
j,t
j,t j,t j J
(3)• Beta
The beta coefficient is the ratio between the covariance of the return of the security (i) and stock market return (m) and the variance of the market index return (m). Mathematically, the (Beta) is defined as follows:
i,t= cov R ,R
i,t m,t var Rm,t (4)= i,t i,t
m,t
• Volatility (VOL)
This is the volatility of stock prices of different financial institutions.
We will proceed with the model (GARCH) used by Engle (2002) to define the level of volatility of different financial institutions.
t2
i t-1 2
i=1 q
j t- j 2
j=1 p
= +
+ (4)3.2. Independent Variables
• Blockchain (BLKCH)
Since the objective of our work lies in the study of the effect of the migration of financial institutions to blockchain system on different risk measures already defined, we have chosen as independent variable a binary variable (BLKCH).
Indeed, (BLKCH) is defined as a binary variable that describes the migration or not to the blockchain system of financial companies. It takes the value (1) if the firm is converted to the blockchain system, otherwise (0).
BLKCH
1 if the firm has immigrated to the blockchain systemm
otherwise 0
(5)
• Size (lnta)
This is a control variable that tells us about the size of the firm in terms of total assets. We will apply the natural logarithm to standardize this variable.
4. DESCRIPTIVE STATISTICS
The two Tables 1 and 2 below represent descriptive statistics for all financial institutions.
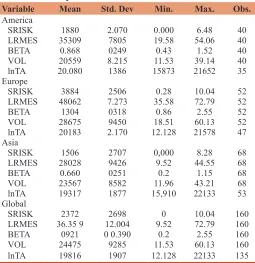
financial institutions. For the second measure (LRMES), the same remarks can be made. Indeed, European financial institutions are at the top of the ranking with an average of (48.06) followed by US financial institutions (35.30) and third place for Asian financial companies with an average of (28.02). Regarding the third independent variable (beta), we can note the same findings. European financial companies have a higher risk sensitivity coefficient with an average of (1.3) compared to (0.86) for US financial institutions and (0.66) for Asian financial institutions. In addition, we note the same findings and the same remarks in terms of statistics for the variable (VOL).
As a result, the high-risk exposure of European financial institutions is explained by several factors. Firstly, the fallout from the subprime crisis in the European region was more significant than the other regions. In addition, European financial institutions are characterized by a high concentration of capital. Moreover, the total assets of the four major French banks is greater than the GDP of France, hence the bankruptcy of a bank can damage the entire banking sector which asserts the “too big to fail” paradigm. Moreover, the European financial institutions record the highest average in terms of total assets (20.18) which confirms the “TBTF”3 paradigm. Even more, Greece’s sovereign debt crisis
has disrupted the European Union’s economy and made it more susceptible to systemic crises.
3 TBTF : Too Big To Fail
For the variable (BLKCH), descriptive statistics above show that most financial companies have joined the blockchain platform during the year (2018).
Thereafter, we will analyze the correlation coefficients of the different independent and control variables as well as the multicollinearity coefficients test “Vif.”
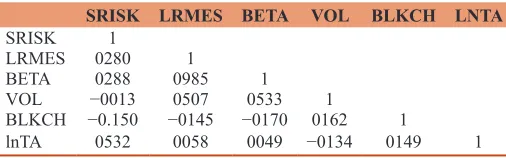
Following Table 3 above, we note a strong correlation between the variable (LRMES) and (BETA). This presents no problem since these are two independent variables and each will be treated in a separate model.
With regard to the multicollinearity analysis, the coefficient (Vif) between the two variables (BLKCH) and (LNTA) is below the critical threshold which leads us to confirm the absence of multicollinearity problem (Table 4).
5. EMPIRICAL STUDY
5.1. Econometric Models
To examine the effect of the migration of financial institutions from traditional computer models (based on algorithms and databases for capital movements and contract registrations) to the blockchain decentralized system on systemic risk incurred by companies, we will proceed by estimates panel data. However, in order to avoid the problems related to autocorrelation of residuals and heteroscedasticity across panels, we will apply the “Panel-corrected standard errors (PCSE)” model.
In this respect, we will try to estimate the following model (PCSE).
i t, 0 1(BLKCHi t,) 2ln(TAi t,) i t, (6)
αi,t: Represents the measures risk (SRISK, LRMES, BETA or VOL). BLKCH: Binary variable describes the migration or not of the
financial institution to the Blockchain system. lnTA: The natural logarithm of the size of society.
5.2. Preliminary Econometric Tests
Before making the estimates, we will conduct preliminary econometric tests to identify the characteristics of each model. Indeed, we tested the presence or absence of serial autocorrelation through the test of (Wooldridge, 2002). Then, we checked with (Breusch-Pagan/Cook-Wiesberg) for testing the existence or not of problems related to heteroscedasticity. The results of the preliminary tests are summarized in the following Table 5.
The results of the autocorrelation test between the residues leads us to reject the null hypothesis from which there is no problem related
Table 1: Descriptive statistics for all financial institutions
Variable Mean Std. Dev Min. Max. Obs.
America
SRISK 1880 2.070 0.000 6.48 40
LRMES 35309 7805 19.58 54.06 40
BETA 0.868 0249 0.43 1.52 40
VOL 20559 8.215 11.53 39.14 40
lnTA 20.080 1386 15873 21652 35
Europe
SRISK 3884 2506 0.28 10.04 52
LRMES 48062 7.273 35.58 72.79 52
BETA 1304 0318 0.86 2.55 52
VOL 28675 9450 18.51 60.13 52
lnTA 20183 2.170 12.128 21578 47
Asia
SRISK 1506 2707 0,000 8.28 68
LRMES 28028 9426 9.52 44.55 68
BETA 0.660 0251 0.2 1.15 68
VOL 23567 8582 11.96 43.21 68
lnTA 19317 1877 15,910 22133 53
Global
SRISK 2372 2698 0 10.04 160
LRMES 36.35 9 12.004 9.52 72.79 160
BETA 0921 0 0.390 0.2 2.55 160
VOL 24475 9285 11.53 60.13 160
lnTA 19816 1907 12.128 22133 135
Table 2: : Descriptive statistics for the binary variable (BLKCH)
BLKCH Freq. Percent Cum Freq. Percent Cum Freq. Percent Cum Freq. Percent Cum
Code 2015 2016 2017 2018
0 40 100 100 34 85 85 12 30 30 34 85 85
1 0 0 100 6 15 100 28 70 100 6 15 100
to serial autocorrelation since the probability associated with the Chi-square test is greater than the critical threshold (5%). In addition, for the heteroscedasticity test, the probability associated with the test (Breush-Pagan/CW) is greater than the critical threshold of (5%). Consequently, we accept the null hypothesis of homoscedasticity. Therefore, we need to configure the model parameters (PSCE) concerning the partial autocorrelation and heteroskedasticity in order to proceed to different estimates.
5.3. Results
We proceeded by sixteen regressions on panel data, i.e. four regressions for each risk measure.These include three estimates by country group and an overall estimate for each risk measure. The objective is to study each time the effect of the migration of financial institutions to the model based on Blockchain technology on a risk measure.
5.3.1. The effect of migration to “Blockchain” technology on
systemic risk in the sense of (SRISK)
The regressions below Table 6 analyze the effect of the migration of financial institutions to the “Blockchain” platform on the systemic risk measure (SRISK).
The estimation of the first model displays low linear adjustment coefficients (R²) for the region of America and Europe but it is acceptable for the region of Asia with (0.708). For the overall estimate, the coefficient is also low at the level (0.326). Indeed, it is legitimate that the linear adjustment coefficients are weak since we are working on a binary independent variable (BLKCH).
The model estimate for the first region (America) displays a negative and statistically significant coefficient at the (10%) threshold for the variable (BLKCH). This result confirms that financial institutions that have not yet adapted the “Blockchain” technology in their management are still more exposed to the risk of bankruptcy within the meaning of (SRISK). In other words, they contribute significantly to the overall expected financial loss of the financial sector. Mselmi and Regaieg (2018) show
that when the governance models of financial institutions are unreliable and do not meet the requirements of economic and financial reality, this can increase the probability of occurrence of the expected loss in financial value of the companies. In addition, when corporate executives thwarted the new corporate governance order geared towards governance and management based on new blockchain technology, this adversely affects economic and financial performance and subsequently amplifies risk. In the same framework of analysis, the regression for the region (Asia) brings out the same relation. Hence institutions that do not adhere to Blockchain technology are characterized by a higher systemic risk. With regard to the regression for the second region (Europe), the results show the lack of significant relationship between the variable (BLKCH) and (SRISK). Finally, and following the results of the global regression, we confirm the existence of an inverse relationship between the migration to blockchain technology and the contribution to systemic risk (SRISK).
However, we confirm the paradigm (TBTF) for the measurement of (SRISK). In other words, the size of financial institutions in terms of total assets affects positively the level of systemic risk incurred by these companies since the variable (lnTA) is positive and statistically significant at the (1%) threshold for all models.
5.3.2. The effect of migration to “Blockchain” technology on
systemic risk (LRMES)
The regressions below Table 7 analyze the effect of the migration of financial institutions to the platform “Blockchain” on the LRMES.
The estimation of the second model shows low linear adjustment coefficients (R²) for all the regions as well as the overall regression. This is due to the existing character of the explanatory variable (BLKCH). Indeed, it is a binary variable which weakens the degree of linear adjustment between the set of variables of the model.
The results of the second estimate of the independent variable (LRMES) shows a negative and statistically significant coefficient at the threshold of (1%) for the variable (BLKCH) with the exception of the estimate for the Asian region. In addition, US and European financial institutions that have not yet migrated to “Blockchain” technology have a higher level of systemic risk than other companies. By analogy, financial institutions that have adhered to this new technology tend to minimize their level of exposure to systemic risk (LRMES). Indeed, Kaminska (2016) shows that the “Blokchain” infrastructure constitutes a secure system for the transaction and preservation of financial data, which consequently leads to the reduction of operational and systemic risk. In addition, we can confirm the hypothesis of the researchers in the field where the adaptation of this technology contributes to the improvement of the performance on the one hand and the minimization of the risk incurred by financial institutions on the other hand.
Table 3: Pairwise correlations matrix
SRISK LRMES BETA VOL BLKCH LNTA
SRISK 1
LRMES 0280 1
BETA 0288 0985 1
VOL −0013 0507 0533 1
BLKCH −0.150 −0145 −0170 0162 1
lnTA 0532 0058 0049 −0134 0149 1
Table 4: Multicollinearity coefficient
Variable VIF 1/VIF
BLKCH 1.02 0.977677
LNTA 1.02 0.977677
Table 5: Autocorrelation and heteroskedasticity test
Tests Results
Specifications Statistics Probability
Autocorrelation Woordridge Fisher 1.542 0.269
Finally, we confirm the presence of the paradigm (TBTF) for the entire sample when the size of financial institutions in terms of total assets (lnTA) impact positively the (LRMES).
5.3.3. The effect of migration to “Blockchain” technology on the sensitivity coefficient (BETA)
The regressions below Table 8 focus on the impact study of the migration of financial institutions to the “Blockchain” platform on the sensitivity coefficient (BETA).
The regressions on the dependent variable (BETA) show a very low linear adjustment coefficients (R²) for all regions “not exceeding (0.179).” These results are explained by the presence of a binary variable (BLKCH) which makes the correlation weak with the quantitative dependent variable.
Moreover, and with regard to the results of the first estimate in the American context, we can see a strong inverse relationship between the variable (BLKCH) and the variable (BETA). Indeed, the coefficient associated with the variable (BLKCH) is negative and statistically significant at the threshold of (1%). This implies that the financial institutions that have not migrated to “Blockchain” technology still maintain a high level of sensitivity (BETA). Stock prices of financial institutions (except Asian companies) that have not adhered quickly to the “Blockchain” technology are characterized by a high sensitivity coefficient. Moreover, the financial companies that have adhered “Blockchain” technology have confirmed the hypothesis that the complexity of the algorithms “Blockchain” makes embezzlement and hacking impossible in the one hand, and the transfer of capital more guaranteed and faster on the other hand. With regard to the control variable (lnTA), the results of the global regression that covers all the regions coincides with the theory. The coefficient associated with this last variable is positive and statistically significant at the threshold of (1%). In addition, the higher the total assets of financial institutions, the higher the sensitivity coefficient (BETA). Big companies in terms of total assets manage large portfolios which generates higher risk-taking.
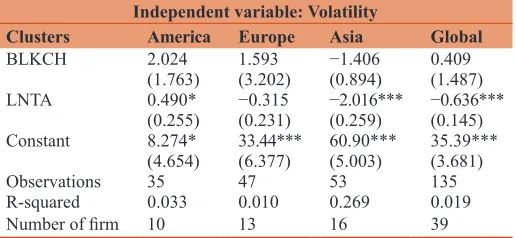
5.3.4. The effect of migration to “Blockchain” technology on
the stock price volatility (VOL)
The regressions below Table 9 focus on the impact study of the migration of financial institutions to the “Blockchain” platform on stock price volatility (VOL).
The estimates shown in the Table 9 above show extremely low linear adjustment coefficients (R²). The linear adjustment coefficient for the global regression is in the order of (0.019). These results coincide with the linear adjustment coefficients of the previous regressions on (SRISK, LRMES and BETA). This is due to the presence of a binary variable in our model (BLKCH).
The coefficient associated with the independent variable (BLKCH) is not significant for all estimates. In addition, the migration or not of financial institutions to “Blockchain” technology has no effect on stock prices volatility. Indeed, the results confirm that the adaptation of the “Blokchain” technology does not contribute to minimizing or maximizing the stock prices volatility. Moreover, the level of stock prices volatility reflects sometimes the importance of risk incurred by financial institutions.
Regarding the relationship between the size of financial companies in terms of total assets and the stock prices volatility,
Table 6: Results of estimates on the dependent variable (SRISK)
Independent variable: SRISK
Clusters America Europe Asia Global
BLKCH −1.207* −0.553 −1.282*** −1.179***
(0.728) (0.816) (0.490) (0.406) LNTA 0.374*** 0.443*** 1.283*** 0.816***
(0.056) (0.083) (0.133) (0.104) Constant −5.238*** −4.781*** −22.50*** −13.18***
(0.878) (1.502) (2.573) (2.043)
Observations 35 47 53 135
R-squared 0.123 0.134 0.708 0.326
Number of firm 10 13 16 39
Standard errors in parentheses. ***P<0.01, **P<0.05, *P<0.1
Table 7: Results of estimates on the dependent variable (LRMES)
Independent variable: LRMES
Clusters America Europe Asia Global
BLKCH −2.496*** −5.986*** −0.294 −3.394*** (0.923) (2048) (1.922) (0.824) LNTA 2.304*** −0590*** −0.992*** 0.517***
(0.304) (0.091) (0.150) (0.080) Constant −10.85* 62.92*** 47.32*** 27.98***
(6.112) (2.395) (2.587) (1.252)
Observations 35 47 53 135
R-squared 0.165 0.224 0.033 0.020
Number of firm 10 13 16 39
Standard errors in parentheses. ***P<0.01, **P<0.05, *P<0.1
Table 8: Results of estimates on the dependent variable (BETA)
Independent variable: BETA
Clusters America Europe Asia Global
BLKCH −0.081*** −0239*** −0.009 −0128***
(0031) (0.089) (0.050) (0.025) LNTA 0.069*** −0.024*** −0.023*** 0.015***
(0.010) (0.004) (0.004) (0.002) Constant −0368* 1897*** 1116*** 0684***
(0193) (0110) (0.074) (0.040)
Observations 35 47 53 135
R-squared 0.121 0.179 0.025 0.025
Number of firm 10 13 16 39
Standard errors in parentheses. ***P<0.01, **P<0.05, *P<0.1
Table 9: Results of estimates on the dependent variable (VOL)
Independent variable: Volatility
Clusters America Europe Asia Global
BLKCH 2.024 1.593 −1.406 0.409
(1.763) (3.202) (0.894) (1.487) LNTA 0.490* −0.315 −2.016*** −0.636***
(0.255) (0.231) (0.259) (0.145) Constant 8.274* 33.44*** 60.90*** 35.39***
(4.654) (6.377) (5.003) (3.681)
Observations 35 47 53 135
R-squared 0.033 0.010 0.269 0.019
Number of firm 10 13 16 39
the results show a positive and statistically significant “student” coefficient at the threshold of (10%) for the American region. In other words, companies with large total assets are characterized by high stock prices volatility. Contrariwise, we confirm the absence of a significant relationship between the total assets of European financial institutions and the stock price volatility since the student coefficient is not significant. In addition, we validate the presence of a negative impact-relationship between the size of Asian companies (lnTA) and the stock price volatility (VOL). Finally, the overall estimate shows a negative relationship between the total assets and the stock prices fluctuation. Indeed, the “student” coefficient associated with the variable (lnTA) is negative and statistically significant at the threshold of (1%). In other words, small and medium-sized enterprises in terms of total assets are characterized by high stock price volatility. In a dynamic financial market, small and medium-sized businesses face difficulties of integration into the market in the face of gigantic firms on the one hand and are exposed to a strong competition on the other. As a result, they are financially sensitive to large firms which results a stock prices volatility.
6. CONCLUSION
Since the birth of blockchain technology, the big financial institutions were the biggest opponents of this proven experiment. The adaptation of financial institutions with this new global financial order has been very difficult. As time passed, with the development of blockchain technology, financial institutions began to be convinced of the need for this change. From the year 2015, the financial sector around the world started migrating their management systems to this new technology. It turned out then the reliability of this change. In fact, blockchain technology has established itself in the world of finance and has succeeded in minimizing operational risk on the one hand and systemic risk on the other hand. Our research has confirmed this last observation. We have succeeded in confirming our hypotheses regarding the existence of a significant relationship between the decision of the financial institutions to adopt blockchain technology and the various adapted risk measures. Indeed, the results found confirm that financial institutions that have adapted this new technology were able to minimize the need for recapitalization of a financial company conditional on a stock market crisis, Frank et al. (2014).
In this regard, our findings present a recommendation for financial institutions to migrate management information systems to the blockchain platform in order to minimize uncontrollable risk.
Finally, we cannot conclude without mentioning the limits of this study. Indeed, blockchain technology has been criticized by several researchers such as Easley et al. (2019). According to these authors, increase in transaction costs will increase the number of miners, which leads later to the complexity of the validation of the registers and ultimately this process ends up by the increase in the costs borne by the miners. And therefore, it can negatively affect the reliability of the blockchain platform.
REFERENCES
Acharya, V.V., Pederson, L.H., Phillipon, T., Richardson, M.P., (2010), Measuring systemic risk. The Review of Financial Studies, 30(1), 3-47.
Acharya, V.V., Sascha, S. (2012), Analyzing Systemic Risk of the European Banking Sector. In: Fouque, J.P., Langsam, J.,editors. Handbook on Systemic Risk. Cambridge: Cambridge University Press.
Antonopoulos, A.M. (2014), Mastering Bitcoin: Unlocking Digital Cryptocurrencies. O’Reilly Media, Inc.
Brownlees, T.C., Engle, R. (2011), Volatility, Correlation and Tails for Systemic Risk Measurement. Working Paper, New York University. Chouli, B., Goujon, F., Leporcher, Y.M. (2017), Les Blockchains: De
la Théorie à la Pratique, de L’idée à L’implémentation. Herblain: Joêlle Musset.
Cong, L.W., He, Z. (2019), Blockchain disruption and smart contracts. The Review of Financial Studies, 32(5), 1754–1797.
Davis, M., Kathy, W., Brendan, M. (2016), Distributed Ledger Technology in Payments, Clearing, and Settlement. Finance and Economics Discussion Series. Federal Reserve Board.
Easley, D., O’Hara, M., Basu, S. (2019), From mining to markets: The evolution of bitcoin transaction fees. Journal of Financial Economics, 134(1), 91-109.
Eha, B.P. (2016), MUFG Aims to use Bitcoin to Improve Cross-border Payments. American Banker.
Engle, R. (2002), Dynamic conditional correlation: A simple class of multivariate GARCH models. Journal of Business and Economics, 20, 339-350.
Eyal, I., Sirer, E.G. (2014), Majority is not enough: Bitcoin mining is vulnerable. In: Christin, N., Safavi-Naini, R., editors. Financial Cryptography and Data Security. Germany: Springer Heidelberg. p436-454.
Forbes Report. (2018), Article written by Michael Del Castillo, Forbes Staff. Big Blockchain: The 50 Largest Public Companies Exploring Blockchain. Available from: https://www.forbes.com/sites/ michaeldelcastillo/2018.
Finra. (2017), Distributed Ledger Technology: Implications of Blockchain for the Securities Industry. Washington, DC: Financial Industry Regulations Authorities.
Frank, B., Nocholas, D., Henri, P. (2014), Critiques Fondamentales du SRISK. Revue D’économie Financière. N. 116. p333-352. Gandel, N., Halaburda, H. (2016), Can we predict the winner in a market
with network effects? Competition in cryptocurrency market. Games, 7(3), 1-21.
Kaminska, I. (2016), Blockchain and the Holy Real-time Settlement Grail. Financial Times. Available from: https://www.ftalphaville. ft.com/2016/02/26/2154510/blockchain-and-the-holy-real-time-settlement-grail/. [Last accessed on 2016 Dec 01].
Kiran, M., Stannett, M. (2014), Bitcoin Risk Analysis. NEMODE. Available from: http://www.nemode.ac.uk/wp-content/uploads/2015/02/2015-Bit-Coin-risk-analysis.pdf. [Last accessed on 2016 Dec 01]. Kroll, J.A., Davey, I., Felton, E. (2013), The economics of bitcoin mining,
or bitcoin in the presence of adversaries. In: Friedman, A. (Chair), The 12th Workshop on the Economy of Information, Security,
Georgetown University, Washington, DC, June 11-12 Proceedings of WEIS. p1-21.
Leloup, L. (2017), Blockchain: La Révolution de la Confiance. Paris: Editions Eyrolles.
Mselmi, A., Regaieg, B. (2018), Corporate governance and systemic risk of Tunisian banks. International Journal of Corporate Governance, 9(1), 23-51.
banking sector risk exposures and vulnerabilities from virtual currencies: An operational risk perspective. Journal of Banking Regulation, 17(4), 239-272.
Swan, M. (2015), Blockchain: Blueprint for a New Economy. USA: O’Reilly Media Edition, Inc. p29.
Satoshi, N. (2009), Bitcoin: A Peer-to-Peer Electronic Cash System. Available from: https://www.bitcoin.org/bitcoin.pdf.
Walch, A. (2015), Open-Source Operational Risk: Should Public
Blockchains Serve as Financial Market Infrastructures? Handbook of Digital Banking and Internet Finance. Vol. 2. Amsterdam: Elsevier .
Wooldridge, J.M. (2002), Econometric Analysis of Cross Section and Panel Data. Cambridge: The MIT Press.