Miguel-Hurtado, O., Guest, R. M., Stevenage, S. V., & Neil, G. J. (2014). The
relationship between handwritten signature production and personality traits.
Paper presented at the Biometrics (IJCB), 2014 IEEE International Joint
Conference on.
Final version available at:
http://ieeexplore.ieee.org/xpl/articleDetails.jsp?reload=true&arnumber=6996245
DOI:
10.1109/BTAS.2014.6996245
2014 IEEE. Personal use of this material is permitted. Permission from IEEE must be
obtained for all other uses, in any current or future media, including
reprinting/republishing this material for advertising or promotional purposes, creating
new collective works, for resale or redistribution to servers or lists, or reuse of any
Abstract
The capacity to link various aspects of a person’s identity is of value in the search for reliable means of authentication and identification. With the increase in digital living, this has taken on a new perspective through the need to link aspects of identity in the physical world to those in the digital world. The focus in this work is in the value of the signature as a token of identity in its own right but also as a method to reveal information about the person signing. Whilst existing methods for the analysis of an individual’s personality through their handwriting (graphology) have been discredited, we wish to revisit the issue with respect to signatures. Critically, we use accepted and modern static and dynamic features from the signature as potential indicators of personality. Our results suggest some clear links between signature production and relevant cues about the signer, especially when we incorporate dynamic elements of signature production. As such these results suggest there is renewed value in using a signature to reveal information about the signer
.
1.
Introduction
The need to assess links between various attributes of an individual’s identity is gaining increasing prominence as we inhabit multiple domains. Every individual has a set of characteristics related to their physical identity including biometric information (related to the physical person such as gait pattern or fingerprints) and biographic
information (related to facts about the physical person such as age or name). In addition, individuals have a set of characteristics related to their online or digital identity called ‘cybermetrics’ (related to the digital person such as a social media profile). Finally, individuals have a psychological identity related to those beliefs, values or traits that direct and determine behaviour (personality). Thus, individual characteristics of identity can be grouped into the four categories of biometric, biographic, cybermetric and personality – together making a “SuperIdentity” [1]. Understanding how individual characteristics are related will in turn enable a deeper understanding of identity both in the physical and the
digital domains. Such an understanding may be used in many scenarios such as marketing and intelligence.
The ‘SuperIdentity’ (SID) project [2] is currently addressing these issues by forming an holistic overview of identity. By establishing links between one characteristic of identity (for example a biometric feature) and another characteristic (such as personality or cyber-behaviour), it is possible to construct a “relational model” of identity – the SID model. In the SID model, the strength of links between various characteristics can be used to triangulate identity cues and, furthermore, to predict aspects of identity where information may be absent. This new model broadens the current use of biometrics as a secured authentication means, through the possibility of using biometric features to predict other valuable information. Whilst it is possible to assess the relationship between characteristics within each of the categories, the novelty and power of the model exists in finding links that span
categories (Figure 1). There is an intelligence-driven need to discover links between biometric and cybermetric characteristics (and vice-versa) given the rising duality of an individual’s on-line and real-world behaviours [1]. Direct bio-to-cybermetric links are, however, difficult to identify, and a working hypothesis is that biographic or personality characteristics may act independently as intermediary stages
.
Figure 1 The SuperIdentity model
Biometric implementations use many different traits for assessing individuality for purposes of identification or verification [3]. Biometrics traits can be broadly categorised as either physiological (e.g. face, iris) or behavioural (e.g. signature, keystroke) with the latter often relying on a temporal assessment of behavioural characteristics (e.g. velocity of writing) [3]. Biometrics systems based on signature are generally classified into static and dynamic. Static systems extract features from the final signature image, whilst dynamic systems add
The relationship between handwritten signature production and personality
traits
Oscar Miguel-Hurtado, Richard Guest
School of Engineering and Digital Arts
University of Kent
Canterbury, Kent, UK
{r.m.guest,o.miguel-hurtado-98}@kent.ac.uk
Sarah V. Stevenage, Greg J. Neil
Psychology
University of Southampton
Southampton, UK
information about how the signature is produced by analysing temporal information [4]. Our hypothesis is that dynamic signature features are likely to be more affected by personality than static features. This may be the case as dynamic features mostly involve measures that are a function of how a person moves, and movement is affected by personality [5]. Consequently, exploration of a potential links between dynamic signature features and personality may add important information to a model of SuperIdentity by providing the means to bridge identity categories.
1.1. Graphology and Graphanalysis
The use of Graphology – attempting to assess the personality of an individual from their handwriting - has a long history of deployment across application domains [6]–[8]. Many studies have however questioned the validity of conventional methods of graphology which are based on anecdotal evidence linking personality to static writing characteristics such as word slant and spacing. Indeed many empirical studies have established that a conventional assessment of graphonomic features within writing fails to correlate to simple psychological assessment of the writer’s personality, thereby cannot serve a useful purpose for the many personality screening tasks that methods may be applied to (such as when used as part of a job evaluation process) [9][10]. Graphology research has normally been applied to static features extracted from handwriting text. Few previous studies have tried to find relationships between basic drawn signature features (such as size, slant) and personality traits, e.g. [11][12]. These studies suggest that signature size could be related to self-esteem.
Considering that graphological methods lack predictive power for personality traits, it is worthwhile using a method of analysis that offers more power - graphanalysis. In contrast to graphology, graphanalysis is a branch of forensic document analysis that is established on solid empirical evidence [13]. Whereas graphology uses human inspection of handwriting characteristics and thus highly relies on subjective judgements, studies in graphanalysis use procedural-based or algorithmic methods for establishing the providence of writing and/or signatures. As graphanalysis is evidence based and algorithmic, it offers a powerful objective tool to test whether there really are links between personality and signature. Forensic assessment based on graphanalysis is conventionally conducted on a completed written image, allowing an analysis of static features (e.g. the width of the signature). In this mode of operations dynamic features (e.g. velocity) can only be inferred through microscopic inspection of the writing. As noted earlier, because personality is likely to affect more dynamic features, a direct analysis of dynamic features may reveal the influence of personality on
signatures. By capturing the signature process on a tablet device, these dynamic features can be extracted with increased precision. The use of graphanalysis static features and more advanced dynamic features may lead to the discovery of new links between signature and personality.
1.2. Measurement of Personality
The definition and assessment of human personality has been a subject of debate amongst psychologists for a considerable period of time. A number of experts have provided definitions of personality. Martin [14] defined it as "a particular pattern of behaviour and thinking that prevails across time and situations and differentiates one person from another", whilst Pervin and Cervone [15] defined it as “psychological qualities that contribute to an individual’s enduring and distinctive patterns of feeling, thinking and behaving”. Rather than classify people in distinct categories, modern methods measure the degree to which an individual expresses a particular personality trait. A personality trait is an enduring personal characteristic that reveals itself in a recurring pattern of behaviour in different situations. To try and find links between personality and signatures, we have selected a wide variety of personality scales for use in our experiment. The Five Factor Model or Big Five is perhaps the most dominant formulation of personality and has emerged from the work of McCrae and Costa [16]. It proposes that personality can be evaluated on the following five primary dimensions: neuroticism, extraversion, openness, agreeableness and conscientiousness. These factors can be measured by the 50-item IPIP representation [17], which consists of 50 items that potentially describe the person being evaluated.
Another personality trait that has been measured in the psychological literature is impulsivity, or the extent to which an individual is likely to engage in impulsive behaviour. As Whiteside and Lynam [18] note, impulsivity is important when diagnosing mental disorders using the DSM-IV (“Diagnostic and statistical manual of mental disorders 4th ed.” [19]). Impulsivity can be measured using the UPPS impulsivity scale [18] which focuses on four aspects of impulsivity – lack of premeditation, urgency, sensation seeking and lack of perseverance. Finally, with regards to gender, people’s psychological gender may not match their biological gender. To take account of this, Sandra Bem developed the Bem Sex-Role Inventory (BSRI) [20]. Based on the extent to which participants rate masculine or feminine traits, the BSRI provides two independent ratings for masculinity and femininity.
1.3. Research Questions
SuperIdentity modelling process, we wish to attempt to find potential relationships between signature (from the biometric category) and personality. Recognising that previous studies have failed to find a link between
personality and handwriting, our present study will differ in a number of ways. First, we shall employ a series of algorithmically-extracted features rather than rely on subjective assessments of signatures. Second, we shall use a broader set of personality measures with the signers than in previous studies. Finally, we shall assess both static and dynamic biometric features. Using a broad set of biometric, biographic and personality features, our study aims to identify relationships to be incorporated in the SID model to give it the capability to span categories.
2.
Methodology
In order to explore those relationships across categories, a novel database has been collected: the SuperIdentity Stimulus Database (SSD) [2]. The SSD comprises 113 participants (57 male, 56 female, 10 left-handed, 85 right-handed, 18 unknown handedness) whom have donated personality and biographic data along with 9 dynamic signature samples. The participants were limited to be Caucasians, with an age range from 18 to 35 years old and with English as first language. These limitations were decided in order to focus the research on a specific population. Due to the low number of left-handed users, we analysed only the 85 right-handed (42 male and 43 female) users in order to ensure adequate sample size.
Within the biometric and forensics community there are many static and dynamic features that may be used to distinguish between genuine and forgery signatures. These including stroke duration, velocity and acceleration measurements, and pressure [21][22]. Such features can be measured either at a global level (applied to the whole signature) or a local level (applied to fragments of signatures, for example individual strokes). The biometric features used were selected based on their proven individual discriminative power, demonstrated in [21]– [25].
2.1. Dynamic Signature Assessment
Table 1 lists the dynamic features extracted from temporal aspects of each signature. This temporal information consist of x and y pen position and pressure time series. For details about how these features were calculated see [21]–[25]. In Table 1, vx, vy, ax and ay
denote the velocity and acceleration obtained from x and y
signature time series. v and a are the global velocity and acceleration calculated from their corresponding x and y components. The time derivative of acceleration is usually referred to as jerk, named jx, jy and j. Δx and Δy stands for
the total shift of x and y time signals during pen down segments. Drawing time x (or y) indicates the total time
that vx (or vy) is different to 0, whilst Pause time x (or y) is
the time that vx (or vy) is equal to 0. The directional
histogram features (S1 to S8) relate to the percentage of travel in a quantised eight-directional chain code across a signature.
Table 1 Dynamic signature features
ID Dynamic Feature
1 Angle before last pen up
2 Angle from first pen down to first pen up 3 Angle from first pen down to last pen up 4 Angle from first to second pen down 5 Angle from first to second pen up
6 Angle from second pen down to second pen up 7 Area / ΔY
8 Correlation(vx, vy) / v2(max)
9 Direction histogram S1 10 Direction histogram S2 11 Direction histogram S3 12 Direction histogram S4 13 Direction histogram S5 14 Direction histogram S6 15 Direction histogram S7 16 Direction histogram S8 17 Drawing time x 18 Drawing time y 19 Finishing quadrant
20 First time v local maximum / Time writing 21 First time vx local maximum / Time writing
22 First time vx local minimum / Time writing
23 First time vy local maximum / Time writing
24 First time vy local minimum / Time writing
25 First time x local maximum / Time writing 26 Initial angle
27 Maximum a 28 Maximum ax
29 Maximum ay
30 Maximum distance points / Area 31 Maximum j
32 Maximum jx
33 Maximum jx
34 Maximum v 35 Maximum vx
36 Maximum vy
37 Mean a 38 Mean ax
39 Mean ay
40 Mean jerk 41 Mean jerk x 42 Mean jerk Y 43 Mean pressure 44 Mean v / Max vx
45 Mean v 46 Mean v / v(max) 47 Mean v / vy(max)
48 Mean vx
49 Mean vx
50 Number of pen ups
51 Number of sign changes in vx and vy
52 Number of zero crossing in vx
53 Number of zero crossing in vy
58 RMS v / v (max)
59 Second time x maximum / Time writing 60 Second time y maximum / Time writing 61 Standard deviation ax
62 Standard deviation ay
63 Standard deviation vx
64 Standard deviation vy
65 Standard deviation x / Δx
66 Standard deviation y / Δy
67 Starting quadrant
68 Third time vy local maximum / Time writing
69 Third time vy local maximum / Time writing
70 Time 2nd pen down / Total time 71 Time writing
72 Time writing / Total time 73 Time writing v / Height 74 Time writing v / Width 75 Time(first pen up) / Time writing 76 Time(j maximum) / Time writing 77 Time(jx maximum) / Time writing
78 Time(jy maximum) / Time writing
79 Time(second pen up) / Time writing 80 Time(third pen down) / Total time 81 Time(vx positive) / Time writing
82 Time(vx negative) / Time writing
83 Time(vy positive) / Time writing
84 Time(vy negative) / Time writing
85 Total time
86 Width * Δy / Height * Δx
87 x(1st pen down) - x(min) / Δx
88 x(first pen down) - x(max) / Δx
89 x(last pen up) - x(max) / Δx
90 x(last pen up) - x(min) / Δx
91 y(1st pen down) - y(min) / Δy
92 y(first pen down) - y(max) / Δy
93 y(last pen up) - y(max) / Δy
94 y(last pen up) - y(min) / Δy
95 y(second local maxima)- y(first pen down)/ Δy
2.2. Static Signature Assessment
Table 2 lists the 40 static features extracted from each signature. Static features were calculated through an analysis of pixel locations within a completed signature. Most of the features are self-explanatory, however the following sub-sections and Figures 2 to 6 detail the separate methodologies in order to explain the extraction of certain features. For further details see [21]–[25]. The feature ID numbers continue from Table 1.
Table 2 Static signature features
ID Static Feature
96 % of gaps in x axis (see 2.2.3)
97 % of loop pixels in first x 25% (see 2.2.1-2) 98 % of loop pixels in first y 25% (see 2.2.1-2) 99 % of loop pixels in fourth x 25% (see 2.2.1-2) 100 % of loop pixels in fourth y 25% (see 2.2.1-2) 101 % of loop pixels in second x 25% (see 2.2.1-2) 102 % of loop pixels in second y 25% (see 2.2.1-2) 103 % of loop pixels in third x 25% (see 2.2.1-2) 104 % of loop pixels in third y 25% (see 2.2.1-2) 105 % of pixels below median y (see 2.2.2) 106 % of pixels in bottom y 20% (see 2.2.2) 107 % of pixels in first x 25% (see 2.2.2) 108 % of pixels in first y 25% (see 2.2.2)
109 % of pixels in fourth x 25% (see 2.2.2) 110 % of pixels in fourth y 25% (see 2.2.2) 111 % of pixels in second x 25% (see 2.2.2) 112 % of pixels in second y 25% (see 2.2.2) 113 % of pixels in third x 25% (see 2.2.2) 114 % of pixels in third Y 25% (see 2.2.2) 115 % of pixels in top y 20% (see 2.2.2) 116 % of pixels within loops (see 2.2.1) 117 Compactness / number of pixels 118 Height / Acquisition range y 119 Image area
120 Mean of gaps at median y position
121 Mean of pixel density within occupied 10x10 grid (see 2.2.5) 122 Mean x
123 Mean x - x(min) / Mean x 124 Mean y
125 Number of blanks 10x10 grid (see 2.2.5) 126 Number of gaps at median y position (see 2.2.3) 127 Number of gaps in x axis (see 2.2.3)
128 Number of local maximum x 129 Number of local maximum y 130 Number of loops
131 Number of pixels 132 Signature height 133 Signature width
134 Slope of median y position (see 2.2.4) 135 Width / Acquisition Range x
2.2.1 Enclosed Areas Loops
Figure 2 Enclosed Area “Loops” with Signature.
Enclosed ink areas (or loops) within a signature image are used in a number of features. These include the number of separate loop areas within an image (five areas in the signature shown in Figure 2), the percentage of pixels enclosed within a loop (with respect to the total signature area) and the percentage of loops within intra-signature horizontal and vertical quartiles. These features give an indication of ink overlap within a signature.
2.2.2 Quadrant Divisions
Figure 3 Horizontal and vertical quadrant divisions of signatures.
2.2.3 Gap Analysis
Figure 4 illustrates the assessment of ink gaps within a signature x axis. Marked in red are the intra-signature pixel columns that do not contain ink. The number of gaps (a value of two in the signature shown in Figure 4), and the percentage of x axis coordinates containing gaps, are calculated from this method.
Figure 4 X axis gaps. Figure 5 Signature profile and slope.
2.2.4 Signature Profile and Slope
Calculating the median ink position at each x axis and then fitting a linear polynomial to these median positions gives an indication of the slope of signature. Figure 5 shows the median position and the slope.
2.2.5 Signature Gridding
Figure 6 10x10 gridding of signature.
Figure 6 shows the 10x10 gridding structure used to analyse the use of space within a signature. The grid is sized separately for each signature. Two features are extracted from this structure: the number of blank grid squares (shown by the grey boxes in Figure 6) – thereby giving a measure of free-space within a signature area, and the ink density within occupied grid squares – giving a measure of compactness of ink where drawn.
2.3. Personality and Biographic Assessment
In addition, biographic and personality characteristics were self-reported by participants through online questionnaires. In these questionnaires the participants filled standard online surveys in order to calculate the different personality scales (Five Factor Model, UPPS impulsive behaviour, Bem Sex-Role Inventory, etc.) and to provide their biographic information (sex classification, height, weight and foot size) following a common procedure within personality studies. The scales and ratings are summarized in Table 3. The personality inventories are detailed below:
1. Self-monitoring [26]. This scale measures the extent to which people regulate their behaviour to present a desirable social image, and consisted of 18 items yielding a single rating.
2. Social desirability [27]. Social desirability scales measure the extent to which individuals seek to present themselves as possessing socially desirable traits. A “16 item version” of the scale has been collected, which produced a single measure of social desirability.
3. Bem Sex-Role Inventory [20]. As opposed to a simple report of subject sex (male/female), the BSRI measures the extent to which a person exhibits masculine and feminine traits.
4. UPPS impulsive behaviour [18]. The UPPS impulsive behaviour scale comprises four sub-scales that measure various aspects of impulsivity. These are lack of premeditation, urgency, sensation seeking and lack of perseverance.
5. Situational self-awareness [28]. This scale measures how aware a person is in different contexts. There are three sets of three-item scales measuring private, public and situational self-awareness.
6. Five-factor personality inventory [17]. This scale measures five separate personality traits. Openness to experience is the degree to which a person seeks novelty in their lives, and the extent to which they are independent. Conscientiousness is the degree to which a person acts carefully and with consideration. Extraversion is how sociable and energetic a person is, and the extent to which they are assertive. Agreeableness is how trusting and compassionate a person is, and finally neuroticism is the extent to which a person is emotionally unstable and likely to express and experience negative emotion.
In addition to these personality traits, the analysis of the linear correlations with some basic biographic data has also been conducted. These biographic data include sex classification (coded 1 for males and 2 for females), height (in kilograms), weight (in centimetres) and foot size (UK shoe size scale).
Table 3 Personality and Biographic feature set
ID Scale Feature
136 Self-monitoring 137 Social desirability 138
B
SR
I Bem masculinity
139 Bem femininity 140
U
PP
S UPPS premeditation
141 UPPS urgency
142 UPPS sensations seeking 143 UPPS perseverance 144
SS
A SSA private
145 SSA public 146 SSA situational 147
B
IG
F
IV
E Openness
148 Contentiousness 149 Extraversion 150 Agreeableness 151 Neuroticism 152
B
io
gr
ah
. Sex classification 153 Height
154 Weight 155 Foot size
2.4. Statistical Analysis
methodology was adopted:
1. Calculate a median value for each signature feature across the participant’s collected samples. A median value reduces the risk of skewed data and outliers. 2. Find significant correlations between each personality
and biographic feature and all signature features. 2.1.For continuous numerical features, a Pearson
correlation coefficient is calculated. Due to the large number of correlations calculated, a strict p-value threshold of 0.01 is used.
2.2.For categorical features (e.g. handedness), an independent-samples t-test is performed. Again, a strict p-value threshold of 0.01 is set.
3. Create multilinear regression models:
3.1.Multilinear regression models are created for those personality/biographic features indicating a significant correlation with signature features. In the multilinear model, the personality/biographic feature acts as the response variable, whilst only those significantly correlated signature features act as the predictor variables. A stepwise (or sequential forward selection in case of categorical data) approach is used to select the most relevant features to include in the model. The criterion used at the stepwise selection to add or remove terms was based on the sum-of-squares errors (SSE).
3.2.In parallel, if the personality or biographic feature selected as response is also correlated with another personality or biographic feature, the group of predictors is kept and the response feature is substituted by all the correlated features. These models are compared with the one obtained in stage 2.1 using the R-squared value (or the deviance of the fit in case of categorical features, “Dev”). The best model based on these values is kept. In this way it is possible to assess whether the related feature is the dominant relational factor.
4. To keep only those models which shows a medium/strong correlation, and therefore are the most useful for the SuperIdentity model, the linear models created with an R-squared value lower than 0.2 are dismissed (Cohen [29] has suggested that R-squared values of 0.2, 0.5 and 0.8 can be interpreted as small, medium, and large effect, respectively).
Following this methodology we obtain a set of linear models (or logistic regression models for categorical features) for relationships between personality or biographic features and signature features. In this way we are able to establish if it is possible to infer personality traits from signature features.
3.
Experimental Results
In this section we present the results of our assessment between the three categories: signature features (static and
dynamic), biographic and personality.
3.1. Significant Correlations
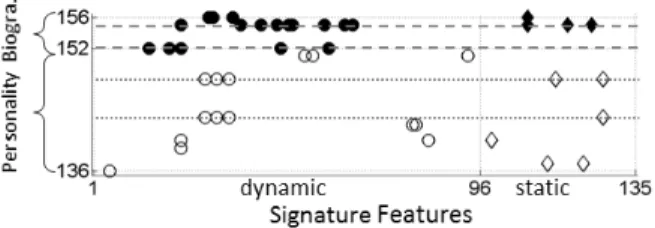
Following the methodology described in Section 2.4, Figure 7 shows the signature features (represented on the x
axis) which have shown significance correlation with either personality or biographic features (y axis). The identified signature features will be used as predictors to create the multilinear regression model.
There exist a number of significant correlations between both dynamic and static signature features and personality features (features ids 136-151 shown with white circles and diamonds). In detail, the personality trait “Conscientiousness” (id 148) shows significant correlations with three dynamic and two static features. “UPPS Perseverance” (id 143), shows a single correlation with a static feature and three significant correlations with dynamic features (shown with dotted horizontal lines, Figure 7). Other correlations have been also found for “Neuroticism” (id 151), “UPPS sensations seeking” (id 142), “UPPS premeditation” (id 140), “Bem femininity” (id 139) and “Self-monitoring” (id 136).
Figure 7 Significant correlations between features.
It can also be seen how biographic features as “sex classification” (id 152), and “weight” (id 154) (shown with dashed horizontal lines, Figure 7) correlate with a substantial number of dynamic signature features, in the case of “sex classification”, and also static features, for “weight”. “Foot size” (id 155) also correlates with several dynamic features and one static feature. Therefore, the inclusion of dynamic features expanded the potential hidden links between signature and personality traits.
However, it is important to highlight that a significant correlation (p-value<0.01) doesn’t imply a medium/strong correlation, which will be analysed in the next Section.
3.2. Linear Models to Assess Relevant Correlations
linear model, while the second column shows the predictor features. The subtype of the predictor feature (dynamic or static) is indicated in column 3. The R-squared value of the model is shown in column “R-sqr”, or deviance of the fit, column “Dev”, for categorical features.
Table 4 Linear/Logistic model for biographic-based features
Response Predictors Subtype Coeff. R-sqr
Weight
% of pixels in first y 25% Sta. 1.1 0.290 First time v local maximum / Time
writing Dyn. 9.5 Response Predictors Subtype Coeff Dev
Sex Classificatio
n
Mean v / v(max) Dyn. -26.9
72.6 RMS v / v(max) Dyn. 16.4 Direction histogram S7 Dyn. -56.2 First time vy local maximum / Time
writing Dyn. 5.41
A multi-linear regression model has been found to link one dynamic velocity feature and one static feature with the “weight” of the subjects, showing an R-squared value of 0.29. The model can be visualised in Figure 8. Although there is a relational tendency, the predictions would have a high level of error.
As a categorical variable, the “sex classification” of the participants can be predicted with a multinomial logistic regression. Sex classification was predicted using a combination of dynamic signature features (mostly related to velocity again). Using the predictors found for “sex classification” and 10-fold cross-validation on the SSD database, a success rate of 75% is achieved.
Figure 8 Adjusted model for Weight
The most interesting results for the objectives of this work are those models which link personality traits with signature features, which are shown in Table 5.
Table 5 Linear models for personality-based features
Response Predictors Subtype Coeff. R-sqr
Contentious-ness
Maximum ay Dyn. 7.33
0.271 % of pixels in first y 25% Sta. 6.96
Number of gaps in x axis Sta. 1.38
UPPS premeditatio
n
Time(vy positive) / Time
writing Dyn. 0.40
0.251 First time vy local
maximum / Time writing Dyn. -7.88 % of loop pixels in fourth
y 25% Sta. 0.007
The inclusion of dynamic features leads to models that predict “Contentiousness” and “UPPS premeditation”. These models are shown in Figure 9 and 10. The figures
show the linear model fit and the real data. Greater values of Contentiousness and UPPS premeditation have higher values of the aggregated adjusted model predictors (detailed in Table 5), although the models only explain a small proportion of the variability.
Figure 9 Adjusted model for Contentiousness
Additionally, weak (R-squared < 0.20) models have been found for “Neuroticism” (0.14), “Social desirability” (0.10), “UPPS perseverance” (0.10), “Self-monitoring” (0.09), “UPPS premeditation” (0.08) and “UPPS sensations seeking” (0.08), but these are not reported here.
Summarizing, several relationships have been found to link signature production with personality traits which will be a valuable input to the SuperIdentity model.
Figure 10 Adjusted model for UPPS lack of premeditation
4.
Conclusion and Future Work
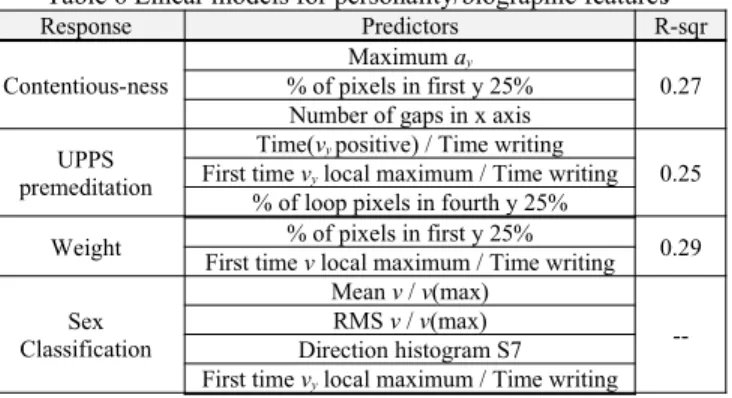
The work presented in this paper aimed to find if there are any relationships between personality traits and signature features. This work is part of the SuperIdentity project, where a rich identity model is being created covering biographic, biometric, cybermetric and personality aspects of identity. In this context, this paper has revisited studies focused on linking personality and signatures, but adds a novel biometric/graphanalysis perspective by taking dynamic and static signature features into consideration. By analysing 135 biometrics features known for their value in authentication tasks, we uncovered several links between personality and signatures.
biographic traits (“sex classification” and “weight”), summarized in Table 6.
Table 6 Linear models for personality/biographic features Response Predictors R-sqr
Contentious-ness
Maximum ay
0.27 % of pixels in first y 25%
Number of gaps in x axis
UPPS premeditation
Time(vy positive) / Time writing
0.25 First time vy local maximum / Time writing
% of loop pixels in fourth y 25%
Weight First time % of pixels in first y 25%v local maximum / Time writing 0.29
Sex Classification
Mean v / v(max)
--RMS v / v(max)
Direction histogram S7 First time vy local maximum / Time writing
The linear models for personality traits showed R-squared values around 0.25, combining static and dynamic signature information. Another interesting result from this work is the relationship between biographic data and signature productions. It was found that “sex classification” and “weight” could be predicted using signatures features, especially velocity signature characteristics.
The results show how the use of static and dynamic algorithmic-based features can lead to more reliable links between personality/biographic features and signature. Nevertheless, further research should be conducted to ensure the validity and generalisation of these links. Such findings potentially enable a reduction in search-space when trying to identify an individual, perhaps in a forensic context. For example, if it is possible to confidently predict aspects of a person’s identity then this may lead to a targeted or weighted search.
The reported findings encourage further research on signature and personality links, by analysing new specific signature features for this task, taking into account the user’s variability when performing signatures, using vector regression thereby considering personality traits jointly, and applying more complex techniques from pattern recognition and machine learning algorithms.
Acknowledgements
This work was supported by UK EPSRC Grant EP/J004995/1 (SID: An Exploration of SuperIdentity).
References
[1] S. M. Black, S. Creese, R. M. Guest, B. Pike, S. J. Saxby, D. Stanton Fraser, S. V Stevenage, and M. T. Whittty, “Superidentity: Fusion of identity across real and cyber domains”, ID360 Glob. Identity, 2012.
[2] Uni. of Southampton, Uni. of Kent, Uni. of Leiceester, Uni. of Dundee, Uni. of Bath, Uni. of Oxford, Pacific Northwest National Laboratories, “The SuperIdentity Project”, 2013. [Online]. Available:www.southampton.ac.uk/superidentity/.
[3] A. K. Jain, R. Bolle, and S. Pankanti, “Biometrics: personal identification in networked society”, Springer, 1999. [4] M. Faundez-Zanuy, “Signature recognition
state-of-the-art”, IEEE Aerosp. Electron. Syst. Mag., 20(7):28–32, 2005.
[5] M. Koppensteiner and K. Grammer, “Body movements of male and female speakers and their influence on perceptions of personality”, Pers. Indiv. Dif., 51(6):743– 747, Oct. 2011.
[6] H. J. Eysenck, “Graphological analysis and psychiatry: an experimental study”, Br. J. Psychol. Gen. Sect., vol. 35, no. 3, pp. 70–81, 1945.
[7] G. Ben-Shakhar, M. Bar-Hillel, Y. Bilu, E. Ben-Abba, and A. Flug, “Can graphology predict occupational success? Two empirical studies and some methodological ruminations”, J. Appl. Psychol., vol. 71(4):645, 1986. [8] G. C. Booth, “The use of graphology in medicine”, J. Nerv.
Ment. Dis., 86(6):674–679, 1937.
[9] H. J. Eysenck and G. Gudjonsson, “An empirical study of the validity of handwriting analysis”, Pers. Individ. Dif., 7(2):263–264, 1986.
[10] R. Driver, M. Buckley, D. Frink , “Should We Write Off Graphology?”, Int. J. of Sel. and Asses., 4(2):78–86, 1986. [11] R. L. Zweigenhaft and D. Marlowe, “Signature size: Studies
in expressive movement”, Journal of consulting and clinical psychology, 40(3):469, 1973
[12] A. Rawal, C. J. Harmer, R. J. Park, U. D. O’Sullivan, and J. M. G. Williams, “A Sense of Embodiment Is Reflected in People’s Signature Size”, PLoS One, vol. 9(2):438, 2014. [13] R. A. Huber and A. M. Headrick, “Handwriting
identification: facts and fundamentals”, CRC Press, 1999. [14] G. N. Martin, N. R. Carlson, and W. Buskist, “Psychology”.
Pearson Education, 2009.
[15] D. Cervone and L. A. Pervin, “Personality: Theory and Research”. Wiley, 2013.
[16] R. R. McCrae and P. T. Costa, “Updating Norman’s‘ adequacy taxonomy’: Intelligence and personality dimensions in natural language and questionnaires”, J. Pers. Soc. Psychol., 49(3):710, 1985.
[17]T. Buchanan, J. Johnson, and L. Goldberg, “Implementing a five-factor personality inventory for use on the internet”, Eur. J. Psychol. Assess., 21(2): 115–127, 2005.
[18] S. P. Whiteside and D.R. Lynam, “The five factor model and impulsivity: Using a structural model of personality to understand impulsivity”, Pers. Ind. Dif., 30(4):669–689, 2001.
[19] A. P. A., “Diagnostic and statistical manual of mental disorders”, 4th ed. Washington: APA, 1994.
[20] S. L. Bem, “The measurement of psychological androgyny”, J. Consult. Clin. Psychol., 42(2):155–162, 1974.
[21] L. S. Oliveira, E. Justino, C. Freitas, and R. Sabourin, “The graphology applied to signature verification”, in Conf. Inter. Graphonomics Society, 286–290, 2005
[22] J. Fierrez-Aguilar, L. Nanni, J. Lopez-Peñalba, J. Ortega-Garcia, and D. Maltoni, “An on-line signature verification system based on fusion of local and global information”, in Audio-and video-based biom. person auth., 523–532,2005. [23] L. L. Lee, T. Berger, and E. Aviczer, “Reliable online
[24] W. Nelson and E. Kishon, “Use of dynamic features for signature verification” in IEEE International Conference on Systems, Man, and Cybernetics, 1991.
[25] W. Nelson, W. Turin, and T. Hastie, “Statistical methods for on-line signature verification”, Int. J. pattern Recognit. Artif. Intell., 8(3):749–770, 1994.
[26] S. Gangestad and M. Snyder, “To carve nature at its joints’: On the existence of discrete classes in personality”, Psychol. Rev., 92(3):317, 1985.
[27] J. Stöber, “The Social Desirability Scale-17 (SDS-17): Convergent validity, discriminant validity, and relationship with age”, Eur. J. Psychol. Assess., 17(3):222, 2001. [28] J. M. Govern and L. A. Marsch, “Development and
validation of the situational self-awareness scale”, Conscious. Cogn., 10(3):366–378, 2001.