a Asst. Prof., PhD., Kahramanmaras Sutcu Imam University, Faculty of Economics and Administrative Sciences, Department of Business Administration, Kahramanmaras, Turkiye, serkansans@hotmail.com (ORCID ID: 0000-0002-1927-1092)
Cite this article as: Sahin, S. (2018). Foreign direct investment, international trade and financial development in BRICS-T countries: A Bootstrap panel causality analysis. Business and Economics Research Journal, 9(2), 301-316.
The current issue and archive of this Journal is available at: www.berjournal.com
Foreign Direct Investment, International Trade and Financial
Development in BRICS-T Countries: A Bootstrap Panel
Causality Analysis
Serkan Sahina
Abstract: The aim of this paper is to investigate, within a Bootstrap panel causality
approach, the interactions among foreign direct investment (FDI), international trade and financial development in BRICS-T countries (Brazil, Russia, India, China South Africa and Turkey). While the effect of foreign direct investment on economic growth is well documented, the consequences of FDI on financial development have not received as much attention. Previous studies have recognized that FDI is a crucial source of financing especially for emerging economies, though the benefit of FDI to recipient country is ambiguous. Furthermore, the number of previous studies examining the causal linkage between international trade and financial development is also limited. Besides, examining the associations among these factors, this study also investigates the joint effect of FDI and international trade on financial development in these countries. Empirical findings from a bootstrap panel causality approach indicate that FDI induce financial development in Brazil, Russia, and China. In addition, international trade promotes financial market development in Brazil, Russia and South Africa. Empirical findings also indicate that financial development stimulates international trade in Brazil, India and Turkey. Finally, it is found in this study that not only international trade stimulates FDI, but also FDI induce international trade in India and Turkey.
Keywords: Financial Development, FDI, International Trade, Bootstrap Panel Causality, BRICS-T Countries
JEL: B17, E22, G10, E44, O16
Received: 21 December 2018 Revised: 9 February 2018 Accepted: 22 March 2018
1. Introduction
While the consequences of financial development on economic growth are well documented, the effect of economic factors on financial development has not received as much attention. However, the number of studies examining the effects of international trade and foreign direct investment on the development of financial markets has grown leaps and bounds in the last two decades, since there are many motivations to expect causal association between these indicators.
First, as a cheap and an efficient way of transferring applied science and skills from developed countries to developing countries, FDI induce an increase in the volume of the funds in financial markets, hence amplifying the liquidity and promoting the trade of financial instruments and contracts (Levine, 1997, Unctad, 1999; Desai et al., 2006; Mendoza et al., 2007). Furthermore, inward FDI flows forces local financial firms to support financial reforms and liberalization which in turn boost the financial system (Rajan & Zingales, 2003; Kholdy & Sohrabian, 2008). On the other hand, financial reforms, liberalization and reduced level of information asymmetry attract foreign investors more in financial markets (Unctad, 1998; Asiedu,
Analysis
2006; Alfaro et al., 2008). In particular, more financially developed countries attract higher FDI since FDI increase with fewer restrictions on payments as well as higher degree of financial political stability (Noman & Uddin, 2011; Motelle, 2011). It is also argued that financial incentives are much more effective in attracting FDI than fiscal incentives (Miskinis & Mikneviciute, 2011).
However, other studies also theoretically argue that the association between financial development and FDI is ambiguous. Though, FDI can boost the well-functioning of financial markets via the eased access of external financing especially in financially vulnerable sectors, it may also negatively affect financial development because of the disintegration and indirect competition effects (Desbordes & Wei, 2014). Instead of financing via capital markets, FDI can be used by firms which are in need of capital (Hausmann & Fernandez-Arias, 2000; 2001). In this manner, FDI is a hampering factor of financial development.
Together with openness to capital flows, international trade stimulates new entries of financial intermediaries into the financial system. In this manner, international trade can boost the well-functioning of the financial system especially in developing economies (Rajan & Zingales, 2003). At the one extreme, liberalization of international trade contributes to the openness of an economy (Mottaleb & Kalirajan, 2010). In particular, a free market economy is more likely to engage in higher FDI flows. At the other extreme, it is argued that international trade is seen as substitute of FDI in many cases (Markusen, 1984; Shatz & Venables, 2000). This point of view mainly depends on the tariff jumping hypothesis of Jordaan (2004) who argues that multinational firms may decide to set up their branches in host countries to overcome trade barriers, strict product specific rules and trade costs such as vehicle ownership and use, travel costs, fuel externalities, land use and equity impacts (Dunning, 1980; Liargovas & Skandalis, 2012). In this manner, trade liberalization limits the amount of external financing in host countries by stimulating the movement of goods and services.
The majority of the studies focusing on the association between FDI, financial development and economic growth mainly investigate relation between FDI on economic growth (Bekaert et al., 2005; Alfaro et al., 2010; Urbsiene & Sendriy, 2014). However, there are few studies examining in-depth association between FDI and financial development especially in emerging economies (See, Alfaro et al, 2003; Nasser & Gomez, 2009; Sghaier & Abida, 2013; Desbordes & Wei, 2014).
In recent years, the focus on BRICS countries has grown leaps and bounds since these countries have enormous growth potential for the next two decades. It is expected that BRICS-T countries will overtake the G7 countries in the near future. Hence, the causal linkages between FDI, international trade and financial development have great importance in this process. As far as I know, there is no study examining the in depth relation among financial development, international trade and FDI in BRICS-T countries. However, there many studies examining the interactions among FDI, financial development and economic growth (See, Hermes & Lensink, 2003; Kandır et al., 2007; Lee & Chang, 2009; Felek et. al, 2018) and the relation between FDI and other factors such as intellectual property, patents and R&D (See, Tanaka & Iwaisako, 2014; Korhan & Çağrı, 2017). There are also studies investigating the FDI for BRICS-T countries (See, Helhel, 2017). However, it is seen causal associations among FDI, financial development and international trade is not well documented in literature. This paper enriches the limited literature examining financial development-FDI relation in BRICS-T countries. This paper also accounts for the consequences of international trade on FDI and financial development.
The rest of the paper is structured as follows. Literature about financial development, investment and international trade is given in Section 2. Data and the methodology are explained in Section 3. Empirical results are discussed in Section 4. Finally concluding remarks are provided in Section 5.
2. Financial Development, Investment and Trade: A Brief Literature Review
Business and Economics Research Journal, 9(2):301-316, 2018
financial development, it seems that developed markets seem to take more advantage of FDI (Alfaro et al, 2003). However, results for the developing markets are much more controversial. Nasser and Gomez (2009) find that there is positive association between FDI and financial development. Moreover, examining the panel data of Tunisia, Morocco, Algeria and Egypt for the time period 1980-2011 Sghaier and Abida (2013) find that there is positive correlation between financial development and FDI using Generalized Method of Moment (GMM). Using the data of 67 developed and developing countries, Desbordes and Wei (2014) conclude that financial development is a motivating factor for inward FDI flows specifically for the sectors that have limited access to finance sectors. However, it is also concluded that it reduces the volume of inward FDI in financially less developed sectors. Using the data of 97 countries, Dutta and Roy (2011) find that financial development is positively related with FDI up to a assured level, however, the relation become negative beyond that level. Using VAR and modified granger casualty models, Nasir et al. (2017: 228) cannot find any causal interaction between FDI and financial development in Saudi Arabia.
In another study, using panel vector autoregressive approach Fauzel (2016: 367) found that there is bidirectional causality between FDI and financial development for Antigua and Barbuda, Aruba, Bahamas, Bahrain, Belize, Comoros, Cyprus, Dominican Republic, Dominica, Grenada, Guyana, Jamaica, St Lucia, St Vincent and Grenadines, Malta, Papua New Guinea, Maldives, Mauritius (island economies). In their study, Shah et al. (2015) found causality from FDI to financial development for Indonesia, Malaysia, the Philippines, Singapore, and Thailand (ASEAN countries) in the short run. However, they also reported supporting evidence for the bidirectional causality between FDI and financial development for the period from 2005 to 2013. Moreover, using Dynamic panel data approach for the period 2002 to 2011 Samimi et al. (2013: 1285) reported supportive evidence for the causal linkage between FDI and financial development for the countries in Middle East and North Africa (MENA) region. Gebrehiwot et al. (2016: 64) reported causal interaction between FDI and financial development for the countries in Sub-Saharan African region for the period 1991-2013 using two step panel regression and Granger causality analysis. Desbordes and Wei (2017: 1) also reported supportive evidence for a causal interaction between FDI and financial development.
Evidence on the linkage within international trade and inward FDI flows is inconclusive. Various studies find that international trade promotes inward FDI flows in host countries (Asiedu, 2002; Onyeiwu & Shrestha; 2004; Ang, 2008; Mottaleb & Kalirajan; 2010). However, it is also found that international trade restrains the volume of inward FDI flows (Wheeler & Mody, 1992; Brainard, 1997).
Studies examining the linkage between international trade and financial development are also limited and mixed. Though, some studies report causality running from international trade to financial development (Law, 2009; Baltagi et al., 2009), other studies find causality in opposite direction (Beck, 2002; Kar et al., 2014) whereas some of them find bidirectional causality (Svaleryd & Vlachos, 2002). Kim et al. (2011) find that relation between these indicators is positive in the long run, whereas negative in the short run. Examining the relation between export, import and financial development for the time period from 1990-2011, Zhao (2017: 987) found a U-shaped relation between these factors for 108 countries analyzed. In other words, they found evidence of positive relation between exports and financial development for the countries with less developed financial markets, whereas, they found inverse relationship for the countries with developed financial markets.
3. Data and Research Methodology
It is highly possible that spillover effect is generated due to international trade and financial integration across countries. In order to account for this effect, cross sectional dependency test should be applied in the very first step of the panel data analysis (Kar et al., 2011; Menyah et al., 2014). In testing the cross sectional dependency, Peseran (2004) argued two different cross sectional dependency test. The first one is the Breusch and Pagan (1980) suggest LM statistics which is estimated as follow:
𝐿𝑀𝐵𝑃= 𝑇 ∑ ∑ 𝜌̂2𝑗𝑘
𝑁
𝑘=𝑖+1 𝑁−1
Analysis
where is the 𝜌̂ is the Pearson correlation coefficient of the residuals which is estimated as follows.
𝜌̂ = 𝑇 ∑ 𝑒𝑗𝑡𝑒𝑘𝑡
𝑇 𝑡=1
(∑𝑇𝑡=1𝑒𝑗𝑡2) 1
2 ⁄
(∑𝑇𝑡=1𝑒𝑘𝑡2) 1
2 ⁄
The Breusch and Pagan (1980) 𝐿𝑀𝐵𝑃 test gives consistent estimations for the cases when T>N.
However, Pesaran (2004) suggests the below scaled LM statistics (CDLM) for the samples when both cross
sectional and time extension is large (T>N, N>T) .
𝐶𝐷𝐿𝑀= √
1
𝑁(𝑁 − 1)∑ ∑ (𝑇𝜌̂
2 𝑗𝑘− 1) 𝑁
𝑘=𝑖+1 𝑁−1
𝑗=1
Pesaran (2004) argue that the CDLM test gives inconsistent results when T is relatively small and N is relatively large. Pesaran (2004) suggests a generalized version of the test which accounts for these cases. The aforementioned CD statistics is calculated as below (Pesaran, 2004);
𝐶𝐷 = √ 2𝑇
𝑁(𝑁 − 1)(∑ ∑ 𝜌̂𝑗𝑘
𝑁
𝑘=𝑖+1 𝑁−1
𝑗=1
)
where ρ̂ij is the estimated pairwise interactions of the residuals. Pesaran et al. (2008) also suggest an
improved interpretation of this test in order to account for the cases where both cross sectional and time dimension is fixed. This test is referred ad (LMadj) and estimated as below (Pesaran et al., 2008):
𝐿𝑀𝑎𝑑𝑗= √
2
𝑁(𝑁 − 1)∑ ∑
(𝑇 − 𝑟)𝜌̂2
𝑗𝑘− 𝜇𝑇𝑗𝑘
𝑣𝑇𝑗𝑘 𝑁
𝑘=𝑖+1 𝑁−1
𝑗=1
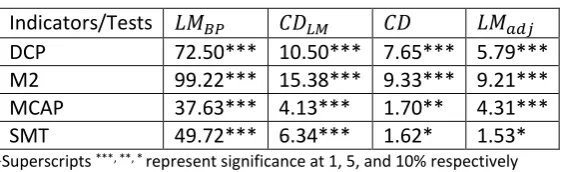
Where r is the number of regressors. The estimated statistics are shown in Table 1.
Table 1. Cross Sectional Dependency
Indicators/Tests 𝐿𝑀𝐵𝑃 𝐶𝐷𝐿𝑀 𝐶𝐷 𝐿𝑀𝑎𝑑𝑗
DCP 72.50*** 10.50*** 7.65*** 5.79***
M2 99.22*** 15.38*** 9.33*** 9.21***
MCAP 37.63*** 4.13*** 1.70** 4.31***
SMT 49.72*** 6.34*** 1.62* 1.53*
1Superscripts ***, **, * represent significance at 1, 5, and 10% respectively
It is seen in Table 1 that cross sectional dependency for all financial development indicators exist. These initial findings indicate that spillover effect is generated via the information transmission across BRICS-T countries.
There are many advantages of using panel data sets. First, panel data improves the efficiency of the estimates via decreasing multicollinearity and increasing degrees of freedom. Panel data also enables pooling the data and controlling for the individual differences. Another advantage is that it is much easier to control over the unobserved/omitted variables in panel setting (Hsiao et al., 1995; Baltagi & Song, 2006).
Business and Economics Research Journal, 9(2):301-316, 2018
𝑦𝑚,1,𝑡= 𝛼1,1+ ∑𝑘=1𝑗𝑘𝑦1𝛽1,1,𝑘𝑦𝑚,1,𝑡−𝑘+ ∑𝑗𝑘𝑥𝑘=11∅1,1,𝑘𝑥1,𝑡−𝑘+ ∑𝑗𝑘𝑧𝑘=11𝜑𝑧1,𝑡−𝑘+ 𝜀1,1,𝑡
𝑦𝑚,2,𝑡= 𝛼1,2+ ∑𝑘=1𝑗𝑘𝑦1𝛽1,2,𝑘𝑦𝑚,2,𝑡−𝑘+ ∑𝑘=1𝑗𝑘𝑥1∅1,2,𝑘𝑥2,𝑡−𝑘+ ∑𝑗𝑘𝑧𝑘=11𝜑1,2,𝑘𝑧2,𝑡−𝑘+ 𝜀1,2,𝑡
𝑦𝑚,2,𝑡= 𝛼1,𝑁+ ∑𝑘=1𝑗𝑘𝑦1𝛽1,𝑁,𝑘𝑦𝑚,𝑁,𝑡−𝑘+ ∑𝑘=1𝑗𝑘𝑥1∅1,𝑁,𝑘𝑥𝑁,𝑡−𝑘+ ∑𝑗𝑘𝑧𝑘=11𝜑1,𝑁,𝑘𝑧𝑁,𝑡−𝑘+ 𝜀1,𝑁,𝑡
𝑥1,𝑡 = 𝛼2,1+ ∑𝑘=1𝑗𝑘𝑦1𝛽2,1,𝑘𝑦𝑚,1,𝑡−𝑘+ ∑𝑗𝑘𝑥𝑘=11∅2,1,𝑘𝑥1,𝑡−𝑘+ ∑𝑗𝑘𝑧𝑘=11𝜑𝑧1,𝑡−𝑘+ 𝜀2,1,𝑡
𝑥2,𝑡= 𝛼2,2+ ∑𝑘=1𝑗𝑘𝑦1𝛽2,2,𝑘𝑦𝑚,2,𝑡−𝑘+ ∑𝑘=1𝑗𝑘𝑥1∅2,2,𝑘𝑥2,𝑡−𝑘+ ∑𝑗𝑘𝑧𝑘=11𝜑2,2,𝑘𝑧2,𝑡−𝑘+ 𝜀2,2,𝑡
𝑥𝑁,𝑡= 𝛼2,𝑁+ ∑𝑘=1𝑗𝑘𝑦1𝛽2,𝑁,𝑘𝑦𝑚,𝑁,𝑡−𝑘+ ∑𝑘=1𝑗𝑘𝑥1∅2,𝑁,𝑘𝑥𝑁,𝑡−𝑘+ ∑𝑗𝑘𝑧𝑘=11𝜑2,𝑁,𝑘𝑧𝑁,𝑡−𝑘+ 𝜀2,𝑁,𝑡.
𝑧1,𝑡 = 𝛼3,1+ ∑𝑘=1𝑗𝑘𝑦1𝛽3,1,𝑘𝑦𝑚,1,𝑡−𝑘+ ∑𝑗𝑘𝑥𝑘=11∅3,1,𝑘𝑥1,𝑡−𝑘+ ∑𝑗𝑘𝑧𝑘=11𝜑𝑧1,𝑡−𝑘+ 𝜀3,1,𝑡
𝑧2,𝑡= 𝛼3,2+ ∑𝑘=1𝑗𝑘𝑦1𝛽3,2,𝑘𝑦𝑚,2,𝑡−𝑘+ ∑𝑘=1𝑗𝑘𝑥1∅3,2,𝑘𝑥2,𝑡−𝑘+ ∑𝑗𝑘𝑧𝑘=11𝜑3,2,𝑘𝑧2,𝑡−𝑘+ 𝜀3,2,𝑡
𝑧𝑁,𝑡= 𝛼3,𝑁+ ∑𝑘=1𝑗𝑘𝑦1𝛽3,𝑁,𝑘𝑦𝑚,𝑁,𝑡−𝑘+ ∑𝑗𝑘𝑥𝑘=11∅3,𝑁,𝑘𝑥𝑁,𝑡−𝑘+ ∑𝑗𝑘𝑧𝑘=11𝜑3,𝑁,𝑘𝑧𝑁,𝑡−𝑘
Where x1 represent to FDI, z1 indicates to international trade, ym is the financial development
indicator with the subscripts m referring to DCP, M2, MCAP and SMT. Index k is the lag length, t (t = 1, … … T) is the time period, N (i = 1, … … N) is the number of cross section units. In this equation system, if all of the β2’s equal to zero but not all ∅1,i’s jointly equal to zero, there is causality from X to Y for country i.
There is causality running from Y to X, if entire ∅1,i’s jointly equal to zero but at least one of the β2’s is not
equal to zero. There is one-way causality running from 𝑍 to𝑌, if all of the 𝛽3’s equal to zero but at least one
of the 𝜑1,𝑖’s is not equal to zero. If 𝜑1,𝑖’s jointly equal to zero but at least 𝛽3’s is not equal to zero, there is
causality from 𝑌 to Z. There is bidirectional causality between 𝑋 and 𝑌, if at least one of the 𝛽2’s and one of
the ∅1,𝑖’s don’t equal to zero, and if all ∅1,𝑖’s and 𝛽2’s equal to zero this means there is no causality between
these factors. There is bidirectional causality between 𝑍 and 𝑌, if none of the𝛽3’s and 𝜑1,𝑖’s equal to zero,
and no causal association exist between 𝑍 and 𝑌, if all 𝜑1,𝑖’s and 𝛽3’s jointly equal to zero.
Though there is no rule of thumb in determining the maximal lag length, it is suggested one should refrain from setting too many and too few lags since it may cause specification error and omitted variables problem respectively. Hence, it is assumed that lag length varies between 1 and 4 for the annual data, and lag length that maximizes the Schwartz Information Criterion (SIC) is preferred.
The annual data of BRICS-T countries (Brazil, Russia, India, China, South Africa and Turkey) is retrieved from the WDI database. 1993-2013 period is covered since more recent data for the selected countries is not available on the database. It is seen in literature that there are various measures of financial development (Bettin & Zazzaro, 2011: 513). The financial development indicators used in this study are listed in Table 2.
Table 2: Proxies of Financial Development
Indicators Variable
Domestic credit to private sector/GDP DCP
Money and quasi money to GDP M2
Market capitalization to GDP MCAP
Stock market trade to GDP SMT
Analysis 4. Empirical Findings
Having established that cross sectional dependency exists; panel causality methodology of Kónya (2006) which accounts for this issue is employed. This methodology mainly depends on Wald statistics and bootstrap critical values for each of the cross section units. To conserve space, Table 3 only reports the significant causal linkages found in panel Granger causality analysis (Please see the bootstrap estimations in Appendix A). The causality between “A to B” indicate the null hypothesis of no causality running from “A” to “B is examined”. The notation → is donated to indicate the causality running from A” to “B” and ← for the causality from “B” to “A” and ↔ for the bidirectional causality.
Table 3. Bootstrap Panel Causality Results
Countries DCP M2 MCAP SMT
Panel A: Causality between FDI and FD
Brazil None → None None
Russia None None ↔ None
India None None None None
China → None None None
South Africa None None None None
Turkey None None None None
Panel B: Causality between IT and FD
Brazil → ↔ None None
Russia None None → None
India ← None None None
China None None None None
South Africa → None None None
Turkey None ← None None
Panel C: Causality between IT and FDI
Brazil None None None None
Russia None None None None
India ← → None ↔
China None None None None
South Africa None None None None
Turkey ← → → None
It is seen in Table 3 that the causal linkages among the variables are dominated by cross sectional units and type of financial development indicators used. In particular, panel causality results show that FDI improves the estimates of development of financial markets in Brazil, Russia and China. In other words, FDI boost financial development in these countries. Findings for Russia imply that not only FDI promote financial development but also financial development foster FDI in this country. As one of the developing countries, it seems that Russia is an attractive investment destination. There are many underlying rationale attracting FDI for developing countries such as low-cost unskilled labor force, low transport and communication costs, non-tariff barriers and high growth potential of the market. It is also found that there is no causal association running from FDI to financial development in India, South Africa and Turkey. In other words, FDI is not a crucial factor to amplify development of financial markets in these countries.
Business and Economics Research Journal, 9(2):301-316, 2018
unidirectional causality is also found for India and Turkey, which means that financial development boost international trade in these countries. This implies that the more a market is developed, the more it accomplishes to export goods bound to financial markets. This result is consistent with those of Beck, 2002 and Kar et al., 2014. Results for Brazil also provide evidence of bidirectional causality meaning that not only international trade boost financial development but also financial development enhances international trade in this country. This implies that financial development is a motivating factor for trade in Brazil. It is seen that there is causal association between international trade and financial development in China.
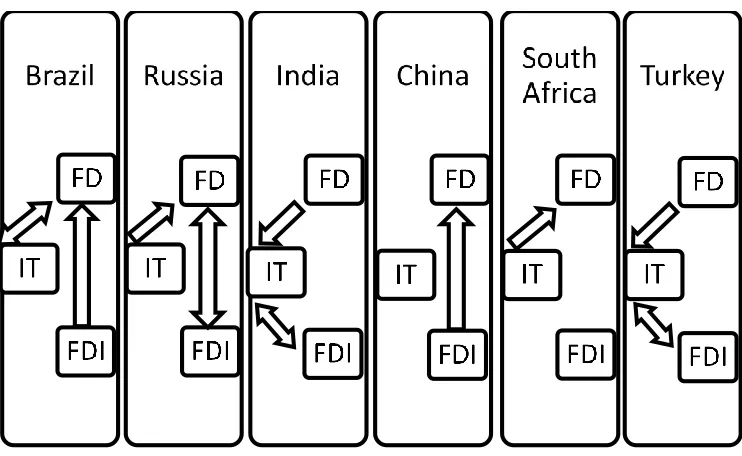
Findings for FDI and international trade provide evidence that international trade increases the forecasting power of FDI in Turkey and India. This indicates that international trade induces FDI in Turkey and India. This finding is consistent with the evidence provided by Kravis and Lipsey, 1982; Asiedu, 2002; Ang, 2008; Mottaleb and Kalirajan; 2010. Moreover, it seems that FDI also cause international trade in Turkey and India. This is a foregone conclusion for developing countries since it is expected that increased investment in production will raise production and export of goods. In India, it seems that this causal association is bidirectional when stock market trade (SMT) is the financial development indicator. In other words, FDI foster international trade and international trade improve the forecasts of FDI in India. The empirical findings can be summarized in Figure 1 below. In this figure, one way arrow indicates causality running from one factor to another, whereas two way arrow shows bidirectional causality between the factors in essence. Though the results seem to be mixed, it is seen that FDI induce financial development in all cases except for India and Turkey. In addition, it seems that financial development also attracts FDI in Russia. This indicates that financial development is a motivating factor in attracting FDI in Russia, whereas there is no this kind of relation for other countries. Moreover, international trade supports the development of financial markets in Brazil, Russia and South Africa. However, financial development stimulates international trade in Brazil, India and Turkey. Hence, it is seen that there is bidirectional relation between international trade and financial development in Brazil. In assessing the association between international trade and FDI, it is seen that causal linkage exists only in India and Turkey.
Figure 1. Causal Interactions among Financial Development, FDI and International Trade in BRICS-T
Countries
Analysis
Table 4. Bootstrap Panel Causality Results for the Joint Effect of International Trade and Foreign Direct
Investment on Financial Development
Countries DCP M2 MCAP SMT
Brazil None None None None
Russia None None → None
India None None None None
China → None None None
South Africa → None None None
Turkey None None None None
The empirical findings indicate that FDI and international trade jointly cause financial development in China, Russia and South Africa. These results indicate that though international trade does not cause FDI itself, together with FD it affects FDI in Russia, China and South Africa. This implies that international trade is a transmission mechanism for these countries.
5. Conclusions
Causal associations between FDI, international trade and financial development in BRICS-T countries are examined in this paper. Besides examining the relation between FDI and financial development in emerging economies, this study also investigate the effect of international trade on financial development and FDI. In order to examine the causal associations between these factors four different proxies of financial development are used. It is seen that results are country specific.
For Brazil, it is seen that FDI triggers financial development. In other words the capital raised by foreign investors help to promote financial development in this country. In addition, results indicate that not only financial development boost international trade but also international trade foster financial development in this country.
For Russia, FDI is a crucial factor for financial development. Moreover, it is seen that financial development is motivating factor in attracting inward FDI in this country. İt is also found that international trade boost financial development in this country. Hence, international trade and FDI are both significant factors in supporting financial development in Russia.
For India, it is recognized that there is no interaction between financial development and FDI. However, it is also seen that financial development triggers international trade in this country. Moreover, international trade and FDI boost each other in India.
For China, there is only one suggested relation between these factors, namely the interaction between FDI and financial development. It is recognized that similar to Brazil and Russia FDI fosters financial development in China.
For South Africa, similar to China, there is only one remarkable interaction between international trade and financial development. In particular, international trade is a significant factor for financial development in this country.
For Turkey, similar to India and South Africa, there is no interaction between FDI and financial development. However, financial development fosters international trade and international trade boost FDI in this country. FDI also triggers international trade in Turkey.
Business and Economics Research Journal, 9(2):301-316, 2018
Except for the China, it is seen that international trade trigger financial development and vice versa in BRICS-T countries. This result is consistent with many previous studies (See, Do and Levchenko, 2007; Law, 2009; Baltagi et al., 2009). The effect of international trade on financial development is an expected outcome since international trade can contribute to the development of the financial markets via the increasing intermediation. It is also seen that export and import decisions are also mainly driven by the development of financial markets.
It is also seen that FDI and international trade is also associated in India and Turkey. This implies that investment is directed to the financially developed markets. This result is consistent with those of Asiedu, 2002; Onyeiwu and Shrestha; 2004; Ang, 2008; Mottaleb and Kalirajan; 2010.
Aside from servicing a gap in the literature, this study provides valuable information for the policy makers dealing with the development of financial markets in emerging economies. It is highly recommended for future studies to examine financial development with the inclusion of additional macroeconomic variables.
References
Alfaro, L., Chanda, A., Kalemli Ozcan, S., & Sayek, S. (2003). FDI spillovers, financial markets and economic development.
IMF Working Papers No: WP/03/186, http://www.imf.org/external/pubs/ft/wp/2003/wp03186.pdf.
Alfaro, L., Kalemli Ozcan, S., & Volosovych, V. (2008). Why doesn't capital flow from rich to poor countries? An empirical investigation. The Review of Economics and Statistics, 90(2), 347-368.
Alfaro, L., Kalemli Ozcan, S., & Sayek, S. (2009). FDI, productivity, and financial development. The World Economy, 32(1), 111–135.
Alfaro, L., Chanda, A., Kalemli Ozcan, S., & Sayek, S. (2010). Does foreign direct ınvestment promote growth? Exploring the role of financial markets on linkages. Journal of Development Economics, 91, 242-256.
Ang, J.B. (2008). Determinants of foreign direct investment in Malaysia. Journal of Policy Modeling, 30(1), 185-189. Arun, K., & Yıldırım, D.Ç. (2017). Effects of foreign direct ınvestment on intellectual property, patents and R&D. MPRA
Paper 80470, https://ideas.repec.org/p/pra/mprapa/80470.html.
Asiedu, E. (2002). On the determinants of foreign direct investment to developing countries: Is Africa different?, World
Development, 30(1), 107- 119.
Asiedu, E. (2006). Foreign direct investment in Africa: The role of natural resources, market size, government policy. Institutions and Political Instability, The World Economy, 29(1), 63-77.
Baltagi, B.H., & Song, S.H. (2006). Unbalanced Panel Data: A Survey. Statistical Papers, 47, 493-523.
Baltagi, B.H., Demetriades, P., & Law, S.H. (2009). Financial development and openness: Evidence from Panel Data.
Journal of Development Economics, 89, 285 –296.
Beck, T. (2002). Financial development and ınternational trade ıs there a link? Journal of International Economics, 57, 107-131.
Bekaert, G., Harvey, C.R., & Lundblad, C. (2005). Does financial liberalization spur growth? Journal of Financial
Economics, 77(1), 3–56.
Bettin, G., & Zazzaro, A. (2011). Remittances and financial development: Substitutes or complements in economic growth? Bulletin of Economic Research. 64(4), 509–536.
Brainard, S.L. (1997). An empirical assessment of the proximity-concentration trade-off between multinational sales and trade. American Economic Review, 87(4), 520-544.
Breusch, T., & Pagan, A. (1980). The Lagrange Multiplier Test and its application to model specifications in econometrics.
Review of Economic Studies, 47(1), 239–253.
Desbordes, R., & Wei, S.J. (2014). The effects of financial development on foreign direct investment. World Bank Policy Research Working Paper No. 7065, SSRN:http://ssrn.com/abstract=2513121.
Desbordes, R., & Wei, S.J. (2017). The Effects of financial development on foreign direct investment. NBER Working
Analysis
Desai, M.A., Foley, C.F., & Hines, J.R. (2006). Capital controls, liberalizations, and foreign direct investment. The Review
of Financial Studies, 19, 1434-1464.
Do, Q.T., & Levchenko, A.A. (2007). Comparative advantage, demand for external finance, and financial development.
Journal of Financial Economics, 86, 796–834.
Dunning, J.H. (1980). Towards an eclectic theory of ınternational production: Some empirical tests. Journal of
International Business Studies, 11(1), 9-31.
Dutta, N., & Roy, S. (2011). Foreign direct ınvestment, financial development and political risks. The Journal of
Developing Areas, 44(2),303-327.
Fauzel, S. (2016). Modeling the relationship between FDI and financial development in small island economies: A PVAR approach. Theoretical Economics Letters, 6, 367-375.
Felek, Ş., Yayla, N., & Çağlar, A. (2018). Türkiye’de AB doğrudan yatırımları, finansal gelişme ve ekonomik büyüme ilişkisine ARDL yaklaşımı. Uluslararası İktisadi ve İdari İncelemeler Dergisi, 20, 63-82.
Gebrehiwot, A., Esfahani, N., & Sayim, M. (2016). The relationship between FDI and financial market development: The case of the Sub-Saharan African Region. International Journal of Regional Development, 3(1), 64-80.
Hausmann, R., & Fernández-Arias, E. (2000). Foreign direct investment: Good cholesterol? Inter-American Development Bank Working Paper 417, http://www.iadb.org/res/publications/pubfiles/pubWP-417.pdf.
Hausmann, R., & Fernández-Arias, E. (2001). Is FDI a safer form of financing? Emerging Markets Review, 2(1), 34–49. Helhel, Y. (2017). Küreselleşme ve finansal gelişme arasındaki etkileşimin Türkiye ve BRICS ülkeleri için incelenmesi.
Mehmet Akif Ersoy Üniversitesi Sosyal Bilimler Enstitüsü Dergisi, 9(20), 158-178.
Hermes, N., & Lensink, R. (2003). Foreign direct investment, financial development and economic growth. The Journal
of Development Studies, 40(1), 142-163.
Hsiao, C., Mountain, D.C., & Ho-Illman, K. (1995). Bayesian integration of end use metering and conditional demand analysis. Journal of Business and Economic Statistics, 13, 315-326.
Jordaan, J.C. (2004). Foreign direct investment and neighboring ınfluences. PhD Thesis, University of Pretoria.
Kandır, S.Y., İskenderoğlu, Ö., & Önal, Y.B. (2007). Finansal gelişme ve ekonomik büyüme arasındaki ilişkinin araştırılması.
Ç.Ü. Sosyal Bilimler Enstitüsü Dergisi, 16(2), 311-326.
Kar, M., Nazlioglu, S., & Agir, H. (2011). Financial development and economic growth nexus in the MENA countries: Bootstrap Panel Granger Causality Analysis. Economic Modelling, 28(1-2), 685–693.
Kar, M., Nazlioglu, S., & Agir, H. (2014). Trade openness, financial development and economic growth in Turkey: Linear and Nonlinear Causality Analysis. Journal of BRSA Banking and Financial Markets, 8(1), 63-86.
Kim, D.H., Lin, S.C., & Suen, Y.B. (2011). Interactions between financial development and trade openness. Scottish
Journal of Political Economy, 58(4), 567-588.
Kholdy, S., & Sohrabian, A. (2008). Foreign direct investment, financial markets and political corruption. Journal of
Economic Studies, 35(6), 486-500.
Kónya, L. (2006). Exports and growth: Granger Causality Analysis on OECD countries with a Panel Data Approach.
Economic Modeling, 23(6), 978–992.
Kravis, I.B., & Lipsey, R.E. (1982). The location of overseas production for exports by US multinational firms. Journal of
International Economics, 12, 201-223.
Law, S.H. (2009). Trade openness, capital inflows and financial development in developing countries. International
Economic Journal, 23(3), 409 – 426
Lee, C.C., & Chang, C.P. (2009). FDI, financial development, and economic growth: International evidence. Journal of
Applied Economics, 12(2), 249-271.
Levine, R. (1997). Financial development and growth: Views and agenda. Journal of Economic Literature, 35(2), 688– 726.
Liargovas, P.G., & Skandalis, K.S. (2012). Foreign direct investment and trade openness: The case of developing economies. Social Indicators Research, 106, 323–331.
Markusen, J.R. (1984). Multinationals, multi-plant economies, and the gains from trade. Journal of International
Economics, 16(3–4), 205–226.
Business and Economics Research Journal, 9(2):301-316, 2018
Menyah, K., Nazlioglu, S., & Wolde-Rufael, Y. (2014). Financial development, trade openness and economic growth in African countries: New insights from a Panel Causality Approach. Economic Modeling, 37, 386-394.
Miskinis, A., & Mikneviciute, M. (2011). Comparative analysis of FDI incentives in new EU member states.
Transformations in Business and Economics, 10(3), 72-86.
Motelle, S. (2011). The role of remittances in financial development in Lesotho: Evidence from alternative measures of financial development. Journal of Development and Agricultural Economics, 3, 241-251.
Mottaleb, K.A., & Kalirajan, K. (2010). Determinants of foreign direct ınvestment in developing countries: A comparative analysis. The Journal of Applied Economic Research, 4(4), 369–404.
Nabila, E., Bahri, A., Shaari Md Nor, A.H., Haji Mohd Nor, N.H., & Sarmidi, T. (2017). Foreign direct ınvestment, financial development and economic growth: A Panel Data Analysis. Jurnal Pengurusan, 51, 1-22.
Nasir, N.M., Rehman, M.Z., & Nasir, A. (2017). Foreign direct ınvestment, financial development and economic growth evidence from Saudi Arabia. International Journal of Financial Research, 8(4), 228-239.
Nasser, O.M., & Gomez, X.G. (2009). Do well-functioning financial systems affect the FDI flows to Latin America?.
International Research Journal of Finance and Economics, 29, 60-75.
Noman, A., & Uddin, G. (2011). Remittances and banking sector development in South Asia. International Journal of
Banking and Finance, 8, 47-66.
Onyeiwu, S., & Shrestha, H. (2004). Determinants of foreign direct investment in Africa. Journal of Developing Societies, 20(1), 89-106.
Pesaran, M.H. (2004). General diagnostic tests for cross section dependence in panels. IDEAS Working Paper, //https://ideas.repec.org/p/cam/camdae/0435.html.
Pesaran, M.H., Ullah, A., & Yamagata, T. (2008). A bias-adjusted LM test of error crosssection independence.
Econometrics Journal, 11(1), 105–127.
Ponikvar, N., & Kejzar, K.Z. (2014). Foreign direct investment, competition and markup size of firms. Transformations in
Business and Economics, 13(3), 251-268.
Rajan, R.J., & Zingales, L. (2003). Saving capitalism from the capitalists: Unleashing the power of financial markets to
create wealth and spread opportunity. Working Paper,
http://faculty.chicagobooth.edu/luigi.zingales/papers/research/capintro.pdf.
Samimi, A.J., Gholamrezapour, A., & Rezanejad, Z. (2013). Financial development, FDI and governance in Mena Region.
Middle-East Journal of Scientific Research, 17(9), 1285-1289.
Shah, I., Zainal, A., Haseeb, M., Azam, M., & Islam, R. (2015). Foreign direct investment, financial development, international trade and energy consumption: Panel Data evidence from selected ASEAN countries. International
Journal of Energy Economics and Policy, 5(3), 841-850.
Shatz, H.J., & Venables, A.J (2000). The geography of international investment. World Bank Policy Research Working
Paper No: 2338,
https://openknowledge.worldbank.org/bitstream/handle/10986/18843/multi_page.pdf?sequence=1.
Sghaier, I.M., & Abida, Z. (2013). Foreign direct investment, financial development and economic growth: Empirical evidence from North African countries. Journal of International and Global Economic Studies, 6(1), 1-13. Svaleryd, H., & Vlachos, J. (2002). Markets for risk and openness to trade: How they are related. Journal of International
Economics, 57(2), 369–395.
Tanaka, H., & Iwaisako, T. (2014). Intellectual property rights and foreign direct investment: A welfare analysis. European
Economic Review, 67, 107-124.
Unctad (1998). World investment report: Trends and determinants. United Nations Conference on Trade and Development, http://unctad.org/en/Docs/wir1998_en.pdf.
Unctad (1999). Foreign direct investment and the challenge of development. United Nations Conference on Trade and Development, http://unctad.org/en/docs/wir1999_en.pdf.
Urbsiene, L., & Sendriy, O. (2014). The relationship between financial development and economic growth in Lithuania.
Transformations in Business and Economics, 13(3), 446-467.
Wheeler, D., & Mody, A. (1992). International investment location decisions: The case of U.S firms. Journal of
International Economics, 33, 57-76.
Zhao,L., Liu, Z., Wei, W., & Andreosso-O’Callaghan, B. (2017). FDI outflows, exports and financial development. Journal
Analysis Appendix
Appendix A
Financial Development (DCP) and Foreign Direct Investment (FDI)
H0: FDI does not cause DCP H0: DCP does not cause FDI
Countries Wald
Test Stat. Boots. Crit. Values
Wald
Test Stat. Boots. Crit. Values
1% 5% 10% 1% 5% 10%
Brazil 0.14 23.26 12.64 8.59 1.51 24.26 13.35 9.31 Russia 6.65 21.40 11.00 7.42 2.08 19.64 10.40 7.06 India 0.13 19.19 9.87 6.63 1.00 22.50 11.40 7.83 China 12.21** 16.23 8.58 5.91 0.12 23.78 12.84 8.88
South Africa 4.36 20.22 10.23 6.69 3.16 17.58 9.06 6.14 Turkey 3.77 16.22 8.85 6.02 0.21 24.18 12.73 8.71
2Note: All critical values depend on 10,000 bootstrap repetitions
Financial Development (MCAP) and Foreign Direct Investment (FDI)
H0: FDI does not cause MCAP H0: MCAP does not cause FDI
Countries Wald
Test Stat. Boots. Crit. Values
Wald
Test Stat. Boots. Crit. Values
1% 5% 10% 1% 5% 10%
Brazil 0.31 19.12 10.37 7.02 0.46 20.16 10.76 7.40 Russia 15.53** 21.55 10.69 7.19 22.43** 25.24 13.23 8.94
India 0.23 19.13 9.43 6.32 0.24 20.16 10.49 7.25 China 0.32 24.70 12.71 8.60 0.62 22.34 11.97 8.16 South Africa 1.68 16.36 8.28 5.72 1.52 17.96 8.90 6.05 Turkey 0.22 17.16 8.57 5.68 2.39 15.58 7.49 5.44
3 Note: All critical values depend on 10,000 bootstrap repetitions.
Financial Development (SMT) and Foreign Direct Investment (FDI)
H0: FDI does not cause SMT H0: SMT does not cause FDI
Countries Wald
Test Stat. Boots. Crit. Values
Wald
Test Stat. Boots. Crit. Values
1% 5% 10% 1% 5% 10%
Brazil 5.88 25.88 13.47 9.24 0.17 23.49 12.29 8.34
Russia 2.28 20.88 10.798 7.30 4.38 27.24 14.82 10.33
India 0.69 18.61 10.05 6.81 5.21 22.40 12.91 8.82
China 5.29 23.51 12.29 8.38 0.15 23.02 12.72 8.81
South Africa 1.66 17.84 9.26 6.44 0.81 18.45 9.80 6.51
Turkey 0.40 19.01 9.90 6.83 0.75 15.42 8.14 5.41
4Note: All critical values depend on 10,000 bootstrap repetitions
Financial Development (M2) and Foreign Direct Investment (FDI)
H0: FDI does not cause M2 H0: M2 does not cause FDI
Countries Wald
Test Stat. Boots. Crit. Values
Wald
Test Stat. Boots. Crit. Values
1% 5% 10% 1% 5% 10%
Brazil 14.71** 21.45 11.07 7.56 1.87 20.73 10.94 7.13
Russia 1.44 20.21 10.59 6.89 2.87 24.86 13.65 9.33
India 3.43 17.94 8.92 5.93 0.89 23.23 12.50 8.77
China 1.33 14.63 7.72 5.29 0.12 24.52 12.54 8.65
South Africa 0.75 17.00 8.68 6.00 0.12 18.40 9.17 6.17
Turkey 2.72 19.47 9.77 6.71 5.89 18.97 9.93 6.81
Business and Economics Research Journal, 9(2):301-316, 2018
Financial Development (MCAP) and International Trade (IT)
H0: IT does not cause MCAP H0: MCAP does not cause IT
Countries Wald
Test Stat. Boots. Crit. Values
Wald
Test Stat. Boots. Crit. Values
1% 5% 10% 1% 5% 10%
Brazil 0.98 18.08 9.52 6.70 0.43 22.28 12.00 8.28 Russia 11.06** 21.35 10.98 7.62 1.37 25.13 13.00 8.79
India 1.79 20.46 10.44 6.93 2.81 20.76 11.22 7.45 China 1.56 21.17 11.69 8.03 2.92 20.67 11.41 7.86 South Africa 0.95 18.63 9.70 6.63 3.26 20.31 10.89 7.44 Turkey 0.30 16.59 8.48 5.65 0.47 16.83 9.35 6.41
5Note: All critical values depend on 10,000 bootstrap repetitions.
Financial Development (DCP) and International Trade (IT)
H0: IT does not cause DCP H0: DCP does not cause IT
Countries Wald
Test Stat. Boots. Crit. Values
Wald
Test Stat. Boots. Crit. Values
1% 5% 10% 1% 5% 10%
Brazil 15.39** 20.38 11.19 7.88 2.75 18.23 9.59 6.47
Russia 10.69 31.44 15.95 11.30 0.22 25.28 13.40 9.24
India 0.26 17.04 9.26 6.37 7.99* 21.52 11.15 7.52
China 5.15 18.80 9.38 6.46 1.66 21.57 10.64 7.11
South Africa 7.25* 19.58 10.16 6.80 2.28 7.22 10.68 20.59
Turkey 2.27 18.44 9.73 6.64 1.73 7.76 11.28 21.96
6Note: All critical values depend on 10,000 bootstrap repetitions.
Financial Development (SMT) and International Trade (IT)
H0: IT does not cause SMT H0: SMT does not cause IT
Countries Wald
Test Stat. Boots. Crit. Values
Wald
Test Stat. Boots. Crit. Values
1% 5% 10% 1% 5% 10%
Brazil 5.61 22.55 13.05 9.04 0.18 23.30 12.97 8.68 Russia 2.18 25.00 13.18 9.11 2.56 24.67 12.91 8.74 India 0.37 20.08 10.92 7.22 2.19 18.69 10.75 7.41 China 5.60 23.54 11.97 8.35 4.45 21.08 11.27 7.85 South Africa 0.74 18.43 10.27 7.00 2.13 19.75 10.74 7.38 Turkey 4.10 18.42 10.38 6.29 0.24 17.22 9.16 6.26
7Note: All critical values depend on 10,000 bootstrap repetitions
Financial Development (M2) and International Trade (IT)
H0: IT does not cause M2 H0: M2 does not cause IT
Countries Wald
Test Stat. Boots. Crit. Values
Wald
Test Stat. Boots. Crit. Values
1% 5% 10% 1% 5% 10%
Brazil 12.61** 18.60 10.50 7.29 10.18** 19.94 9.92 6.81
Russia 2.22 27.28 14.45 9.85 0.24 24.74 13.38 9.15 India 0.18 14.63 7.69 5.32 7.91 21.40 12.06 8.38 China 2.92 17.58 9.33 6.08 0.66 23.82 12.06 8.56 South Africa 1.90 17.13 8.90 5.96 2.59 21.36 11.61 8.01 Turkey 1.39 17.81 9.10 5.98 7.12* 20.65 10.39 6.99
Analysis
Foreign Direct Investment (FDI) and International trade (IT) (Financial Development Indicator: M2)
H0: IT does not cause FDI (FD indicator: M2)
H0: FDI does not cause IT (FD indicator: M2)
Countries Wald
Test Stat. Boots. Crit. Values
Wald
Test Stat. Boots. Crit. Values
1% 5% 10% 1% 5% 10%
Brazil 1.32 18.70 10.24 6.94 0.69 21.42 11.09 7.78 Russia 4.03 24.65 13.31 9.49 2.37 27.26 15.15 10.42 India 17.21** 21.17 11.41 7.80 0.14 19.78 10.00 6.56 China 0.32 20.75 10.99 7.19 0.42 20.02 11.32 7.82 South Africa 0.85 18.17 9.31 6.37 0.47 17.96 8.54 5.72 Turkey 21.57*** 17.60 9.21 6.24 5.07 21.65 11.14 7.37
9Note: All critical values depend on 10,000 bootstrap repetitions
Foreign Direct Investment (FDI) and International trade (IT) (Financial development indicator: SMT)
H0: IT does not cause FDI
(FD indicator: SMT)
H0: FDI does not cause IT
(FD indicator: SMT)
Countries Wald
Test Stat. Boots. Crit. Values
Wald
Test Stat. Boots. Crit. Values
1% 5% 10% 1% 5% 10%
Brazil 0.45 19.90 10.93 7.47 0.59 22.52 12.11 8.50
Russia 0.77 29.83 16.79 11.72 0.27 20.01 10.01 6.65
India 22.30** 24.13 13.98 9.71 9.20* 20.37 11.37 7.68
China 0.25 23.07 12.76 8.86 0.57 23.38 12.63 8.58
South Africa 0.15 18.98 10.11 7.01 0.12 18.19 8.88 5.99
Turkey 1.25 15.46 7.96 5.50 0.57 20.17 10.46 7.24
10Note: All critical values depend on 10,000 bootstrap repetitions
Foreign Direct Investment (FDI) and International Trade (IT) (Financial Development Indicator: MCAP)
H0: IT does not cause FDI
(FD indicator: MCAP)
H0: FDI does not cause IT
(FD indicator: MCAP)
Countries Wald
Test Stat. Boots. Crit. Values
Wald
Test Stat. Boots. Crit. Values
1% 5% 10% 1% 5% 10%
Brazil 0.72 21.76 11.72 8.10 0.37 20.90 11.04 7.69 Russia 10.84 28.97 15.78 11.22 0.14 22.31 12.12 8.01 India 0.52 22.25 11.90 8.12 0.38 18.39 10.00 6.94 China 0.27 22.43 11.85 8.04 0.91 21.69 11.81 8.07 South Africa 3.14 16.76 8.41 5.82 0.12 14.77 8.09 5.72 Turkey 15.35** 17.71 9.37 6.24 0.28 18.14 10.60 6.34
11Note: All critical values depend on 10,000 bootstrap repetitions
Foreign Direct Investment (FDI) and International Trade (IT) (Financial Development Indicator: DCP)
H0: IT does not cause FDI
(FD indicator: DCP)
H0: FDI does not cause IT
(FD indicator: DCP)
Countries Wald Test Stat. Boots. Crit. Values Wald Test Stat. Boots. Crit. Values
1% 5% 10% 1% 5% 10%
Brazil 0.81 19.05 9.87 6.83 0.62 19.75 11.15 7.94
Russia 1.99 26.37 13.49 9.02 3.10 19.27 10.36 6.87
India 0.47 19.04 9.66 6.48 12.27** 19.56 9.71 6.52
China 0.81 18.74 9.76 6.56 0.60 22.69 11.97 8.04
South Africa 0.56 15.79 8.56 5.93 0.45 18.10 9.36 6.49
Turkey 1.94 20.380 10.32 7.06 8.65* 18.64 10.06 6.97
Business and Economics Research Journal, 9(2):301-316, 2018 Appendix B
Causality Running from FDI and IT to Financial Development (Financial Development Indicator: DCP)
H0: FDI and IT do not cause Financial Development (Financial
Development Indicator: DCP)
Countries Wald Test Stat. Boots. Crit. Values
1% 5% 10%
Brazil 7.19 21.07 11.70 7.99
Russia 4.92 21.72 11.37 7.56
India 0.12 15.70 8.42 5.80
China 15.05** 16.89 8.96 5.96
South Africa 8.67* 19.53 10.08 6.84
Turkey 3.98 17.11 8.37 5.60
13Note: All critical values depend on 10,000 bootstrap repetitions
Causality Running from FDI and IT to Financial Development (Financial Development Indicator: MCAP)
H0: FDI and IT do not cause Financial Development
(Financial Development Indicator: MCAP) Countries Wald Test Stat. Boots. Crit. Values
1% 5% 10%
Brazil 0.27 17.93 9.67 6.67
Russia 15.56** 20.59 10.75 7.07
India 1.52 18.60 9.65 6.49
China 0.71 24.50 13.04 8.82
South Africa 1.08 17.28 9.33 6.46
Turkey 0.15 15.73 8.42 5.75
14Note: All critical values depend on 10,000 bootstrap repetitions
Causality Running from FDI and IT to Financial Development (Financial Development Indicator: M2)
H0: FDI and IT do not cause Financial Development
(Financial Development Indicator: M2) Countries Wald Test Stat. Boots. Crit. Values
1% 5% 10%
Brazil 1.62 19.56 10.64 7.38
Russia 0.65 20.97 10.29 6.69
India 1.82 15.88 8.62 5.78
China 2.46 17.02 8.61 5.79
South Africa 2.19 16.79 8.49 5.72
Turkey 0.18 17.11 8.99 6.05
Analysis
Causality Running from FDI and IT to Financial Development (Financial Development Indicator: SMT)
H0: FDI and IT do not cause FD
(Financial Development Indicator: SMT) Countries Wald Test Stat. Boots. Crit. Values
1% 5% 10%
Brazil 8.84 22.98 13.17 9.10
Russia 3.85 22.20 12.01 7.89
India 0.30 18.11 9.35 6.36
China 0.65 22.01 12.33 8.56
South Africa 0.21 18.24 10.03 7.01
Turkey 3.99 20.26 9.69 6.50