Volume 2, Issue 8, August 2013
Page 276
Abstract
Advances in the area of bio-medical image processing of chest X-ray has resulted in the acquisition of high-quality images of the human chest. With these advances, there arises a genuine need for image processing algorithms specific to the chest, in order to fully exploit this digital technology. Image enhancement is an important part of image processing and it is applied in every field where images are ought to be understood and analyzed. Image enhancement is basically improving the interpretability or perception of information in images for human viewers and providing better input for other automated image processing techniques. The principal objective of image enhancement is to modify attributes of an image to make it more suitable for a given task and a specific observer. During this process, one or more attributes of the image are modified. In image enhancement, resizing, improving brightness and contrast of the image, filtering is done. The Enhancement process improves the visual quality of the image by removing extraneous information from the image. The paper focuses on spatial domain techniques for image enhancement, with particular reference to point processing methods and histogram processing.
Keywords: Negativity, Profile, Enhancement, Radiologist
1.
I
NTRODUCTIONThe success of digital techniques in various medical imaging modalities (computed tomography, nuclear magnetic resonance, and digital subtraction angiography) has generated considerable interest in chest radiology. One of the primary reasons for this trend toward digital chest radiography is that the human chest is a very difficult structure to image [1]. The major challenge is the wide dynamic range of information between X-rays emerging from the heavily attenuated mediastinum (heart, spine, aorta, and other central features on the radiograph) and those that have passed through the air-filled lungs. Although this wide dynamic range is difficult to represent faithfully with current film-screen techniques, many of these problems could be circumvented by a digital representation [2]-[7].
Lung cancer is known as one of the most difficult cancers to cure and the number of deaths that it causes is generally increasing. A detection of the lung cancer in its early stage can be helpful for medical treatment to limit the danger [8]. One of the measures is a mass screening process for lung cancer. As a conventional method for mass screening process, chest X-ray films have been used for lung cancer diagnosis.
In the lung, either malignant and benign tissues or one of them is present. It became difficult for radiologist to decide whether the patient is having malignant tissues or not. Malignant tissues are cancerous and benign tissues are not cancerous. Not only the tissues are creating problems in analyzing chest X-ray, but also the presence of noise, overlapping of the organ and the presence of any other disease (cough, T.B. etc.). Sometimes visual and technical limitation makes it difficult to detect lung cancer.
X-ray techniques are economical and required less time to generate X-ray image which makes it popular among the middle class families and radiologist. But on the other hand it has some limitation. Discovering a lung nodule from a chest X-ray image can be challenging task and missed due to a variety of factors including the presence of ribs, clavicle, trachea, blood vessels, and heart which could block or obscure the view of a nodule [9]. Also, suboptimal image acquisition and ill-defined margins compound the difficulty for radiological interpretations. Digital image processing offers various enhancement techniques which could facilitate a more accurate detection of a lung nodule on a chest radiograph. Image enhancement is used to improve the interpretability or perception of information in images for human viewers, or to provide better input for other automated image processing techniques [10].
In this study, the paper focus on spatial domain point processing-filtering, histogram and contrast enhancement techniques which are to be used to improve the visibility of a chest radiograph and to make a lung nodule more evidently seen through reducing relative tonal background, sharper edges, and enhanced contrast. The study serves to facilitate early detection of a lung nodule from a chest radiograph as a pre-screening procedure.
Spatial Domain Enhancement Techniques for
Detection of Lung Tumor from
Chest X-Ray Image
Manoj R. Tarambale1 and Nitin S. Lingayat2
1Electrical HOD, Marathwada Mitra Mandal’s college of Engineering,
Pune, Pin-411052, University of Pune, Maharashtra, India
2Electrical HOD, DR. Babasaheb Ambedkar Technological University’s Institute of Petrochemical Engineering,
Volume 2, Issue 8, August 2013
Page 277
2.
FILTER
Filtering in image processing is a process that cleans up appearances and allows for selective highlighting of specific information. Noise is basically considered as a high pass region. For removing noise low pass filter is used. No matter how much care one takes, some amount of noise always creeps in the image [11]. Noises which are commonly found in any image are Gaussian noise and salt & pepper noise.
2.1 Averaging filter
It is a spatial domain filter used for noise reduction. The output of the average filter is simply the average of pixel contained in the neighbor of the filter mask. The size of the neighborhood controls the amount of filtering. In averaging filter, each pixel is replaced by a weighted average of its neighborhood pixels. It preserves the smooth region in the image and its removes the sharp variation leading to blurring effect. Salt and pepper noise are a type of the noise that are commonly found in the image. Averaging filter eliminates salt and pepper noise. Average filtering is given by equation:-
) 1 ( ) , ( ) , ( 1 ) , ( ˆ
xy S t s t s g n m y x fMask for averaging filter is given by
Figure 1 3×3 averaging filter mask
If the average of the mean of the whole image and mean of the neighboring pixel is computed then the image sharpness can be retained. It is given by
) 2 ( 2 ) , ( 1 ) , ( 1 ) , (
ˆ (,) (,)
st Sxy st Sxy
t s g n m t s i N M y x I
Where
I
ˆ
(
x
,
y
)
is a resulted image. ‘M’ and ‘N’ is the number of rows and columns of the image. ‘m’ and ‘n’ are thenumber of rows and columns of the mask. ‘
i
(
s
,
t
)
is the original image andg
(
s
,
t
)
is the image obtain after mask on the image. It will reduce the blurring of the image.2.2 High Boost filter
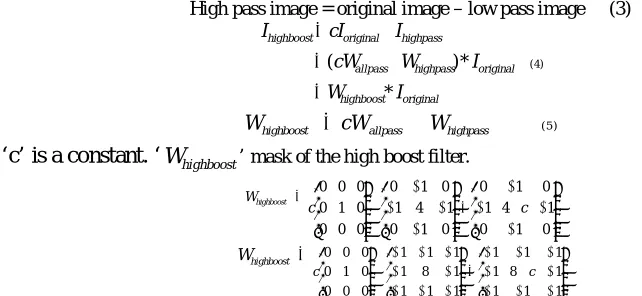
High boost filter is a modified version of the high pass filter. It is often desirable to emphasize high frequency components representing the image details without eliminating low frequency components (such as sharpening). In this case, the high-boost filter can be used to enhance high frequency component while still keeping the low frequency components:
High pass image = original image – low pass image (3)
original highboost original highpass allpass highpass original highboost I W I W cW I cI I * * )
( (4)
) 5 ( highpass allpass
highboost cW W
W
Where ‘c’ is a constant. ‘
W
highboost’ mask of the high boost filter. highboost W 0 1 0 1 4 1 0 1 0 0 1 0 1 4 1 0 1 0 0 0 0 0 1 0 0 0 0 c c highboost W 1 1 1 1 8 1 1 1 1 1 1 1 1 8 1 1 1 1 0 0 0 0 1 0 0 0 0 c c
Volume 2, Issue 8, August 2013
Page 278
3
ENHANCEMENT
3.1 Negativity
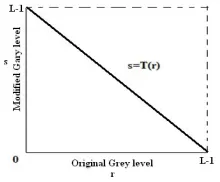
Negative simply means inverting the gray level i.e. if pixel in the original image is black, then it will look white and vice versa. It shifts histogram from the brighter side to darker side or darker side to the brighter side. In general
s = (L - 1) – r (6)
Where ‘L’ is a maximum gray value in the image. r is the gray value of the pixel.
Figure 2 Negative transform for an 8 bit image
In Figure 2, vertical axis represent modified grey level ‘s’ and horizontal axis represent an original grey level ‘r’.
3.2 Contrast Manipulation
Low contrast images occur due to poor or non-uniform lighting conditions or due to nonlinearity or small dynamic range of the imaging sensor. Horizontal axis ‘r’ represents the input pixel value, and the vertical axis‘s’ represents the output pixel value. As seen, there are three straight line segments used to transform an input pixel to its resulting output pixel value. The transformation of the input pixel value to the output pixel value is via the piecewise linear profile shown in the Figure 3.
The parameters specifying the contrast stretch mapping are the four values r2, s2, r3, s3, which determine the position of the intermediate straight line segment. Modifying any of these four values modifies the contrast stretch transformation. The values of r1, s1, r4, s4 are fixed.
‘a’ and ‘b’ are the two thresholds. ‘l’, ‘m’ and ‘n’ are the slopes of the straight line in contrast streching transform.
Figure 3 Contrast Stretching Transformation. For dark region stretch l >1, mid region stretch m >1, bright region stretch n >1.
Formula for contrast stretching algorithm is given by
) 7 (
1 0
) .(
) .(
.
L r b
b r a
a r
w b r n
v a r m
r l s
The parameter ‘a’ and ‘b’ can be obtained by examining the histogram of the image.
3.3 Histogram and Histogram Manipulation
The histogram provides a convenient summary of the intensities in an image. The histogram of an image is a plot of the number of occurrences of gray levels in the image against the gray-level values. The horizontal axis of the plot represents the tonal variations, while the vertical axis represents the number of pixels in that particular tone. The left side of the horizontal axis represents the black and dark areas, the middle represents the medium grey and the right hand side represents light and pure white areas. The vertical axis represents the size of the area that is captured in each one of these zones [12].
Volume 2, Issue 8, August 2013
Page 279
regions is often not perceptible. Histogram manipulation basically modified the histogram of an input image as to improve the visual quality of the image. It is process that attempt to spread out the gray levels in an image so that they are evenly distributed across their range. It reassigns the brightness values of pixels based on the image histogram and provides more visually pleasing results across a wider range of images.4 SEGMENTATION
Segmentation partitions an image into distinct regions containing each pixel with similar attributes. To be meaningful and useful for image analysis and interpretation, the regions should strongly relate to depict objects or features of interest. Meaningful segmentation is the first step from low-level image processing transforming a grayscale or colour image into one or more other images to high-level image description in terms of features, objects, and scenes. The success of image analysis depends on the reliability of segmentation, but an accurate partitioning of an image is generally a very challenging problem.
4.1 THRESHOLDING
It is the simplest non-contextual segmentation technique. With a single threshold, it transforms a grayscale or colour image into a binary image considered as a binary region map. The binary map contains two possibly disjoint regions, one of them containing pixels with input data values smaller than a threshold and another relating to the input values that are at or above the threshold. The former and latter regions are usually labeled with zero (0) and non-zero (1) labels, respectively. The segmentation depends on image property being thresholded and on how the threshold is chosen [12]. Generally, the non-contextual thresholding may involve two or more thresholds as well as produce more than two types of regions such that ranges of input image signals related to each region type are separated with thresholds. The question of thresholding is how to automatically determine the threshold value.
The most common image property to threshold is pixel grey level:
) 8 ( ) , ( 0 ) , ( 1 ) , ( T y x f if T y x f if y x g
where ‘T’ is the threshold.
Using two thresholds, T1 < T1, a range of grey levels related to region 1 can be defined:
) 9 ( 1 2 1 2 ) , ( ) , ( ) , ( ) , ( T y x f if c T y x f T if b T y x f if a y x g
Where a, b and c are any three distinct intensity values and T1, T2 are the two thresholds [14], [15].
4.2 Morphological Image Processing
It is a collection of non-linear operations related to the shape or morphology of features in an image. Morphological operations rely only on the relative ordering of pixel values, not on their numerical values, and therefore are especially suited to the processing of binary images. Morphological operations can also be applied to grayscale images such that their light transfer functions are unknown and therefore their absolute pixel values are of no or minor interest.
Morphological techniques probe an image with a small shape or template called a structuring element. The structuring element is positioned at all possible locations in the image and it is compared with the corresponding neighborhood of pixels. Some operations test whether the element "fits" within the neighborhood, while others test whether it "hits" or intersects the neighborhood.
A morphological operation on a binary image creates a new binary image in which the pixel has a non-zero value only if the test is successful at that location in the input image.
4.3 Dilation
It is a process in which the binary image is expanded from its original shape. The way binary image is expanded is determined by the structuring element. The structuring element is smaller in size compared to the image itself, and normally the size used for the structuring element is 3×3.the structuring element is reflected and shifted from left to right and from top to bottom, at each shift the process will look for any overlapping similar pixels between the structuring element and that of binary image. If there exists an overlapping then the pixels under the central position of the structuring element will be turned to 1 or black. It has effects of filling in the valleys between spiky edges [13].
4.4 Erosion
Volume 2, Issue 8, August 2013
Page 280
will look for, whether there is a complete overlap with the structuring element or not. If there is no complete overlapping then the centre pixel indicated by the centre of the structuring element will be set white or 0. It has the effect of deleting spiky edges [13].5 BLOCK
DIAGRAM
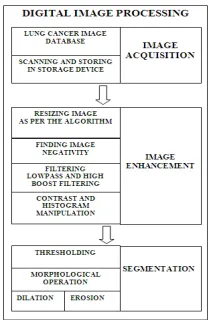
Figure 4 Stages of propose algorithm
Figure 2 Indicates various steps used in digital image processing. These steps are followed for enhancing and segmentation of the chest X-ray image.
6 RESULT
AND
DISCUSSION
The success of digital techniques in various medical imaging modalities (X-rays, CTs, MRI and PET scan) has generated considerable interest in chest radiology. But their success in detecting lung cancer in its early stage is limited to certain levels. A Lot of research is carried out in the field of image processing for early detection of cancer. Because of the environment harsh condition, human and technical error affects the quality of the image and produces a difficulty in for radiological interpretation. Digital image processing facilities various algorithms, which help in improving image quality and makes image error free. It improves the perception of information in image for human viewers. In digital image processing, image parameters are manipulated, in order to obtain certain useful information for further classification. Detection of the tumor is difficult because of-
1.Presence of noise (salt and pepper, Gaussian noise)
2.Overlapping of body organs (rib cage) 3.Presence of benign tissues.
4.Patient suffering from lung diseases (tuberculosis or cough)
5.Limitation of human visualization
In figure 5 shows the original chest X-ray image which is obtained after scanning. The Image is too bright to visualize and difficult to localized lung tumor.
Figure 5 Original image and its histogram
Volume 2, Issue 8, August 2013
Page 281
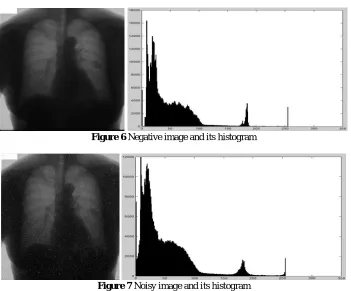
Figure 6 Negative image and its histogram
Figure 7 Noisy image and its histogram
Noisy image and its histogram are shown in figure 7. Salt and pepper noise contain a pixel value either 0 or 255. In the histogram long lines can be seen on 0 and 255 gray level. Filtered image and histogram in figure 8, shows that the number of pixels at 0 and 255 gray level value is reduced.
Figure 8 Filtered Image and its histogram
Filtering causes blurring and shifts the histogram slightly left. For overcoming the problem mean of the original image is calculated. Then the average of the pixel value of filtered image and the means is calculated. Calculation result is shown in figure 9 .
Volume 2, Issue 8, August 2013
Page 282
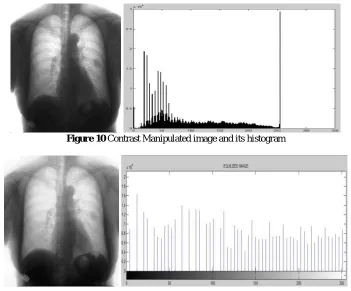
Figure 10 Contrast Manipulated image and its histogram
Figure 11 Histogram equalization image and its histogram
After doing averaging still some information is hidden. Contrast and histogram manipulation is used to improve the contrast and the luminance of the image. Now the image is enhanced and the segmentation techniques can be applied for the segmenting interested area. Figure 12 shows the threshold image. For segmenting image two thresholds are used.
Figure 12 Thresholding image
Volume 2, Issue 8, August 2013
Page 283
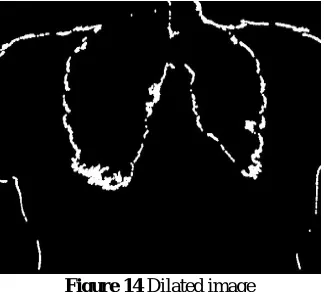
Figure 14 Dilated image
Figure 13 and 14 shows eroded and dilated image. These are the basic morphological operation. Thresholding shows interested area is attached with the rest of the unwanted structure. Erosion and dilation made it possible. Erosion reduces the size of the structure and dilation increase the size of the reduce structure. By doing this interested structure segment out from the rest of the structure.
Figure 15 Label Image
For separating the interested area from the rest of the unwanted structure label algorithm is used. In this algorithm each separated structure is represented by a number. By selecting this number interested area can be separate out. Figure 15 shown binary image and its structure are labeled with numbers. Figure 16 shows separated structure.
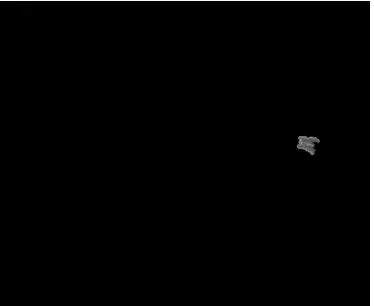
Figure 16 Segmented Suspicious Regions
Volume 2, Issue 8, August 2013
Page 284
Figure 17 Segmented image Superimposed on the original image
7.
ACKNOWELGMENT
We would like to express our deepest appreciation to the Japanese Society of Radiological Technology (JSRT) in cooperation with the Japanese Radiological Society (JRS) for providing clinically well proven images for research purpose.
8. CONCLUSION
In the digital image processing, a lot of research is carried for the precisely segmenting lung tumor from the X-ray image. Human errors and overlapping of mediastinum structure makes the task of segmentation difficult. The algorithm described in the paper is simple and easy to implement. These simple techniques are precisely segmenting suspicious region from the original image. Enhancement helps in bringing forward the useful important detail from the image by reducing irrelevant information. Further, feature extraction and classification techniques decided whether the segmented region is suspicious or not.
REFERENCE
[1] Robert H. Sherrier and G. A. Johnson, “Regionally Adaptive Histogram Equalization of the Chest” IEEE Transactions On Medical Imaging, vol. 6, no. 1, March 1987.
[2] G. A. Johnson and C. E. Ravin, "A survey of digital chest radiography," Radiol. Clin. North Amer., vol. 21, pp. 655-665, 1983.
[3] G. A. Johnson, N. Danieley, and C. E. Ravin, "Processing alternatives for digital chest imaging," Radiol. Clin. North Amer., vol. 23, pp. 244, 1985.
[4] R. G. Fraser, E. Breatnach, and G. T. Barnes, "Digital radiography of the chest: Clinical experience with a prototype unit," Radiology, vol. 148, pp. 1-5, 1983.
[5] M. Sonoda, M. Takano, J. Miyahara, and H. Kato, "Computed radiography utilizing scanning laser stimulated luminescence," Radiology, vol. 148, pp. 833-838, 1983.
[6] L. R. Goodman, W. D. Foley, C. R. Wilson, A. A. Rimm, and T.L. Lawson, "Digital and conventional chest images: Observer performance with film digital radiography system," Radiology, vol. 158, pp. 27-33, 1986.
[7] D. P. Chakraborty, E. S. Breatnach, M. V. Yester, B. Soto, G. T.Barnes, and R. G. Fraser, "Digital and conventional chest imaging: A modified ROC study of observer performance using simulated nodules," Radiology, vol. 158, pp. 35-39, 1986.
[8] Radhika sivaramakrishna, J. Scott Birbeck, Brent E. Higgs, and Robrt M. cothren, “Medical Computer-aided Detection of Lung cancer from Computed Tomography Images”, Technology review journal* Fall/ Winter 2002.
[9] J. H. M. Austin, B. M. Romney, and L. S. Goldsmith, “Missed bronchogenic carcinoma: Radiographic findings in 27 patients with a potentially resectable lesion evident in retrospect,” Radiology, vol. 182, pp. 115-122, January 1992
[10]Benjamin Y. M. Kwan And Hon Keung Kwan, “Improved Lung Nodule Visualization On Chest Radiographs Using Digital Filtering And Contrast Enhancement”, World Academy Of Science, Engineering And Technology, Issue- 60, pp-590-593, Dec 2011.
[11]Fabrizio Russo, “An Image Enhancement Technique Combining Sharpening and Noise Reduction”, IEEE Transactions On Instrumentation And Measurement, vol. 51, no. 4, August 2002
Volume 2, Issue 8, August 2013
Page 285
[13]S.Jayaraman and T.Veerakumar, “Digital Image Processing,” 3rd ed., New Delhi, India: Tata McGraw Hill, 2010, ch. 5, pp. 394-395.
[14]Rafael C. Gonzalez, and Richard E. Woods, “Digital Image Processing”,. 3rd edition, Prentice Hall, 2008, ch.10, pp.760-763.
[15]Rafael C. Gonzalez, and Richard E. Woods, “Digital Image Processing using MATLAB”,. 2nd edition, Prentice Hall, 2009.
[16]A.K. Jain, “Fundamental of Digital Image Processing,” Prentice Hall, Englewood Cliffs, NJ.1989.
AUTHOR
Manoj R. Tarambale was born in Jalgaon District, India, in 1970. He received graduate degree (B.E.) in Electrical Engineering from BVCOE, Pune-43, University of Pune, India, in 1992 and post graduate degree (M.E.) in Control System from WCOE, Sangli, Shivaji University, Kolhapur, India in 2002. Currently, he is pursuing his Ph.D. degree from PACIFIC University, Udaipur, India.
He has one year industrial experience and twenty years teaching experience. At present, he is Assistant Professor and Head of electrical engineering department of Marathwada Mitra Mandal’s College of Engineering, Pune-52, University of Pune, India. His main research interests are bio-medical image processing, electronic instrumentation, process control instrumentation and medical diagnosis.
Prof. Tarambale is a member of Institute of Engineers (India) and Indian Society for Technical Education (ISTE).
Nitin S. Lingayat was born in Shahapur (Thane), India in 1971. He received the B.E. degree in Electrical Engineering from the University of Poona, Pune in 1992 and the M.Tech degree from Indian Institute of Technology Bombay, Mumbai in 1998. He obtained Ph.D. degree in Electrical Engineering from J.N. Vyas University, Jodhpur, India in 2008. He is Head, Electrical Engineering Department, Institute of Petrochemical Engineering of Dr. Babasaheb Ambedkar Technological University, Lonere, Maharashtra (India) from January 2004. He has a teaching experience of twenty one years. His research interest includes biomedical signal and image processing, energy management, statistical signal processing, non-conventional energy sources etc.