www.ijtrd.com
Financial Performance Analysis of Selected
Micro-Finance Companies- A Camel Model Approach
1
Dr. Manpreet Kaur,
2Sunanda,
3Garima Tungal and
4Dr. Abhishek Pandey,
1,2,3,4
Assistant Professor, Commerce Department, Lovely Professional University, Punjab, India
Abstract: Microfinance called as micro credit, is a type of banking service that is provided to low-income individuals or groups who have no other access to financial services. While institutions participating in microfinance are most often associated with lending (microloans can be anywhere from $100 to $25,000), offer additional services including bank accounts and micro - insurance products and provide financial and business education. There are many aspects to measure the performance of MFIs like WACC, Regression Analysis and CAMEL Model is one important of them and thus it is being used in study to measure and compare the financial performance of leading four MFIs, based on highest gross loan portfolio in India for 3 years from 2015 -2017. The data is collected from annual reports of these MFIs and various ratios have been calculated measuring the aspects of CAMEL includes capital adequacy, asset quality, management efficiency, earning quality and liquidity.
Keywords: Microfinance, Financial Services, Financial Performance, CAMEL.
I. INTRODUCTION
Microfinance institutes: Microfinance institutions (MFIs) provide a range of financial services to poor households. Their
worldwide growth in numbers had a positive impact by providing the poor with loans, savings products, fund transfers and insurance facilities. This helped to create an encouraging socio-economic environment for many of developing countries households. The nature of these institutions is quite different from traditional financial institutions (such as commercial banks). MFIs are significantly smaller in size, limit their services towards poor households and often provide small collateral-free group loans. Most MFIs depend on donor funds and are not-for-profit oriented organizations that share a common bond among the members. They also differ in their two main operational objectives. First, as mentioned they act as financial intermediaries to poor households. Microfinance institutions (MFIs) are a special case in the financial world. They have a double financial and social role and need to be efficient at both.
MFIs are significantly smaller in size, limit their services towards poor households and often provide small collateral-free group loans. Most MFIs depend on donor funds and are not-for-profit oriented organizations that share a common bond among the members. They also differ in their two main operational objectives. First, as mentioned they act as financial intermediaries to poor households. Microfinance institutions (MFIs) are a special case in the financial world. They have a double financial and social role and need to be efficient at both. Microfinance is considered a tool for socio-economic development and can be clearly distinguished from charity.
SUPPORT OF MICROFINANCE INSTITUTIONS TO PEOPLE
Industry data from 2006 for 704 MFIs reaching 52 million borrowers includes MFIs using the lending methodology (99.3% female clients) and MFIs using individual lending (51% female clients). The delinquency rate for solidarity lending was 0.9% after 30 days (individual lending—3.1%), while 0.3% of loans were written off (individual lending—0.9%). Because operating margins become tighter the smaller the loans delivered, many MFIs consider the risk of lending to men to be too high. This focus on women is questioned sometimes, however a recent study of microentrepreneurs from Sri Lanka published by the World Bank found that the return on capital for male-owned businesses (half of the sample) averaged 11%, whereas the return for women-owned businesses was 0% or slightly negative.
It is argued that by providing women with initial capital, they will be able to support themselves independent of men, in a manner which would encourage sustainable growth of enterprise and eventual self-sufficiency. This claim has yet to be proven in any substantial form. Moreover, the attraction of women as a potential investment base is precisely because they are constrained by socio-cultural norms regarding such concepts of obedience, familial duty, household maintenance and passivity. The result of these norms is that while microlending may enable women to improve their daily subsistence to a steadier pace, they will not be able to engage in market-oriented business practice beyond a limited scope of low-skilled, low-earning, informal work. Studies have noted that the likelihood of lending to women, individually or in groups, is 38% higher than rates of lending to men.
The result is that microfinance continues to rely on restrictive gender norms rather than seek to subvert them through economic redress in terms of foundation change: training, business management and financial education are all elements which might be included in parameters of female-aimed loans and until they are the fundamental reality of women as a disadvantaged section of societies in developing states will go untested.
MICROFINANCE INSTITUTIONS IN INDIA
www.ijtrd.com
Microfinance is defined as, financial services such as savings accounts, insurance funds and credit provided to poor and low-income clients so as to help them increase their low-income, thereby improving their standard of living.
In this context the main features of microfinance are:
• Loan given without security
• Loans to those people who live below the poverty line
• Members of SHGs may benefit from micro finance
• Maximum limit of loan under micro finance Rs.25,000/-
• Terms and conditions offered to poor people are decided by NGOs
• Microfinance is different from Microcredit- under the latter, small loans are given to the borrower but under microfinance alongside many other financial services including savings accounts and insurance. Therefore, microfinance has a wider concept than microcredit.
In June 2014, CRISIL released its latest report on the Indian Microfinance Sector titled "India's 25 Leading MFI's. This list is the most comprehensive and up to date overview of the microfinance sector in India and the different microfinance institutions operating in the sub-continent.
MICRO FINANCE MODELS IN INDIA
A wide range of microfinance models are working in India. India host the maximum number of microfinance models. Each model has succeeded in their respective fields. The main reason behind the existence of these models in India may be due to geographical size of the country, a wide range of social and cultural groups, the existence of different economic classes and a strong NGO movement. Micro Finance Institutions in India have adopted various traditional as well as innovative approaches for increasing the credit flow to the organized sector. They can be categorized into six types.
1) Grameen model 2) SHG model
3) Federated SHG model 4) Cooperative Model 5) ROSCA
6) Micro-finance companies (MFCs)
II. REVIEW OF LITERATURE
Dar & Presley (2000): examined and broke down the third zone about camel model (i.e. management What's more control over internal governance about banks What's more money related organizations). Those microfinance institutions and monetary organizations of Muslim universe need aid though not seriously about. They found that those a nonattendance of right parity between administration controls privileges may be that real reason for the absence of benefit. In different produced countries, Bangladesh bank acquainted camel rating framework to 1993. Similarly, as an essential analytics and only offsite supervision framework.
Tucker and Miles (2004): studied that MFIs can be sustainable by either moving up the interest on loan, commissions or both the two. But Increasing the costs for customers probably increases the default rate. Increase in the cost of loan might not benefit the low-income house hold rather subject them to been marginalized. In their study, it was mentioned that microfinance institutions use the CAMELS technical note in their financial reporting.
Satta (2006) studied the performance evaluation of small firms financing schemes with a view to assessing their potential for improving small firms’ access to finance. It measured financial performance in terms of net loans to total assets, non-financial investment to total assets, written of loans, ROA.
Srinivasan et al. (2006) studied that Microfinance has been attractive to lending agencies because of demonstrated sustainability and low cost of operations. In India, the engagement of NABARD and SIDBI shows that they saw long-term prospect for this sector. The study shows the growth and opportunities for MFIs in India
Ayayi and Sene (2010) conducted research on 223 MFIs and revealed that credit risk management was determining factor for financial performance. It stated it was important to control cost. Interest rate had to be reasonably high to cover cost. In addition, they discovered that use of relevant information and good banking practices and information systems facilitate sustainability.
Mishra and Kumari (2011) selected 12 public and private sector banks on the basis of market capture and measured the efficiency and soundness by Camel Model. From the analysis they ranked the banks. They said that HDFC takes the lead followed by ICICI and Axis Bank. Bank of Baroda and Punjab National Bank follows the fourth position held by IDBI and Kotak Mahindra Bank. Public Sector Banks like SBI and Union Bank takes the back seat. It donates that Private Sector Banks are performing better than Public Sector Bank.
Kumar (2012) has given a definition to camel rating system, according to him it is a mean to categorize bank based on the overall health, financial status, managerial and operational performance. In his study he has chosen the SBI and its associates for checking the performance and concludes that State Bank of India is always in the lead than its associates in every aspect of camel.
www.ijtrd.com
performer is united bank of India because of management inefficiency, low capital adequacy and poor assets and earning quality. Central bank of India is at last position followed by UCO bank and bank of Maharashtra.
Dr. Mahua Biswas (2013): Measured and evaluated the performance of two public sector banks viz., Andhra Bank and Bank of Maharashtra with CAMEL model for a period of 2011-2013have been collected from the annual reports of the banks and Twenty variables as supported by the existing literature related to CAMEL model are used in the study.
Chaudhary (2014) conducted a study to measure the right performance of public and private sector banks by the use of secondary data collected from annual reports, periodicals, website etc. for the year 2009-2011 and found out that in every aspect private sector bank has performed better than public sector banks and they are growing at faster pace.
Hoti and Alshiqi (2014) need to analyse the financial performance of the Banking system in Kosovo from 20062012 using camel model and by calculating return on investment. They concluded that they did not find any significance difference in the overall performance of the banks and this thing can only happen in the times of global financial crisis which was earlier faced by Kosovo, letting less sensitive effect. Most banks were found with health balance sheet with a small level of reserves for loans.
Deutsche Financial Systems Development and Banking Services (2017): summarized some of the tools and approaches used by conventional financial institutions and suggested ways in which MFIs might further adapt and innovate to create the optimal risk management culture within their own organizations by using US Federal Reserve’s CAMELS analysis, citing Capital adequacy, Asset quality, Management quality, Earnings quality, Liquidity, and Sensitivity to interest rates.
Muralidharan and Lingam (2017): measured and evaluated the financial performance of 5 banks from 20072016 namely Bank of Baroda, Punjab National Bank, Central Bank of India, Bank of India and Bank of Maharashtra. They gave ranking to all five banks based on each ratio.
III. RESEARCH METHODOLOGY
1. RESEARCH DESIGN
The study is quantitative in nature and a descriptive research based on secondary data to Evaluate the Financial Performance of Top 4 Microfinance Institutes based on Gross Loan Portfolio using the CAMEL model approach. The Top 4 MFIs were selected from the Micrometre Issue Q2 FY2017-18(Government of India).
2. POPULATION AND TARGET UNIT
The target units are the Top 4 MFIs selected on the basis of highest Gross Loan Portfolio given by Micrometre Issue Q2FY 2017-18, issued by Government of India.
3. SAMPLING TECHNIQUE
The sampling technique used for research is convenient sampling technique. It is sampling technique where objectives are selected because of their convenient accessibility and proximity to the researcher.
4. SAMPLE SIZE
The MFIs that have Highest GLP have been selected for the study. Therefore, the sample size of 4 MFIs namely:
• Bharat Financial Inclusion Limited
• MuthootMicrofinance
• Satin Credit care
• GrameenKoota
5.SAMPLING METHOD- SOURCE OF DATA COLLECTION
As the study is based on secondary data, the whole data will be collected from annual reports, , Money control& other websites available for financial data.
6.STATISTICAL TOOLS AND TECHNIQUES USED FOR THIS ANALYSIS
CAMEL ratio analysis will be used to determine and compare the performance of the 4 MFIs and would be ranked accordingly.
7.OBJECTIVES OF THE STUDY
• To analyse the financial performance of MFIs.
• To analyse and compare the MFIs based on their performance for 3 years.
• To rank the MFIs based on each ratio.
8.THE LIST OF THE MFIS WHICH HAVE HIGHEST GROSS LOAN PORTFOLIO ARE LISTED BELOW
Serial No. Name of the Company
1 Bharat Financial Inclusion Limited
2 Muthoot Microfinance
3 Satin Creditcare
4 GrameenKoota
www.ijtrd.com
The above MFIs are to be analysed for the study and the secondary data is to be collected from the various financial sites and for this purpose no questionnaire is required to be made or filled up.
9. PARAMETERS FOR MEASURING FINANCIALPERFORMANCE
CAMEL Model has been used to conduct the Research.
10. NEED OF THE STUDY
• There are very few literatures that have captured the financial performance of MFIs in India to judge their performance in financial viability leading to proper outreach to the population.
• No study has been done so far on Financial Performance of MFIs based on the highest Gross Loan Portfolio.
IV. CAMEL APPROACH
The CAMELS rating system is a recognized international rating system that bank supervisory authorities use in order to rate financial institutions according to six factors represented by the acronym "CAMELS‖. The acronym "CAMEL" refers to the five components of a MFI’s condition that are assessed: Capital adequacy, Asset quality, Management, Earnings, and Liquidity. A sixth component, a MFI's Sensitivity to market risk was added in 1997; hence the acronym was changed to CAMELS.
1. CAPITAL ADEQUACY: The CAMEL analysis looks at the institution’s ability to raise additional equity in the case of losses, and its ability to establish reserves against the risks inherent in its operations. Other factors involved in rating and assessing an institution's capital adequacy are its growth plans, economic environment, ability to control risk and loan and investment concentrations.
• CRAR = Capital/ Total Risk Weighted Credit Exposure
• Debt Equity Ratio=Borrowings/ (Share Capital + reserves)
• Total Advance to Total Asset Ratio= Total Advances/ Total Asset
2. ASSET QUALITY: This helps in analyzing the level of portfolio at risk and write-offs the existence and application of credit policies and procedures. It results, how companies are affected by fair market value of investments when mirrored with the company's book value of investments.
Gross NPA Ratio= Gross NPA/ Total Loans
Net NPA Ratio= Net NPA/Total Loan
3. MANAGEMENT QUALITY: This component governs the general management, human resource policy, management information systems (MIS), internal control and auditing. It covers the management's ability to ensure the safe operation of the institution as they comply with the necessary and applicable internal and external regulations.
• Business Per Employee= Total revenue/ No. of Employees
• Profit per employee= Net profit/ No. of Employees
• Return On Net Profit= Net Income/ Revenue
• Net Profit to to Total Asset= Net Income/ Total Asset
• Percentage Change in Net Profit= (Current year NP-Previous year NP)/ Previous Year Net Profit X 100
4. EARNINGS EFFICIENCY: The key components of revenues and expenses are analyzed, including the level of operational efficiency and the institution’s interest rate policy, as are the overall results as measured by return on equity (ROE) and return on assets (ROA).
• Dividend Payout Ratio= Dividend/ Net Profit
• Interest Income to Total Income= Interest Income/ Total Income
• Other Income to Total Income= Other Income/ Total Income
• Return on Assets= Net Profit/ Total Assets
5. LIQUIDITY MANAGEMENT: The liability structure of the institution and the productivity of its current assets are also important aspects of the overall assessment of an institution’s liquidity management. Availability of assets which can easily be converted to cash, dependence on short-term volatile financial resources can also help in judging the liquidity position of a company.
• Current Ratio= Current Assets/ Current Liabilities
• Quick Ratio= Quick Assets/ Current Liabilities
• Liquid Asset to Total Asset= Liquid Assets/ Total Assets
V. DATA ANALYSIS AND INTERPRETATION1.CAPITAL ADEQUACY
(a). Capital Adequacy Ratio:
Sr. No. MFI 2017 2016 2015 Avg Rank
1 BFIL 33.50% 23.10% 31.70% 29.43% 1
2 Muthoot Microfin 24.48% 24.48% 24.78% 24.58% 3
www.ijtrd.com
4 GK 29.70% 21.47% 28.14% 26.44% 2
Interpretation: All the four MFIs namely BFIL, MuthootMicrofin, Satin Creditcare and GK have CRAR with 29.43%, 24.58%,
18.88%, 26.44%. Though, BFIL has highest ranking in CRAR in Basel II. On the other hand, Satin Creditcare has taken the last positions with CRAR 18.88%, which is the least. So, Satin does not have much capacity to adapt to its losses.
(b). Debt-Equity Ratio:
Sr. No. MFI 2017 2016 2015 Avg Rank
1 BFIL 2.85 3.32 3.83 3.333333 3
2 Muthoot Microfin 1 2.45 1.53 1.66 1
3 Satin Creditcare 2.9 3.7 3.1 3.233333 2
4 GK 3.05 4.11 4.06 3.74 4
Interpretation: Muthoot Microfin secures first position in Debt-Equity ratio with 1.66 followed by Satin Creditcare with 3.23.
BFIL and GK stand at last with average of 3.33 and 3.74 times. It means that the creditors and depositors of Muthoot Microfin and Satin Creditcare are more secured as they are using less debt than other 2 MFIs. Whereas, Creditors and Depositors of BFIL and GK are at higher risk as they are focusing more on Debt than the shareholder’s wealth and GK stays last with the highest risk and by Debt-Equity Ratio of 3.74.
(c). Total Advances to Assets ratio:
Sr. No. MFI 2017 2016 2015 Avg Rank
1 BFIL 0.71 0.702 0.63 0.68 4
2 Muthoot Microfin 0.89 0.9 0.76 0.85 1
3 Satin Creditcare 0.67 0.69 0.73 0.69 3
4 GK 0.86 0.87 0.78 0.83 2
Interpretation: Muthoot Microfin has got the highest position in advances to assets ratio by 85% followed by Grameen Koota
with 83%, Whereas Satin Creditcare and BFIL holds the last positions with 69% and 68%. All the MFIs have a good lending policy. But Muthoot Microfin and GK has adopted a better lending policy than other banks because there ratios are higher, which will definitely increase the profits of the MFIs.
2. ASSET QUALITY
(a). Gross NPA Ratio:
Sr. No. MFI 2017 2016 2015 Avg Rank
1 BFIL 6% 0.10% 0.10% 2.07% 3
2 Muthoot Microfin 6% 7.20% 5.11% 5.98% 4
3 Satin Creditcare 0.41% 0.20% 0.03% 0.21% 2
4 GK 0.08% 0.08% 0.06% 0.07% 1
Interpretation: GK stands at the first position with its gross NPA at 0.07%. This shows that GK is the most efficient in managing
its advances and collection properly. The last spot is taken by Muthoot Microfin with its average Gross NPA 5.98%. Satin Creditcare occupies the second and BFIL the forth position. The lesser the Gross NPA ratio is ,the better it is for the MFIs.
(b). Net NPA Ratio:
Sr. No. MFI 2017 2016 2015 Avg Rank
1 BFIL 2.70% 0.00% 0.00% 0.90% 3
2 Muthoot Microfin 1.69% 2.46% 1.88% 2.01% 4
3 Satin Creditcare 0.22% 0.09% 0.02% 0.11% 2
4 GK 0.00% 0.00% 0.00% 0.00% 1
Interpretation: The smaller the ratio is, the better the performance of MFI. GK tops the chart with its Net NPA being 0%. Next in
line is Satin followed by BFIL and Muthoot Microfin respectively. Muthoot Microfin should watch its increasing NPA as it impacts the profitability of the company and also the Return on assets.
3. MANAGEMENT EFFICIENCY
www.ijtrd.com
Sr. No. MFI 2017 2016 2015 Avg Rank
1 BFIL 0.90 5.20 5.30 3.8 2
2 Muthoot Microfin 3.84 3.32 2.50 3.22 3
3 Satin Creditcare 15.9 22.4 19.1 19.13 1
4 GK 2.3 0.046 0.04 0.79 4
Interpretation: Satin is at the peak with 19.13% of Return on Net worth followed by BFIL with 3.8%. It means that Satin and
BFIL are earning good amount of profits from the capital they invested in fixed assets. The higher the return the more products and efficient management is in utilizing economic resources, where as Muthoot and Gk has least rate of return with 3.32% and 0.79%.
(b). Profit per Employee:
Sr. No. MFI 2017 2016 2015 Avg Rank
1 BFIL 196067.8 252674.1 193508.3 214083.4 2
2 Muthoot Microfin 487350.4 355363.3 293035.6 378583.1 1
3 Satin Creditcare 35454.71 147882.9 127067 103468.2 4
4 GK 151969 218451.4 186064 185494.8 3
Interpretation: Higher the Profit Per employee, better is it for the employees and company. Muthoot Finance stands at first
position with profit per employee of 3.78 lakhs followed by BFIL with 2.14 lakhs and GK with 1.85 Lakhs. It states that employees of Muthoot Micro Finance are earning good amount of profits than other four banks. Whereas, employees of GK and Satin are earning least amount of profits with 1.85 lakhs and 1.03 lakhs.
(c). Business per employee:
Sr. No. MFI 2017 2016 2015 Avg Rank
1 BFIL 1169479 1101387 828073.45 1032980 4
2 Muthoot Microfin 1895181 2139948 1895181 1976770 1
3 Satin Creditcare 1123975 1425526 1298701 1282734 2
4 GK 1432272 1216998 1058796 1236022 3
Interpretation: Higher the business per employee, higher is the productivity of the human resources. The above table shows that
Muthoot Micro Finance and Satin stands at leading positions in case of business per employee i.e. having a good amount of business per an individual worker with average of 19.76 lakhs and 12.82 lakhs . It means that human resources of these both banks is more efficient. Whereas, BFIL stands at last with a low business per employee of 10.32, which is lower than other three banks. The efficiency and productivity of employees of State Satin is quite low.
(d). Net Profit to Total Asset:
Sr. No. MFI 2017 2016 2015 Avg Rank
1 BFIL 0.90% 5.20% 5.30% 3.80% 2
2 Muthoot Microfin 3.84% 3.32% 2.50% 3.22% 3
3 Satin Creditcare 15.90% 22.40% 19.10% 19.13% 1
4 GK 2.30% 0.05% 0.04% 0.80% 4
Interpretation: Higher the net profit, better is the earning potential of the MFI. The above table shows that Satin is leading in net
profit to assets ratio with 19.13 followed by BFIL with 3.22. It means that both the MFIs are earning good amount of return o n their assets. Whereas, the condition for Muthoot Micro Finance and GK is poor.
(e).Percentage Change in Net Profit:
Sr. No. MFI 2017 2016 2015 Avg Rank
1 BFIL 101.6 87.83 69.32 86.25 2
2 Muthoot Microfin 112.56 91.83 57.32 97.23 3
3 Satin Creditcare 201.55 172.85 79.28 151.22 4
4 GK 9.26 11.3 9.14 9.9 1
Interpretation: A lot of fluctuation have been found in the Net profits of all the three MFIs except GK for three years but there
www.ijtrd.com
4. EARNING CAPACITY(a). Interest Income / Total Income:
Sr. No. MFI 2017 2016 2015 Avg Rank
1 BFIL 0.03% 1.18% 0.09% 0.43% 2
2 Muthoot Microfin 0.03% 0.02% 0.03% 0.03% 4
3 Satin Creditcare 0.79% 0.76% 0.82% 0.79% 1
4 GK 0.38% 0.37% 0.42% 0.39% 3
Interpretation: Interest income is the difference between the revenue that is generated from a MFI's assets and the expenses
associated with paying out its liabilities so here in this case it is observed that Satin stands in the 1st position with the average of 0.79%, so that satin is earning good interest and followed by BFIL is in next position with 0.43% and in 3rd position GK is t here and at last in the final position. Muthoot micro finance is there and the interest rate is very less in muthoot with average of 0.03%.
(b). Dividend Payout Ratio:
Sr. No. MFI 2017 2016 2015 Avg Rank
1 BFIL 100% 0% 0% 33.33% 1
2 Muthoot Microfin 0% 0% 0% 0% 2
3 Satin Creditcare 0% 0% 0% 0% 2
4 GK 0% 0% 0% 0% 2
Interpretation: This table shows the how much dividend they are paying to his shares holders so from the above table it concludes
that only one company which has given 100% that is BFIL only in the year of 2017 and also concludes that remaining three companies that is Muthoot, Satin and GK have not issued any dividend to his share holders all these companies are retaining profit as these companies are not listed in the stock exchange of India.
(c). Other Income / Total Income
Sr. No. MFI 2017 2016 2015 Avg Rank
1 BFIL 0.10% 1.18% 0.09% 0.46% 1
2 Muthoot Microfin 0.00% 0.00% 0.00% 0.00% 4
3 Satin Creditcare 0.02% 0.01% 0.00% 0.01% 3
4 GK 0.01% 0.02% 0.04% 0.02% 2
Interpretation: Other income is the income which company is receiving from other business so here in the above table it can be
said that BIFL stands in 1st position as it is having average income of 0.46% and followed by GK with 0.02% and in the 3rd position it is satin with 0.01% and in the last position it is Muthoot Micro finance with 0.0% there is no other income in Muthoot.
5. LIQUIDITY
(a). Current Ratio
Sr. No. MFI 2017 2016 2015 Avg Rank
1 BFIL 1.62 1.88 1.67 1.723 3
2 Muthoot Microfin 1.66 1.84 1.89 1.796 2
3 Satin Creditcare 2.43 2-18 1.82 2.143 1
4 GK 1.71 1.62 0.79 1.373 4
Interpretation:Current ratio is a useful test of the short-term-debt paying ability of any business. A ratio of 2:1 or higher is
considered satisfactory for most of the companies. Satin stand in the 1st position with average current ratio of 2.14 which is above 2 so it is good and next Muthoot Micro Finance in 2nd position with 1.79 and followed by BIFL with 1.72 and in the last position GK stands with the least ratio of 1.37.
(b). Quick Ratio
Sr. No. MFI 2017 2016 2015 Avg Rank
1 BFIL 1.62 1.88 1.67 1.723 2
www.ijtrd.com
3 Satin Creditcare 2.43 2-18 1.82 2.143 4
4 GK 1.71 1.62 0.79 1.373 1
Interpretation: Quick ratio is considered a more reliable test of short-term solvency than current ratio because it shows the ability
of the business to pay short term debts immediately, Generally a quick ratio of 1:1 is considered satisfactory and in the above table we can see that Satin stand in the 1st position with an average of 2.14 and both Muthoot Micro finance and BFIL are with the average of 1.74 and 1.72 and at last we can see that GK stands in the last position with 1.37.
(c). Liquid asset to Total Asset:
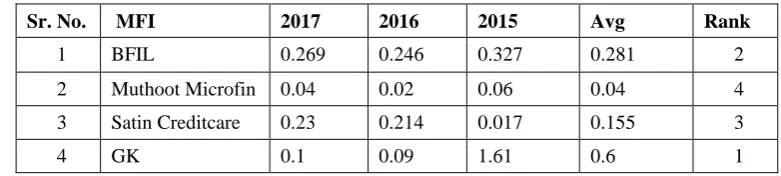
Sr. No. MFI 2017 2016 2015 Avg Rank
1 BFIL 0.269 0.246 0.327 0.281 2
2 Muthoot Microfin 0.04 0.02 0.06 0.04 4
3 Satin Creditcare 0.23 0.214 0.017 0.155 3
4 GK 0.1 0.09 1.61 0.6 1
Interpretation: A company with higher liquid assets is able to pay its obligation easily when due. Comparing the above mentioned
MFIs, GK stands at the first spot with 60% as Liquid assets and thus has ability to pay off its obligations. But this also means blocking a lot of funds in liquid asets and represents mismanagement. BFIL has the best liquid asset ratio i.e. 28%. MuthootMicrofin and satin Creditcare have less liquid assets. Satin bags the third position with 15% liquid assets and Muthoot the last spot with only 4% of liquid assets available and thus sounds very risky to the lenders and creditors.
LIMITATIONS
• The study can further be made more extensive by taking a larger sample size.
• The time period taken for study can also be widen so as to have a deep insight of the objectives.
• Secondary Data is sometimes not available.
SUGGESTIONS
a. BFIL:
1. Needs to lower its debt and increase its advances to maintain good profitability.
2. Should increase its efficiency and management and lower its NPA.
b. Muthooth Microfin
1. Needs urgent measures to control its NPA.
2. The aggressive lending has increased its NPA, thus should have stringent rules while giving advances.
c. Satin Creditcare
1. Overall performance of Satin Creditcare is satisfactory but it is blocking lot of funds in case of quick ratio and liquid ratio.
2. The liquidity position of Satin Creditcare needs to be checked and monitored efficiently.
d. Grameen Koota
1. This company is not capitalizing on financial leverage and thus the pitfalls can be seen in its profitability.
2. GrameenKoota should manage its debt- equity ratio so as to earn good profits and increase its revenue and earning capacity.
CONCLUSION
The study was conducted to check the Financial Performance of selected MFIs in India. The CAMEL Model Approach was adopted for the same. The CAMEL model approach is appropriate to analyze and judge the performance of any financial institution as it helps to check the Capital quality, asset quality, management efficiency, earning capability and liquidity position. The Analysis and Performance has been checked the same and also suggestions have been given for the same to improve the MFIs.
References
[1] Aspal P.K. (2013), ―A Camel Model Analysis of State Bank Group‖, World Journal of Social Sciences, Vol.3, No.4 accessed from www.econjournals.com /index.php/ijefi/ article/view file /814 /pdf on 20-Sept-2014.
[2] Aspal P. K., & Malhotra, N. (2013), ―Performance Appraisal of Indian Public-Sector Banks‖. World Journal of Social
Sciences.
[3] Biswas, D. M. (2013), ―Performance Evaluation of Andhra Bank & Bank of Maharashtra‖.
[4] Choudhary, G. (2014), ―Performance Comparison of Private Sector Banks with the Public-Sector Banks in India‖,
International Journal of Emerging Research Management & Technology.
[5] Desai D.S. (2013), ―Performance Evaluation of Indian Banking Analysis‖, International Journal of Research in
Humanities and Social Sciences, ISSN: 2320-771x, Vol. 1, No. 6 accessed from raijmr.com/wp
www.ijtrd.com
[6] Deutsche Financial Systems Development and Banking Services (2014), ―Risk Management in Micro-Finance
Institutions” from www.grameenkootamicrofinance.com (2017, October).
[7] Kumar M.A. (2012), ―Analysing Soundness in Indian Banking: A Camel Approach‖, Research Journal of Management
Sciences, ISSN: 2319–1171, Vol. 1.
[8] Lakhtaria N. J. (2013), ―A Comparative Study of the Selected Public-Sector Banks through Camel Model‖, Indian
Journal of Research, Vol. 2, and No. 4 accessed from
theglobaljournals.com/paripex/file.php?val=April_2013...113f4... on 22-Sept-2014
[9] Mishra M.K. (2011), ―Comparative Study of Public and Private Sector Banks in India: Analysis of Camel and DEA Approach‖, International Academic Research Journal of Economics and Finance, ISSN: 2227-6254 Vol. 3, No. 1 accessed from acrpub.com
[10] Muralidhara, p., & Lingam, C. (2017), ―Camel Model as an Effective Measure of Financial Performance of Nationalised Banks‖, l Journal of Pure and Applied Mathematics.
[11] Sangmi M. (2010), ―Analysing Financial Performance of Commercial Banks in India: Application of Camel Model‖, Pak.
J. Commerce. Soc. SCI, Vol.4, No.1 accessed from www.jespk.net/publicat ions/28.pdf on 23-Sept2014.
[12] Srinivasan R. and Sriram, M.S. (2006), ―Microfinance in India: Discussion‖, IIMB Management Review, pp.6686. World Bank (2000), World Development Report 2000/2001, Washington DC.