aAssoc. Prof., PhD., Uludag University, Faculty of Economics and Administrative Sciences, Department of Business Administration, Bursa, Turkiye, dalper@uludag.edu.tr
Abstract:One of the most important factors in national economic development is the vigorous operation of financial markets. The vigorous function of financial markets depends on the operations of financial institutions such as stock exchange, banks, leasing and factoring companies in these markets. In recent years, the status and significance of factoring companies as non-bank financial institutions have been increased, especially in providing financing for the SMEs. In the present study, the financial performance of factoring companies in Istanbul Stock Exchange was assessed and multi-criteria decision making techniques ELECTRE and TOPSIS, were implemented. More objective and accurate assessments could be achieved with multi-criteria decision making techniques, ELECTRE and TOPSIS, which are used when multiple evaluation factors are present. For this purpose, six factoring companies were selected and the financial statement ratios for each company were used as evaluation criteria. The calculated financial ratios and financial ratio weights were included in analyses conducted with both methods and Yapı Kredi Factoring was determined as the factoring company with the best performance as a result of conducted ELECTRE and TOPSIS analyses.
Keywords: Financial Performance, ELECTRE, TOPSIS, Factoring Industry, Financial Ratios JEL Classification: G29, L25,M21
1. Introduction
Factoring is a method where future domestic and foreign receivables of a company is assigned and guaranteed by the factoring company along with receivable and collection management services for the goods and services sold by the abovementioned company. In short, factoring is the process of selling commercial receivables to raise funds. In factoring transactions, which are regarded as an important source of financing for vendors in commercial life, short-term receivables that arise from the purchase and sale of goods and services are transferred to institutions called factoring companies. Factoring companies involved in this process are financial institutions specialized in the purchase of business receivables. The financial performance of the companies that carry out the factoring transactions, which is a very important financial technique that companies use to raise funds today, would affect their funding capacities and services they provide. Thus, the measurement of the financial performance of factoring companies is of special importance.
Değer Alper
aCanan Başdar
bBusiness and Economics Research Journal
Volume 8
Number 3
2017
pp. 627-646
ISSN: 1309-2448 DOI Number: 10.20409/berj.2017.70Multi-criteria decision making methods are extensively used in solving decision making problems, which is the process of choosing the optimal one among other alternatives. Among various alternatives, decision making process is defined as the selection of the appropriate one in our objectives. The process is encountered in every aspect of our daily lives. Due to the presence of more than one objective in decision making level and the continuous increase of the alternatives, multiobjective decision making methods are being used in almost all areas. Determining the financial performance of the enterprises and choosing the best performance is also considered as a decision making problem. As a result of literature studies, it has been found out that the most widely used multi-criteria decision making techniques in terms of applicability and interpretation are ELECTRE and TOPSIS methods. Therefore, these two methods have been chosen as study subjects.
The main objective of this study is to show the applicability of the ELECTRE and TOPSIS methods of multi-criteria decision making techniques as well as the finding of the best performance of the factoring companies in accordance with the criteria determined by the multi-criteria decision making methods ELECTRE and TOPSIS.
In the ELECTRE method, superiority relationships are determined by making binary comparisons between the alternatives provided that they are separately for each criterion. As a result of the binary comparisons made, the best performing alternative is chosen. In the TOPSIS method, instead of binary comparison, the distances of all alternatives from the positive and negative ideal solutions are calculated. In this approach, it is desirable that the selected alternative be the closest distance to the positive ideal solution. In other words, the positive ideal solution is the nearest alternative and the negative ideal solution is the farthest alternative.
In this study, information about the factoring sector will be given first. Literature study will be done by analyzing the studies related to the application of the ELECTRE and TOPSIS method in financial performance analysis and the factoring companies. In the fourth section, the information about the financial ratios used in the performance analysis will be explained and then the methods of ELECTRE and TOPSIS will be explained in the fifth and sixth sections. In the application section, the performances of the firms in the sector will be assessed first by TOPSIS methods after the ELECTRE and finally the results and evaluation studies will be done.
2. Factoring Industry
Factoring is the process where the domestic or foreign receivables of the businesses that sell on credit are purchased by entities called "factor or factoring companies". This is a financing method that allows businesses to raise funds since receivables are collected before the due date. (Ceylan, 2008: 2).
Thus, the cash flow which is extremely important for the enterprises becomes uninterrupted, the raw material purchases are facilitated, providing sufficient working capital, and it is possible to increase the production and sales volume since the possibility of term sales increases. With the increase in production and sales volume, the volume of funds available for the business that benefits from the factoring technique improves. The advantages that factoring method provides to businesses could be summarized under three topics: guarantee, collections and accounting, and financing. (Aydın, Başar and Coşkun, 2011: 159). With the factoring method, short-term funding is provided within the context of factoring contracts while the credit inspections, market research, receivables monitoring, collection and guarantee (undertaking credit risk), and accounting are conducted by the factoring company.
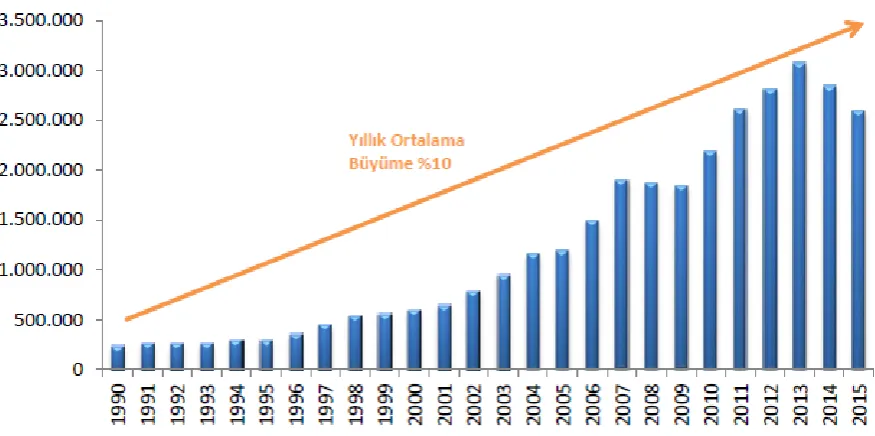
factoring is a useful method for financing domestic and foreign short term receivables. The growth and turnover figures in the factoring industry worldwide are presented in Graph 1 and Table 1.
Graph 1. Development of the Global Factoring Industry (USD millions
Table 1. Global Factoring Turnover 2002-2015 (USD - millions)
Resource: https://www.fkb.org.tr/Faktoring_Sector (Accessed on 23.03.2017)
Factoring operations began in 1988 in Turkey with the establishment of a department in Iktisat Bank called Iktisat Bank Factoring Group. İktisat Bank Factoring Group became a member of FCI immediately in 1988, and incorporated as FactoFinans Alacak Alımı A.Ş. and followed by Aktif Finans Factoring A.Ş. and by several other companies in a very short time. In the beginning, these institutions, which were almost exclusively engaged in international factoring transactions, have also started to conduct domestic factoring operations due to the pressures of profit brought by the incorporation (Uyanık, 2015: 23).
Factoring is rooted in the abovementioned developments in Turkey in the 1980's and has a great potential. According to the current Banking Regulation and Supervision Agency (BDDK) data, 61 corporations
were designated as factoring companies in Turkey (BDDK, 2017). According to the information provided by Public Disclosure Platform (KAP), 7 factoring corporations are listed in Borsa İstanbul (BIST). These companies include Başer Factoring, CreditWest Factoring, Garanti Factoring, Huzur Factoring, Lider Factoring, Sumer Factoring and Yapı Kredi Factoring (KAP, 2017).
The fast growing factoring sector under the supervision of the Banking Regulation and Supervision Agency since 2006 has always aimed to create added value for the Turkish economy. The chart below shows the growth in the factoring sector turnover in Turkey.
Graph 2. Development of Turkish Factoring Industry Turnover (USD - millions)
Table 2. Turkish Factoring Industry Turnover between 2002-2016 (USD - millions)
Resource: https://www.fkb.org.tr/Faktoring_Sector (Accessed on 23.03.2017)
Annual Average Growth 32%
Total
Overseas Domestic
3. Literature Review
Certain previous studies conducted with TOPSIS and ELECTRE methods are presented in Table 3.
Table 3. Certain studies conducted with TOPSIS and ELECTRE methods
Project Assessment-Electre (Nijkamp, 1975: 87-111)
Site of Establishment Selection-Electre (Roy and Bouyssou,1986: 200-215),
(Akyüz and Soba, 2013: 185-190)
Performance Assessment-Topsis (Yurdakul and İç, 2003: 1-18), (Demireli, 2010: 101-112), (Özgüven, 2011: 151-162), (Türkmen and
Çağıl, 2012: 59-78), (Ömürbek and Kınay, 2013:
343-363)
Case Study-Electre (Huang and Cheng, 2005: 2237-2249)
Personnel Selection -Topsis (Shih, et al., 2007: 801-8013)
Project Selection -Topsis (Mahmoodzadeh et al., 2007: 135-140)
Assessment of Transportation Investments -Electre
(Karacasu, 2007: 155-164)
Solidwaste Management System - Electre (Özkan, 2008)
Attack Helicopter Selection -Electre (Yürekli, 2008)
Gas Station Dealership Selection - Electre (Montazer et al., 2009: 10837-10847) Supplier Selection -Topsis (Supçiller and Çapraz, 2011:1-22), (Önder and Dağ,
2013: 56-74)
Cutting Tool Material Selection -Topsis (Çalışkan et al., 2012: 35-42)
Scholarship Student Selection -Topsis (Abalı et al., 2012: 259-272)
Digital Camera Selection -Topsis (Pawar and Verma, 2013: 51-53)
Bank Location Selection-Electre (Soba, 2014: 459-473)
Accounting Software Selection -Electre (Tunca et al., 2015: 53-71)
Yurdakul and İç (2003: 1-18) conducted a study to evaluate corporations using the financial ratios (current ratio, stock turnover, current liabilities/total liabilities, gross sales margin/net sales, net operating profit / net sales, net sales per capita) calculated for five large-scale automotive companies in Turkey that were traded in Istanbul Stock Exchange (IMKB). In the first section of the study, financial ratios used for performance measurement were discussed and the calculated company financial ratios were presented. In the second section, the calculated ratios are translated into a single score indicating general company performance using the TOPSIS method, one of the Multiple Criteria Decision Making Methods.
Demireli (2010: 101-112) attempted to determine the performances of popular public banks using the TOPSIS method. The most common ratios utilized in the literature for the measurement of financial performance and used for the TOPSIS method were used in this study: Equities / Total Assets, Total Credit / Total Assets, Non-Performing Loans (net) / Total Credit, Fixed Assets / Total Assets, Liquid Assets / Total Assets, Liquid Assets / Current Liabilities, Net Profit (Loss) for Financial Year / Total Assets, Net Profit (Loss) for Financial Year / Equity, Net Interest Income / Total Assets, Net Interest Income / Total Operating Income. In the study, it was determined that public banks were affected by local and global financial crises, their performance scores fluctuated and no remarkable improvement was observed in the sector.
increasing store numbers, prioritizing customer relationships and increasing product diversity, retail performance could be improved.
Turkmen and Cagil (2012: 59-78), using the financial statements of twelve information industry companies traded in the Istanbul Stock Exchange (IMKB), evaluated the corporate financial performances using TOPSIS, a Multiple Criteria Decision Making Technique. In the study, the method was implemented using eight financial ratios calculated for four periods (2007-2010) (current ratio, liquidity ratio, accounts receivable turnover rate, total asset turnover rate, leverage ratio, net profit margin, equity profitability, total asset profitability) and the performance ratings of the companies were determined based on the results.
Ömürbek N. and Kinay (2013) conducted a similar study by comparing the financial performances of the two airlines traded in Borsa Istanbul and Frankfurt Stock Exchange.
A limited number of studies have been conducted in domestic and foreign literature on factoring. Some studies are shown in Table 4.
Tablo 4. Some Studies Related to Factoring Companies
Factoring and Forfaiting Transactions of Foreign Trade Finance Techniques
(Özdemir, 2005: 194-224)
Legal Feature of Factoring Process and Factoring Process
(Tiryaki,2006: 189-214),
Factoring Agreements (Ravaş ve David, 2010: 289-296)
Factoring Accounting for Factoring Company and Vendor Business
(Kaya ve Gerekan, 2011: 71-101)
Factoring as an Alternative Source (Janekova, 2012: 303-306)
The Effect of Shareholder Groups on the Profitability of Factoring
(Koch, 2015: 39-51)
Özdemir (2005) focused on factoring and forfaiting techniques used in foreign trade financing.
Tiryaki (2006) emphasized and explained the legal feature of the factoring process in the study after giving general information about the factoring process. As a result of the research, it is stated that the factoring contract between the factoring business and the vendor business is a mixed contract.
Ravaş and David (2010) argued that factoring can be a suitable alternative source of funds for Romanian companies during periods of international economic downturn. Also, he argued that factoring benefits are valid for all parties in the factoring process.
Kaya and Gerekan (2011) briefly talked about factoring operations. Then, it is emphasized how the accounting records should be done by the seller business and the factoring company in the factoring process. Examples related to the subject are given.
Janekova (2012) expressed that companies have used factoring techniques as a source of alternative funding to a large extent in his study. He also emphasized the fact that the factoring market is improving in the world and the factoring chain is important in the factoring market. As a result, he outlined the advantages and disadvantages of factoring for companies in his study.
4. Financial Ratios Used in Performance Assessment
One of the methods used to evaluate the financial performances of businesses is the financial ratio analysis. A creditor who would lend to a business, initially, is interested in the liquidity of the business, while on the other hand, a party interested in the securities of the business is concerned with the long-term financial structure of the business. An individual that would invest in the corporate stocks will be primarily interested in the current and future income of the business and the stability of the income (Aydın, N., Başar, M, Coskun, M., 2011: 62). Thus, it is possible to classify the financial ratios used for different purposes in the following five groups.
• Liquidity ratios • Operating ratios
• Financial leverage ratios • Profitability ratios • Market value ratios
Liquidity Ratios: Liquidity ratios measure the ability of a firm to fulfill short-term liabilities. These
ratios are important because failure to pay the liabilities may result in the default of the business. Even profitable businesses, in certain cases, might experience difficulties in paying short-term debts. Because short-term debts are not paid with the profits but with the liquid assets available for the business, in other words, with the current assets. Thus, every business needs to know whether it could afford to pay its short term debts and take necessary precautions if not (Gürsoy, 2007: 90). Some of the liquidity ratios calculated in financial analysis are as follows:
Current Ratio = Current Assets / Current Liabilities
Acid Test Ratio = Current Assets - Inventories / Current Liabilities
Cash Ratio = Liquid Assets (Cash + Bank + Similar Cash Equivalents) / Current Liabilities
Operating Ratios: Operating ratios are used to determine the extent to which the assets that the
business has and utilized in its operations were used efficiently. Operating ratios are particularly important because they present the state of mobility of the assets. In general, high operating ratios are interpreted positively for businesses. However, if the profitability rates are as high as the operating ratios, the interpretation is even more positive (Coskun, 2004: 53). Certain operating ratios considered in financial analysis are as follows:
Inventory Turnover Rate = Cost of Sales / Inventory
Accounts Receivable Turnover Rate = Sales on Credit / Trade Accounts Receivable
Asset Turnover Rate = Net Sales / Total Assets
Financial Leverage Ratios: The ratios in this group examine the relationship between the equity and
liabilities of the business. They are used to determine whether the business equity is sufficient, the balance between liabilities and equity within the asset structure and whether the equity funds were invested in liquid or fixed assets. The high rate of liability among the total assets of an enterprise has a certain amount of cost for the enterprise, while leaving some of the risk on lenders. In other words, the fact that a part of the total assets of the business includes external resources enables the business to take advantage of the financial leverage. Some of the financial structure (leverage) ratios calculated in financial analysis are listed below.
Leverage Ratio = Total Liabilities (Current Liabilities + Long Term Liabilities) / Total Assets
Debt Ratio = Total Debt / Equity
Equity / Total Assets Ratio
Profitability Ratios: Profitability ratios are a group of ratios that are used to measure the success of
sales, assets and the equity of the firm and its profits. Some of the profitability ratios calculated in financial analysis are shown below.
Net Profit Margin = Net Profit / Net Sales
Asset Profitability = Net Profit / Total Assets
Equity Profitability = Net Profit / Equity
Market Value Ratios: Another group of ratios that is related to the assessment of a business’ financial
performance include the ratios that reflect the market value of the business. There is a close correlation between the ratios of a business that are based on financial statements and the market-based ratios. For example, if a business is observed as highly risky and with low profitability when compared to the industry average, then the market price of this business would be lower in financial markets (Aydin, N, Başar, M. Coşkun, M., 2011: 81). The ratios frequently used in this group are presented below.
Price / Earnings Rate = End of Period Stock Price / Earnings Per Share in the Period
Market Value / Book Value = End of Period Stock Price / (Equity / Number of Shares)
Earnings Per Share = Current Period Profit / Number of Shares
5. ELECTRE Method
The basic principle of the ELECTRE method is to determine the superiority relations by conducting paired comparisons between the alternatives separately for each criterion. The superiority relation between the alternatives Ai and Aj, shown as Ai Aj, demonstrates that the decision maker could take the risk of deciding that alternative Ai is superior to alternative Aj although alternative i is not quantitatively superior to alternative j. In multi-criteria decision making problems, in the classical model, a preference order (weak order) that satisfies the conditions of integrity and transitivity between the alternatives is attempted and the best alternative is selected based on the criteria. The steps of the ELECTRE method are explained below (Pohekar, 2004: 365-381).
Step 1 – Constructing the Decision Matrix:
In the first step of this methodology, the decision matrix is constructed. In decision matrix row, the alternatives that need to be ranked based on superiority are given, and the columns include the criteria to be used in decision making. The matrix A is the initial matrix generated by the decision maker and is represented as follows:
11 12 1
21 22 2
1 2
n n ij
m m mn
a a a
a a a
A
a a a
m = number of alternatives,
n = number of criteria
aij = assessment score for the alternative m based on criterion n.
Step 2 – Construction of the Normalized Decision Matrix:
21
1,2, ,..., , 1,2, ,...,
ij ij m
kj k
a
x i K m j K n
a
and the following equation fort he cost criteria;
2 1 1 /1,2, ,..., , 1,2, ,..., 1 ij ij m k kj a
x i K m j K n
a
Thus, the matrix Xij is obtained as follows:
11 12 1
21 22 2
1 2
n
n ij
m m mn
x x x
x x x
X
x x x
Step 3 – Construction of the Weighed Normalized Decision Matrix:
Assessment factors may differ in significance based on the perspective of the decision maker. The matrix V is calculated to reflect these differences in significance in the ELECTRE solution. The decision maker should first determine the weights (Wi) of the assessment factors. The weighted normalized decision matrix V is calculated by multiplying the elements in each column of the normalized matrix X with the corresponding Wi values. The matrix V is expressed as:
1 11 2 12 1
1 21 2 22 2
1
1 1 2 2
, , 1
n n
n
n n
ij ij j ij j
t
m m n mn
w x w x w x
w x w x w x
V V W X W
w x w x w x
where Wj is the weight of jth criterion.
Step 4 – Determination of Concordance and Discordance Sets:
The matrix V is used to determine the sets of concordance and discordance. Decision points are compared based on assessment factors. The criteria are divided into two separate sets for each alternative paired comparison. In Ap and Aq (1,2, ..., m and p ≠ q) concordance cluster, alternative Ap is preferred to alternative Aq.
(p,q) pj qj
C j V V
If alternative Ap is a worse alternative than alternative Aq, a “discordance set” is formed.
D(p,q) j Vpj Vqj
In the ELECTRE method, each concordance set corresponds to a discordance set. In other words, there are as many discordance sets as the number of concordance sets.
Step 5 – Calculation of Concordance and Discordance Indices:
for b when compared to a. Concordance sets are used for the generation of the concordance matrix (C). The elements of the C matrix are calculated using the relationship depicted in the following formula.
pq
j jC W
where concordance index Cpq shows the level of confidence about the result pf the paired comparison. Concordance set j* are the factors in C(p,q). For example;
If C12
1,4 then the value of the element C12 in matrix C will be C12W1W4. Matrix C is expressed as follows. 12 13 1
21 23 2
1 2 3
. . .
m m m m m
c c c
c c c
C
c c c
The discordance matrix (D) is generated using the set of discordances. The elements of the discordance matrix are calculated using the following formula:
0 00 pj qj
j pq pj qj j v v D v v
where 0
j are the fectors in discordance set D (p,q). Matrix D is given below.
12 13 1
21 23 2
1 2 3
. . .
.
m m m m m
d d d
d d d
D
d d d
Step 6 – Superiority Comparison:
Once the concordance and discordance indices are calculated, their elements are inspected in a specific manner, and inadequate alternatives are eliminated. The dominance of alternative Ap over alternative Aq is defined by the magnitude of the concordance index Cpq and the smallness of the discordance index Dpq. For this purpose, initially, the mean C and D values and (C‾ ve D‾) must be calculated.
If CpqC andDpqD, the alternative Ap is preferred to the alternative to Aq. The alternatives selected with the ELECTRE method form a kernel (K). The kernel (K) is constructed based on the following two conditions.
1. A decision point (alternative) in K is not more dominant when compared to another decision point in K (alternative).
2. A decision point (alternative) outside K is behind at least one point in K in the order of preference.
Step 7 – Calculation of Net Concordance and Discordance Indices:
If there are more than one alternatives in the kernel, the selection is determined by calculating the net concordance and discordance indices, and these indices reflect which alternative is more dominant over the other.
the smallest to the largest value, and the net concordance and discordance indices are calculated with the following equations:
1 1
1 1
m m
p pk kp
k k
k p k p
m m
p pk kp
k k
k p k p
C C C
D D D
Then, the largest "C" and the smallest "D" values are selected to obtain the final order.
6. TOPSIS Method
A multi-criteria decision making technique, TOPSIS (Technique for Order Preference by Similarity to Ideal Solution) was first developed by Hwang and Yoon (1981). With this method, the distances of all alternatives from the positive and negative ideal solution are calculated. This approach is based on the fact that the selected alternative should be at the shortest distance to the positive ideal solution and at the farthest distance to the negative ideal solution. In other words, the alternative closest to the positive ideal solution is the farthest alternative to the negative ideal solution. The TOPSIS method considers the alternative that is closest to the positive ideal solution as the best alternative. Criteria values and criteria weights in the TOPSIS process are numerical values. The solution, which is expressed as an ideal or positive ideal solution, is a solution that maximizes the utility criterion and minimizes the cost criterion. On the other hand, the negative or anti-ideal solution is a solution that maximizes the cost criterion and minimizes the utility criterion (Wang, Y. M. Elhag, T. M. S., 2006: 2).
There is no mathematical method that replaces the human thought in alternative development. However, after the alternatives are developed, TOPSIS, which is a multi-criteria decision making methodology, can be used to rank alternatives and suggest a solution to the decision makers. TOPSIS offers an approach that is compatible with the multi-criteria decision making technique. The content of the TOPSIS methodology is rational and comprehensible. In the TOPSIS method, both the distances to the positive ideal solution and the negative ideal solution are considered while calculating the distance required for the ideal solution. The proximity coefficients obtained by these distances are used for ordering (Janko, W., Bernroider, E., 2005: 36).
The TOPSIS method implementation steps are described as follows (Demireli, 2010: 105).
Step 1: Constructing the Decision Matrix (A)
The decision matrix rows contain the decision points to be ranked and the evaluation factors to be used in the decision making are included in the columns. The matrix "A" is the initial matrix generated by the decision maker. The decision matrix is shown as follows:
11 12 1
21 22 2
1 2
n n ij
m m mn
a a a
a a a
A
a a a
In matrix A, “m” is the number of decision points, “n” is the number of assessment factors.
Step 2: Construction of the Standard Decision Matrix (R)
2 1 ij ij m kj k a r aMatrix “R” is obtained as shown below:
11 12 1
21 22 2
1 2
n n ij
m m mn
r r r
r r r
R
r r r
Step 3: Constructing the Weighed Standard Decision Matrix (V)
Initially, the weight values (i w) for the assessment factors are determined. Then the elements in each column of the matrix "R" are multiplied by the corresponding "i w" value to form a matrix "V". The matrix "V" is shown below:
1 11 2 12 1
1 21 2 22 2
1 1 2 2
n n
n n
ij
m m n mn
w r w r w r w r w r w r V
w r w r w r
Step 4: Constructing the Ideal (A*) and Negative Ideal (A−) Solutions
The TOPSIS method assumes that each assessment factor has a monotonically increasing or decreasing tendency. To form the ideal solution set, the weighted assessment factors in the "V" matrix, i.e., the largest column values (the smallest if the related assessment factor is in the direction of minimization) are selected. The ideal solution set is shown as follows:
*
(maxi ij ),(mini ij '
A v j J v j J
The set that would be calculated using the ideal solution set equation could be shown as follows:
* * * *
1, ,...,2 n
A v v v
The negative ideal solution set is generated by selecting the weighted assessment factors in the "V" matrix, that is, the smallest of the column values (the largest if the related evaluation factor is in the direction of maximization). The calculation of the negative ideal solution set is shown in the following equation:
(maxi ij ),(mini ij '
A v j J v j J
The set that would be calculated with the ideal solution set formula is shown asA
v v1, 2,...,vn
.In both formulas, "J" indicates the utility (maximization) and "J" indicates the loss (minimization) values. Both the ideal and the negative ideal solution sets include elements that equal to the number of assessment factors, i.e. "m" elements.
Step 5: Calculation of Differentiation Measures
In the TOPSIS method, the "Euclidean distance approach" is used to find the deviations of the factor value from the ideal and negative ideal solution set in the evaluation of each decision point. The deviation values for the decision points obtained are called "Ideal Differentiation *
Differentiation ( )Si " measures. The calculation of the ideal differentiation measure “
*
( )Si ” is shown in
formula (1) and the calculation of the negative ideal differentiation measure “( )Si ” is shown in formula (2).
* * 2
1
( )
n
i ij j j
S v v (1)
21
( )
n
i ij j j
S v v (2)
Here, the number that would be calculated would naturally equal to “ *
( )Si ” and “
( )Si ”.
Step 6: Calculation of the Relative Proximity to the Ideal Solution
Ideal and negative ideal differentiation measures are used to calculate the relative proximity of each decision point to the ideal solution. The criterion used here is the share of the negative ideal differentiation measure within the total differentiation measure. The calculation of the relative proximity to the ideal solution value is shown in the following formula:
*
*
i i
i i
S C
S S (3)
where *
(C )i value is within 0 ≤ *
(C )i ≤ 1 interval and the related decision reflects the absolute proximity of the related decision point *
(Ci 1) to the ideal solution, and the absolute proximity of the related decision point
*
(Ci 0) to the negative ideal solution.
7. Application of ELECTRE and TOPSIS Methods on Performance Evaluations in the Factoring Industry
7.1. Data
Information on factoring companies that were traded in BIST and used as the study data was obtained from www.borsaistanbul.com, Public Disclosure Platform web site www.kap.gov.tr and the related corporate web sites.
In the implementation of TOPSIS and ELECTRE methods, 6 decision points and 6 assessment factors (financial ratios) are used. The data used as assessment factors are the rates published in the corporate financial statements obtained from corporate web sites. The financial ratios used in the study are coded as O1, O2, O3, O4, O5, O6 and are shown in Table 5.
Table 5. Financial Ratios Used in the Study
No Ratio Code Formulation Weight
1 Current Ratio O1 Current Assets / Current Liabilities 0,18
2 Leverage Ratio O2 Total Liabilities / Total Assets 0,13
3 Earnings Per Share O3 Net Period Profit / Number of Shares 0,2
4 Return on Equity O4 Net Profits/Equity 0,16
5 Asset Profitability O5 Net Profits/Total Assets 0,19
In the application, the relevant literature was searched in the selection and weighting of the financial ratios to be used in evaluating the financial performance of the factoring companies and 30 managers and experts working in the sector were consulted. Firstly, it was asked which financial ratios were used in the performance evaluation of the sector and the financial ratios which are used most as performance indicators were determined. As a result of the survey, it is requested that 30 executives and experts working in the sector to be consulted determine the importance levels between 0 and 1 as the overall sum of the weights of the criteria is going to be 1. Then, while the weight of each criterion is found, the weights given for the determined criterion are summed and divided by the evaluator number that’s why the arithmetic average method is used. The reason for using the expert opinion method when the weights of the criteria are determined is that the criteria and the weights used by the companies in the sector and in practice are also wanted to be used in the work.
The financial ratio formulations indicated in Table 5 were calculated with Microsoft Excel with the information obtained from the 2016 annual reports that the companies published on their web sites.
7.2. Application of the ELECTRE Method
1st Step: In the first step of the application of the ELECTRE method, the Standard Decision Matrix (A) was constructed. Standard decision matrix rows listed the factoring companies and columns represented corresponding financial ratios.
Table 6. Standard Decision Matrix (A)
Code Company Current
Ratio
Leverage Ratio
Earnings per share
Return on Equity
Asset Profitability
Total Asset Turnover Rate
F1 Başer 0,888 0,757 0,097 0,071 0,017 0,183
F2 Creditwest 1,257 0,796 0,317 0,169 0,034 0,183
F3 Garanti 1,063 0,936 0,248 0,106 0,007 0,084
F4 Huzur 1,102 0,867 0,214 0,157 0,021 0,239
F5 Lider 0,956 0,895 0,712 0,190 0,020 0,142
F6 Yapı Kredi 1,074 0,930 1,182 0,175 0,012 0,063
2nd Step: Using the formula below, the matrix was normalized using the values in the standard decision matrix. The normalized decision matrix X is shown in Table 7.
21
1,2, ,..., , 1,2, ,...,
ij ij m
kj k
a
x i K m j K n
a
Table 7. Normalized Decision Matrix (X)
Code Company Current
Ratio
Leverage Ratio
Earnings per share
Return on Equity
Asset Profitability
Total Asset Turnover Rate
F1 Başer 0,341 0,357 0,067 0,192 0,344 0,465
F2 Creditwest 0,483 0,375 0,218 0,458 0,687 0,465
F3 Garanti 0,408 0,441 0,170 0,288 0,135 0,214
F4 Huzur 0,423 0,409 0,147 0,425 0,417 0,606
F5 Lider 0,367 0,422 0,489 0,514 0,397 0,359
3rd Step: At this stage, the weighted standard decision matrix (V) is established. To reflect the significance differences between the evaluation factors for the decision maker into the ELECTRE solution, each value in the normalized decision matrix (X) is multiplied by the weights of the criteria in the corresponding column to create the V matrix presented in Table 8 below.
Table 8. Weighed Standard Decision Matrix (V)
Code Company Current
Ratio
Leverage Ratio
Earnings per share
Return on Equity
Asset Profitability
Total Asset Turnover Rate
F1 Başer 0,061 0,046 0,013 0,031 0,065 0,065
F2 Creditwest 0,087 0,049 0,044 0,073 0,130 0,065
F3 Garanti 0,073 0,057 0,034 0,046 0,026 0,030
F4 Huzur 0,076 0,053 0,029 0,068 0,079 0,085
F5 Lider 0,066 0,055 0,098 0,082 0,075 0,050
F6 Yapı Kredi 0,074 0,057 0,162 0,076 0,046 0,022
4th and 5th Steps: Here, in Step 4, each concordance (C) set (cluster) corresponds to a set (D) of discordance (cluster). For example, in the present implementation, the F1 alternative is superior to the F3 alternative for the 5th and 6th criteria, but inferior for the criteria 1, 2, 3, and 4. CF1F3 = (5,6) and DF1F3 = (1, 2, 3, 4). Using the concordance and discordance clusters determined in step 4, the concordance and discordance indices were calculated using the following formulas.
pq j
j
C W
0 0
0 pj qj
j pq
pj qj j
v v D
v v
Table 9. Concordance Index Values
row 1-1 1 row 4-1 1
row 1-2 0 row 4-2 0,270
row 1-3 0,330 row 4-3 0,670
row 1-4 0 row 4-4 1
row 1-5 0,140 row 4-5 0,510
row 1-6 0,330 row 4-6 0,510
row 2-1 1 row 5-1 0,860
row 2-2 1 row 5-2 0,490
row 2-3 0,870 row 5-3 0,690
row 2-4 0,730 row 5-4 0,490
row 2-5 0,510 row 5-5 1
row 2-6 0,510 row 5-6 0,490
row 3-1 0,670 row 6-1 0,670
row 3-2 0,130 row 6-2 0,490
row 3-3 1 row 6-3 0,730
row 3-4 0,330 row 6-4 0,490
row 3-5 0,310 row 6-5 0,510
Table 10. Discordance Index Values
row 1-1 0 row 4-1 -0,045
row 1-2 0,437 row 4-2 0,344
row 1-3 0,139 row 4-3 0,031
row 1-4 0,251 row 4-4 0
row 1-5 0,567 row 4-5 0,459
row 1-6 1 row 4-6 0,892
row 2-1 0 row 5-1 0,099
row 2-2 0 row 5-2 0,370
row 2-3 0,058 row 5-3 0,049
row 2-4 0,132 row 5-4 0,232
row 2-5 0,364 row 5-5 0
row 2-6 0,797 row 5-6 0,433
row 3-1 0,266 row 6-1 0,287
row 3-2 0,704 row 6-2 0,565
row 3-3 0 row 6-3 0,052
row 3-4 0,368 row 6-4 0,420
row 3-5 0,428 row 6-5 0,195
row 3-6 0,861 row 6-6 0
6th Step: The superiority comparison is conducted by comparing the magnitude of the concordance index Cpq and the smallness of the discordance index Dpq. For this purpose, the mean C and D values and (C‾ and D‾) were calculated. If CpqC andDpq D, then alternative Ap was preferred to the alternative Aq. For each value, a matrix of superiority is established based the case where this value is greater than, equal to, or smaller than the threshold value. For example, a matrix is formed with NO = 0, since C (F1, F3) = 0,330 was smaller than c threshold (0,583), and with YES = 1 since in C (F2, F3) = 0,870 was greater than c threshold in the superiority matrix. And the discordance matrix was established with NO = 1 since D (F1, F2) = 0,437 value was greater than d threshold value (0,299), and with YES = 0, since D (F1, F3) = 0,139 value was smaller than d threshold value.
7th Step: Net concordance and discordance indices were calculated.
For instance, C value for F1 was calculated as shown below:
CF1 = (CF1F2+CF1F3+CF1F4+CF1F5+CF1F6)–(CF2F1+CF3F1+CF4F1+CF5F1+CF6F1= (0+0,330+0+0,140+0,330)- (1+0,670+1+0,860+0,670)= -3,4
Table 11. Net Concordance and Discordance Indice Values
Code Company Net Concordance (C) Net Discordance (D)
F1 Başer -3,400 1,787
F2 Creditwest 2,240 -1,069
F3 Garanti -1,580 2,299
F4 Huzur 0,920 0,278
F5 Lider 1,040 -0,831
The above indices demonstrated that Yapı Kredi Factoring which has the F6 code was the company with the largest C value and the smallest D value. In this case, the factoring company with the best performance, was selected as Yapı Kredi Factoring. Yapı Kredi Factoring is seen to be superior to other companies in superiority comparisons. This means that F6 is the company with the most supremacy and it is the best factoring company financially. Başer Faktoring company which has the F1 code is in the last order. This company seems to have the least superiority index. Other companies are listed in Table 15.
7.3. Application of the TOPSIS Method
The first three steps conducted in the ELECTRE method, construction of the decision matrix, normalized decision matrix and weighted normalized decision matrix, are similar in the TOPSIS method. Since these three steps were calculated in the ELECTRE method in our application, the TOPSIS method was initiated with the calculation of the positive and negative ideal solution sets, which is the fourth step in the Topsis method.
4th Step: The TOPSIS method assumes that each assessment factor has a monotonically increasing or decreasing tendency. We have mentioned that to form the ideal solution set, the largest weighted assessment factors in the "V" matrix, i.e., the largest column values, for the negative ideal solution set, the smallest weighted assessment factors in the "V" matrix, i.e. the smallest column values, should be selected.
Table 12. Positive and Negative Ideal Solutions
Positive Ideal Solution 0,087 0,057 0,162 0,082 0,130 0,085
Negative Ideal Solution 0,061 0,046 0,013 0,031 0,026 0,022
5th Step: The distances of each decision point from the positive-ideal solution (S +) and the negative-ideal solution (S-) were calculated. The formulas for the calculation of differentiation measures, i.e. the
distances, as mentioned above, are
* * 2
1
( )
n
i ij j j
S v v for positive ideal discrimination and
21
( )
n
i ij j j
S v v for negative ideal discrimination.
Thus, the square roots of the sum of the squares for the differences to the positive and negative ideal solutions were calculated for each line reflecting the alternatives. Table 11 where the calculation was conducted is displayed below:
Table 13. Distances to Positive and Negative Ideal Solutions
Code Company Distance to Positive Ideal Solution Distance to Negative Ideal Solution
F1 Başer 0,030 0,003
F2 Creditwest 0,015 0,016
F3 Garanti 0,032 0,001
F4 Huzur 0,021 0,009
F5 Lider 0,009 0,013
F6 Yapı Kredi 0,011 0,025
6th Step: The relative proximity of each decision point to the ideal solution (C )*
i is calculated using
the following formula, as previously described, using distance measures to the positive ideal and negative ideal solutions.
*
*
i i
i i
S C
Table 14. Relative Proximity to the Ideal Solution
Code Company Relative Proximity to the Ideal Solution
F1 Başer 0,101
F2 Creditwest 0,525
F3 Garanti 0,030
F4 Huzur 0,297
F5 Lider 0,599
F6 Yapı Kredi 0,690
It was observed that Yapı Kredi Factoring Company showed the best performance in the factoring sector with an average value of 0,690 when the relative proximity values were considered. Lider Factoring company whish has the F5 code is in the second order with a performance rating of 0,599. Other factoring companies are listed in Table 15 according to their calculated values. When ranking, the company with the greatest value has the best performance and the other companies are ranked from small to large according to their values.
Table 15. Comparison of the Results of the ELECTRE and TOPSIS Methods
ELECTRE TOPSIS
Code Company C Value D Value Order Value Order
F1 Başer -3,400 1,787 6 0,101 5
F2 Creditwest 2,240 -1,069 2 0,525 3
F3 Garanti -1,580 2,299 5 0,030 6
F4 Huzur 0,920 0,278 4 0,297 4
F5 Lider 1,040 -0,831 3 0,599 2
F6 Yapı Kredi 2,290 -2,465 1 0,690 1
In Table 15, the results of both methods were given collectively on a tabled basis and compared. Yapı Kredi Factoring Company has been ranked in the first order in both solutions. Other factoring companies are in different orders with close values.
8. Results and Conclusion
In contemporary economies, there are several financial techniques that businesses use to raise funds. At the forefront of these techniques, there is factoring operations. Although factoring services commenced in the 1980s in Turkey, the factoring history goes further back when compared. The significance of factoring operations increased as the markets realized their importance in turning the wheels of the. On the other hand, the analysis of the financial performance of factoring companies is also a significant consideration.
necessity. Whether you are an executive or an investor, it will be understood that the best-performing firm selection process can be done in a systematic way that is faster and cost-free, and that results can be interpreted more easily and more clearly.
The performance analysis criteria used in the present study included the financial ratios calculated based on the 2016 financial statements published by six factoring companies traded in BIST. Each company were superior to another based on different performance indicators. However, to make a holistic assessment, the specific decision making techniques such as ELECTRE and TOPSIS were utilized.
The main objective of the present study was to demonstrate the applicability of the multi-criteria decision making techniques of ELECTRE and TOPSIS, as well as to determine the best performing factoring companies based on determined criteria using ELECTRE and TOPSIS methods. The six evaluation criteria used in the application were determined by the review of the related literature and by interviews with the experts in the field. Criterion values were calculated using the published corporate financial reports obtained from corresponding corporate web sites. Face-to-face interviews with the company managers and experts were carried out in order to determine the weights and the six evaluation criteria used in the application of the algorithm used in the study. The practice of this study is considered as a constraint in terms of time and labor. It will be useful for researchers who use this method to pay attention to the number of people that’s why it will make their to-face interviews quicker and easier. The data can also be received by e-mail but face-to-face interviews will help to obtain more accurate data so that the correct values can be given because the criterial weights have careful prescription. The constructed model was analyzed using the ELECTRE and TOPSIS methods. Yapı Kredi Factoring Company was ranked the first when both solutions were applied.
References
Abalı, Y. A., Kutlu, B. S., & Eren, T. (2012). Çok ölçütlü karar verme yöntemleri ile bursiyer seçimi: Bir öğretim kurumunda uygulama. Atatürk Üniversitesi İktisadi ve İdari Bilimler Dergisi, 26(3-4), 259-272.
Akyüz, Y., & Soba, M. (2013). ELECTRE yöntemiyle tekstil sektöründe optimal kuruluş yeri seçimi: Uşak ili örneği. Uluslararası Yönetim İktisat ve İşletme Dergisi, 9(19), 185-198.
Aydın N., & Coşkun Başar, M. (2011). Finansal Yönetim. Detay Yayıncılık. Ceylan, A. (2002). Finansal Teknikler (4. baskı). Ekin Kitabevi Yayınları.
Coşkun M. (2004). Finansal Analiz. Eskişehir: Anadolu Üniversitesi Açıköğretim Fakültesi Yayınları.
Çalışkan H., Kurşuncu, B., Kurbanoğlu, C., & Güven, Ş. Y. (2012). TOPSIS metodu kullanılarak kesici takım malzemesi seçimi. Makine Teknolojileri Elektronik Dergisi, 9(3), 35-42.
Demireli, E. (2010). TOPSIS çok kriterli karar verme sistemi: Türkiye’deki kamu bankaları üzerine bir uygulama. Girişimcilik ve Kalkınma Dergisi, 5(1), 101-112.
Gürsoy, C.T. (2007). Finansal Yönetim İlkeleri. İstanbul: Doğuş Üniversitesi Yayınları. http://www.bddk.org.tr//Kuruluslar/Faktoring (Erişim Tarihi, 17.03.2017)
http://www.borsaistanbul.com (Erişim Tarihi, 17.03.2017) http://www.fkb.org.tr (Erişim Tarihi, 23.03.2017)
http://www.kap.org.tr/Sektorler
Hwang, H., Moon C., Chuang, C., & Goan, M. (2005). Supplier selection planning model using AHP. International Journal of the Systems for Logistics and Management, 1(1), 47-53.
Janekova, J. (2012). Faktoring-alternative source of a company. Annals of the Faculty of Engineering Hunedoara - International Journal of Engineering, 10(3), 303-306
Janko, W., & Bernroider, E. (2005). Multi-criteria decision making: An Application study of ELECTRE and TOPSIS.
Karacasu, M. (2007). kent içi toplu taşıma yatırımlarının değerlendirilmesinde karar destek modeli (ELECTRE yöntemi) kullanımı. İstanbul: 7. Ulaştırma Kongresi, 19-21 Eylül, 155-164.
Koch, S. (2015). Effects of shareholder groups on the faktoring ınstitutions profitability: Evidence from Germany. International Journal of Economics and Finance, 7(11), 39-51.
Mahmoodzadeh, S., Shahrabi, J., Pariazar, M., & Zaeri M. S. (2007). Project selection by using Fuzzy AHP and TOPSIS technique. International Journal of Humanities and Social Sciences, 1(3), 135-140.
Montazer, G.A., Saremi, H.Q., & Ramezani, M. (2009). Design a new mixed expert decision aiding system using Fuzzy ELECTRE III method for vendor selection. Expert Systems with Applications, 36, 10837–10847.
Nijkamp, P. (1975). A multicriteria analysis for project evaluation: Economic-ecological evaluation of a land reclamation project. Papers of the Regional Science Association, 35(1), 87-111.
Ömürbek, N., & Kınay, B. (2013). Havayolu taşımacılığı sektöründe TOPSIS yöntemiyle finansal performans değerlendirmesi. Süleyman Demirel Üniversitesi İktisadi ve İdari Bilimler Fakültesi Dergisi, 18(3), 343-363. Önder, E., & Dağ, S. (2013). Combining Analytical Hierarchy Process and topsıs approachesfor supplier selection in a
cable company. Journal of Business, Economics & Finance, 2(2), 56-74.
Özdemir, Z. (2005). Dış ticaret finansman tekniklerinden faktoring ve forfaiting işlemleri. Kocaeli Üniversitesi Sosyal Bilimler Enstitüsü Dergisi, 10(2), 194-224
Özgüven, N. (2011). Kriz döneminde küresel perakendeci aktörlerin performanslarının TOPSIS yöntemi ile değerlendirilmesi. Atatürk Üniversitesi İktisadi ve İdari Bilimler Dergisi, 25(2), 151-162.
Özkan, A. (2008). Kentsel katı atık yönetim sistemlerinin oluşturulmasında farklı karar verme tekniklerinin kullanımı. Anadolu Üniversitesi Fen Bilimleri Enstitüsü, Dalı Doktora Tezi, Eskişehir.
Pawar, S. S., & Verma, D. S. (2013). Digital camera evaluation base on AHP and TOPSIS. International Journal of Engineering Research, 2(2), 51-53.
Pohekar, S.D., & Ramachandran, M. (2004). Application of multi-criteria desicion making to sustainable energy planning-a review. Renewable &Sustainable Energy Reviews, 8(4), 365–381.
Roy, B., & Bouyssou, D. (1986). Comparison of two decision-aid models appliedto a nuclear power plant siting example. European Journal of Operational Research, 25(2), 200-215.
Ravaş, O.C., & David, A. (2010). Factoring agreement-financing method for the companies ın lack of cash-flow. Annals of the University of Petroşani, Economics, 10(4), 289-296
Shih, H., Shyur, H., & Lee, S. (2007). An extension of TOPSIS for group decision making. Mathematical and Computer Modelling, 45(7-8), 801–813.
Soba, M. (2014). Banka yeri seçiminin analitik hiyerarşi süreci ve ELECTRE metodu ile belirlenmesi: Uşak ilçeleri örneği. Mustafa Kemal Üniversitesi Sosyal Bilimler Enstitüsü Dergisi, 11(25), 459-473.
Supçiller, A. A., & Çapraz, O. (2011). AHP-TOPSIS yönetimine dayalı tedarikçi seçimi uygulaması. İstanbul Üniversitesi İktisat Fakültesi Ekonometri ve İstatistik Dergisi 12. Uluslararası Ekonometri, Yöneylem Araştırması, İstatistik Sempozyumu Özel Sayısı, 13, 1-22.
Tiryaki, B. (2006). Faktoring işlemi ve faktoring işleminin hukuki niteliği. Dokuz Eylül Üniversitesi Hukuk Fakültesi Dergisi, 8(2), 189-214
Tunca, M. Z., Aksoy, E., Bülbül, H., & Ömürbek, N. (2015). AHP temelli TOPSIS ve ELECTRE yöntemiyle muhasebe paket programı seçimi. Niğde Üniversitesi İktisadi ve İdari Bilimler Fakültesi Dergisi, 8(1), 53-71.
Türkmen, S. Y., & Çağıl, G. Ç. (2012). İMKB’ye kote bilişim sektörü şirketlerinin finansal performanslarının TOPSIS yöntemi ile değerlendirilmesi. Maliye Finans Yazıları, 26(95), 59-78.
Uyanık (2015). Dünya’da ve Türkiye’de faktoring tanımı. Gazi Üniversitesi Sosyal Bilimler Dergisi, 2(3), 23-40.
Wang Y. M., & Elhag T.M.S. (2006). Fuzzy TOPSIS method based on alpha level sets with an application to bridge risk assessment. Expert Systems with Applications.
Yurdakul, M., & İç, Y. T. (2003). Türk otomotiv firmalarının performans ölçümü ve analizine yönelik TOPSIS yöntemini kullanan bir örnek çalışma. Gazi Üniversitesi, Mühendislik ve Mimarlık Fakültesi Dergisi, 18(1), 1-18.