Jackknife And Bootstrap Techniques In The
Estimation of regression Parameters
1
Ijomah Maxwell Azubuike, 2Chris-Chinedu, Joy Nonso
1
Department of Mathematics & Statistics, 2Department of Mathematics 1
University of Port Harcourt, 2Ignatius Ajuru University of Education 1
Choba, Port Harcourt, Nigeria, 2Rumuolumeni Port Harcourt, Nigeria
Abstract - The classifications according to various criteria into successive levels for building a regression model by using jackknife and bootstrap resampling methods were the basis in this study. Bootstrap techniques on the basis ofthe observations and errors resampling re-computing the estimates, while jackknife methodis based on the delete-one and delete-d observations were considered. Wealso estimatedjackknife and bootstrap bias, theconfidence levels and standard errors of the regression coefficients, and to compare them with the concerned estimates of ordinary least squares(OLS). The regression coefficients of jackknife bias, the standard errors and confidence intervals are considerably larger than the bootstrap and the estimated related to OLS standard errors. The bootstrap percentile intervals are smaller than that of thejackknife percentile intervals of the regression coefficients.
Keywords: jackknife, bootstrap, resampling and regression
I. INTRODUCTION
Regression analysis is one of the most widely used statistical techniques in which we study the effects of explanatory variables on a response variable. Two of the most important problems in applied statistics are the determination of an estimator for a particular parameter of interest and the evaluation of the accuracy of that estimator through estimates of the standard error of the estimator and the determination of confidence intervals for the parameter [1].
Consider the model
X
X
PX
PY
0 1 1 2 2...
...
(1)where β
0 = a constant β1, β2, …, βp = regression parameters ε = random error . When we have n observations on Y
and Xi’s this equation can be represented as follows:
X
Y
where ' 21
,
,...,
)
(
y
y
y
nY
is a n-vector of responses
and
' 1
0
,
,...,
)
(
p
is a p+1-vector parameters and
' 2
1
,
,...
.,
)
(
n
is a n-vector of error terms.An ordinary least square solution to (1) is one in which the Euclidean norm of the vector (YX
)is minimized. That is ,2
min
Y
X
By setting the gradient of the square of this norm,
(
)
(
),
1
Y
X
X
Y
to zero with respect to the vector
, thenecessary condition for the solution vector
ˆ
is that
ˆ
must be a solution toY
X
X
X
1
1 (3)In other symbols, the solution is
Y
X
X
X
1)
1 1(
ˆ
(4)The Jackknife and Bootstrap are the most popular resampling methods that are becoming increasingly popular as statistical tools as they are generally very robust, their simplicity is compelling and their computational demands are largely no longer an issue to their widespread implementation which are designed to estimate standard errors, bias, confidence intervals, and prediction error. The basic objective of all statistical analyses is to extract information from the available data under consideration. The use of the jackknife and bootstrap to estimate the sampling distribution of the parameter estimates in linear regression model was first proposed by Efron [3] and further developed by Freedman([10], [27]). These resampling methods are essentially computer intensive techniques to extract as much information as possible from the data at hand. Bootstrap and Jackknife use the sample data to estimate the relevant properties of the population. They empirically construct the sampling distribution of a statistic by resampling.These resampling methods replace the rigorous theoretical derivations required in applying traditional methods (such as substitution and linearization) in statistical analysis by repeatedly resampling the original data and making inferences from the resamples. Thus these methods can routinely answer questions which are far too complicated for traditional statistical analysis. The resampling procedure is in parallel with sample withdrawal from the population. The application of bootstrap methods to regression models helps approximate the distribution of the coefficients [10]and the distribution of the prediction errors when the regressors are data [24] or random variables [17]. We are concerned here with the application of the bootstrap techniques to determine prediction intervals on econometric models when the regressors are known. Wolter [26] discusses use of resampling methods for variance estimation especially in the context of sample surveys. Shao and Tu [22] discuss the Jackknife and Bootstrap methods applied to diverse areas of statistics. Lahiri[15]discusses Bootstrap and related resampling methods for temporal and spatial data exhibiting various forms of dependence without requiring stringent structural assumptions. Good [11] also discusses various software for re-sampling purposes among other things. The bootstrap is a resampling method that draws a large collection of samples from the original data. It is used to select the observation randomly with replacement from the original data sample [6].
methods to estimates parameters of linear regression. Finally, the last section summarizes the conclusions of the study.
II. THE JACKKNIFE TECHNIQUE
The Jackknife method was proposed by Quenouille [20]as a method of bias reduction which eventually in later years became widely useful for variance estimation. Given a sample data, the Jackknife method uses all but some units at a time to form a group. Following Tukey [25]’s conjecture that the so–called “pseudovalues” obtained from these groups are IID random variables one can get a simple estimator of variance. The generalized Jackknife is called the delete–d–Jackknife.
Let
ˆ
nbe an estimator of
based on n i.i.d. random vectorsX
1,...
,
X
n, i.e.,
ˆ
n
f
n(
X
1,...
.,
X
n)
forsome function fn.
Let
ˆ
n,i
f
n1(
X
1,...,
X
i1,X
i1,....,
X
n)
be the corresponding recomputed statistic based on all but the ithobservation. The jackknife estimator of bias
E
(
ˆ
n)
is given by
n i n i n jn
n
bias
1 ,ˆ
ˆ
)
1
(
Jackknife estimator
jof
is given by
n i i n n nj
n
n
n
biasj
1 ,ˆ
)
1
(
ˆ
1
ˆ
(5)Such a bias corrected estimator hopefully reduces the overall bias. The summands above
n
i
n
n ni
n,
(
1
)
ˆ
1,
1
...,
are called pseudo-values.The Jackknife bias, the variance, the confidence and the percentile interval.
The jackknife variance and the confidence intervals are calculated by using these equations from F(ˆn,i)
distribution [18].
The jackknife variance equals,
1 ,
1
, )(ˆ )
( ) 1 ( ) ˆ
( n i n
n i n i n n j n n
Var
Where
ˆ
n,iis the estimate obtained from the replicate with ith observation set or jth group deleted [7] and
ni i n
n
1,
ˆ
1
. For most statistics, jackknife estimator of variance is Varj(
ˆn)/Var(
ˆn)1 .Jackknife (1-α)100 % confidence interval equals [6].
) ˆ ( * ˆ
) ˆ ( * ˆ
, 2
, ,
, 2
,
, i n p e n i n i n p e n i
n t S t S
(7)
where tn-p,α/2 is the critical value of t with probability α/2 the right for n-p degrees of freedom; and Se(
ˆn,i)is thestandard error of the ˆn,i .The jackknife percentile Interval can be estimated from the quintile’s of the jackknife
sampling distribution of
ˆ
n,i . The (α/2)% and (1-α/2)% percentile interval is) ( ˆ )
( ˆ
,
, i lower n i upper
n
(8)III. BOOTSTRAP
The bootstrap is a method for estimating the distribution of an estimator or test statistic by resampling one’s data or a model estimated from the data. Under conditions that hold in a wide variety of applications, the bootstrap provides approximations to distributions of statistics, coverage probabilities of confidence intervals, and rejection probabilities of tests that are at least as accurate as the approximations of first-order asymptotic distribution theory.The bootstrap makes use of the resampling of the error term at a fixed regressors, and resampling of observation sets at random regressor([22]-[23]).Often, the bootstrap provides approximations that are more accurate than those of first-order asymptotic theory. The importance of the bootstrap emerged during the 1980s when mathematical study demonstrated that it gives nearly optimal estimate of the distribution of many statistics under a wide range of circumstances. The greatest significant advantages of the bootstrap regression techniques are to require little sample than OLS procedure and its theoretical accomplishments is often much better yet this is not warranted [13].In several cases, the method yields better results than those obtained by the classical normal approximation theory. For this reason, it is a misconception to trust that bootstrap regression technique often gives trusted results. The trust rests on the data structure and distribution function.
The Bootstrap bias, the variance, the confidence and percentile interval.
ˆ ˆ
b
bias
(9)The variance of the bootstrap from the distribution of F(ˆb)are estimated by [24]
(ˆ ˆ )(ˆ ˆ )
/( 1) )ˆ (
1
1
B Var
B b
b br b br
b
, r1,2,....,
(10) The bootstrap confidence interval by normal approach is obtained as
)
ˆ
(
*
ˆ
)
ˆ
(
*
ˆ
2 , 2
, e b b n p e b
p n
b
t
S
t
S
(11)where
t
np,2is the critical value of t with probability α/2 the right for n-p degrees of freedom; andS
e(
ˆ
b)
is thestandard error of the
ˆ
b . The Z-distribution values were used rather than that of t in estimating the confidence intervals when the sample size is n =30 [2].The percentile interval which is nonparametric confidence interval can be derived from the quartiles of the sampling distribution of bootstrap of ˆ . The (α/2)% and (1-α/2)% percentile b r interval is:
) ( ˆ )
(
ˆ lower upper
br i br
(12)
where ˆbr is the ordered bootstrap estimates of regression coefficient from Equation 2 or 5, lower = ( α/2)B, and upper = (1-α/2)B.
IV. MATERIAL AND THE METHODS
Material.
The results of the samples obtained from the households listing of 15 alongside with the size of farmland owned (SFO) and the size cultivated (SFC) (in hectares) are y and x respectively, constitute a simple random sample from 162 households. The sample results are tabulated in Table 1.The R statistical packageand SPSS was used for the statistical analysis of the data.
Method.
We start with an n sized sample to depict the resampling methods
W
i
(
Y
i,
X
ji)
1and assumed that Wi’s are pulledindependently and indistinguishably from a distribution of F, where
Y
i
(
y
1,
y
2,
,
y
n)
1contains theresponses,
X
ji
(
x
j1,
x
j2,
,
x
jn)
1is a matrix in the dimension of nxk, where j=1,2,...k, i=1,2,3,...,n.V. RESULTS
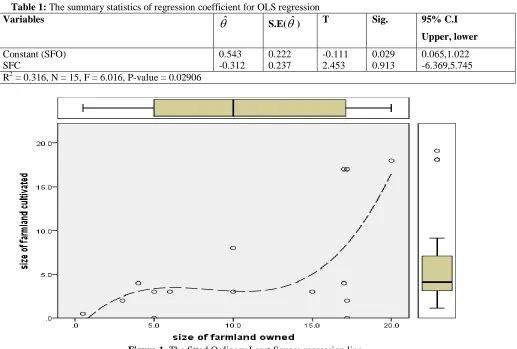
The OLS regression model was first fitted to data given inTable 1 displays the summary of the results of the ordinary least squares regression. The regression of size of farmland cultivated yielded aninsignificant result of variance analysis (P>0.05**). The overall model is significant (P<0.03**).
Table 1: The summary statistics of regression coefficient for OLS regression
Variables
ˆ
S.E(
ˆ
) T Sig. 95% C.IUpper, lower
Constant (SFO) SFC
0.543 -0.312
0.222 0.237
-0.111 2.453
0.029 0.913
0.065,1.022 -6.369,5.745 R2 = 0.316, N = 15, F = 6.016, P-value = 0.02906
Figure 1. The fitted Ordinary Least Square regression line
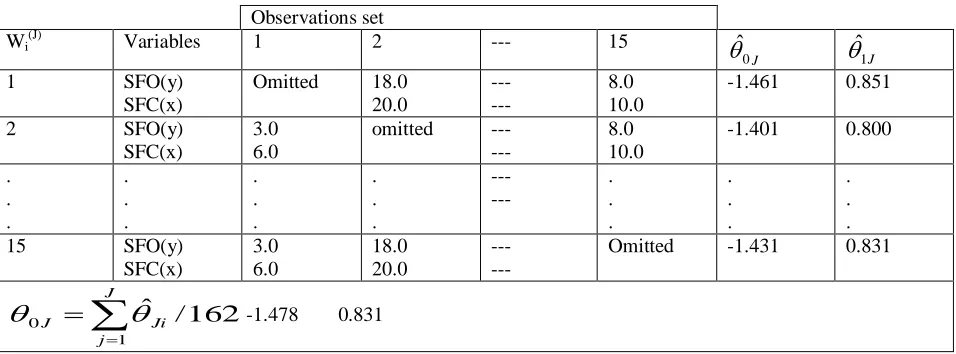
Table 2. The illustration of the jackknife (jackknife samples, each of size n-1=162-1=161) regression processes from the data of Table 1, estimating the jackknife estimates of the parameters of regression for each sample for the size of farmland model.
Observations set
Wi(J) Variables 1 2 --- 15
J
0
ˆ
ˆ
1J1 SFO(y) SFC(x)
Omitted 18.0 20.0
--- ---
8.0 10.0
-1.461 0.851 2 SFO(y)
SFC(x)
3.0 6.0
omitted --- ---
8.0 10.0
-1.401 0.800 . . . . . . . . . . . . --- --- . . . . . . . . . 15 SFO(y)
SFC(x) 3.0 6.0 18.0 20.0 --- ---
Omitted -1.431 0.831
162
/
ˆ
1 0
J j Ji J
-1.478 0.831Table 3: The bootstrap illustration (B=10000 bootstrap samples, n = 162 of each size) regression processes from the data of Table 1, estimating the bootstrap estimates of the parameters of regression for each sample of Size of farmland model
R Variables W1(b) W2(b) --- W15(b) ( ) 0 b
( ) 1 b
1 SFO(y) SFC(x)
3.0 6.0
8.0 10.0
--- 2.00 3.0
-1.479 0.853 2 SFO(y)
SFC(x)
17.0 17.0
3.0 15.0
--- 17.0 17.0
-1.541 0.801 . . . . . . . . . . . . --- . . . . . . . . . 10000 SFO(y)
SFC(x)
3.0 15.0
2.0 3.0
--- 4.0 17.0
-1.432 0.831
br B
b br
b
1
ˆ
ˆ
-1.479 0.832
Table 4. Thisdisplaysthe summary statistics of the coefficients of regression for the jackknife and bootstrap regression (n=162, B=10000)
Variable s
Observed Average Std.Error Bias 95% C.I Lower,Upper
5%,95% P.I Lower,Upper Bootstrap SFO
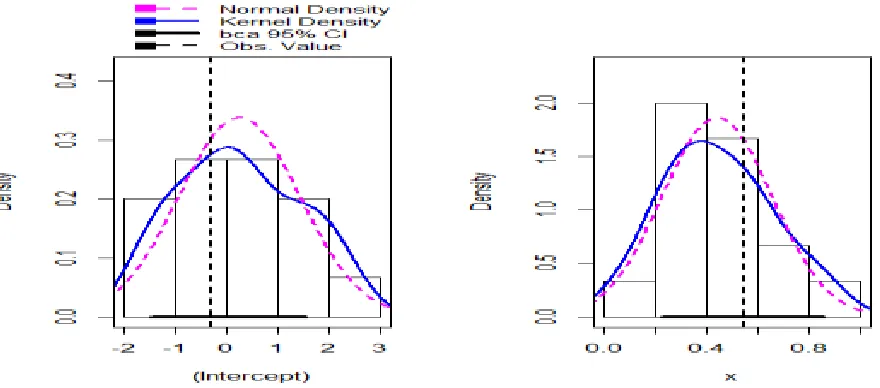
B=10000 bootstrap samples are randomly generated to show the exact feature of the bootstrap processes and the distributions of regression parameter of bootstrap estimations (
ˆ
J)which were displayed in Figure 2. For all regression parameters, the bootstrap estimateshistogram quite well concursto the limiting normal distribution. Nevertheless, where B is abundantly large (B=10000) the confidence intervals should thus be on the basis of that distribution. Also, the jackknife samples were gotten by the omission of each one of the n-observation sets andestimated the coefficients of regression as
ˆ
Ji. To throw back on the main feature of the jackknife regressionparameter estimations
ˆ
Ji. The jackknife estimates histograms quite well concur to the untypical to the limiting normal distribution for all the coefficients of regression.Figure 2: The Histograms of the bootstrap (B=10000) and the jackknife estimates of regression parameter.
based on the bootstrap the Ordinary Least Square standard errors, the confidence intervals are entirelydifferent from the percentile and the confidence intervals based on the standard errors of bootstrap techniques.In comparison of the averages of the bootstrap coefficients
ˆ
0br and
ˆ
1brwith the suitable Ordinary Least Square estimates(OLS):
ˆ
0,and
ˆ
1indicates that there is a small bias in thebootstrap coefficients.Here it can be seen that the estimates from both the methods compare well with each other but their standard errors differ significantly with the Bootstrap version higher than that obtained by the least squares procedure. Mong and Wang [19]have proposed a Jackknife based procedure for estimating non-linear regression model parameters which is bias-reducing without increasing the variance. A detailed account on Jackknife, Bootstrap and other resampling procedures in regression analysis can be found in [27].VI. DISCUSSION AND CONCLUSIONS
References
[1] Chernick, M., R., “ Bootstrap Methods, A Guide for Practitioners and Researchers” , 2nd ed., John Wiley & Sons, Inc.,New Jersey, 2008
[2] DiCiccio, T., Tibshirani, R., “Bootstrap Confıdence Intervals and Bootstrap Approximations”, J. Amer. Statist. Assoc., vol 8 pp. 161–169.
1987.
[3] Efron, B. “Bootstrap methods: another look at the Jackknife”, Ann. Stat., vol7, 1–26. Good, P.I. (2006). Resampling methods 3rd Ed., Boston :Birkhauser, 1979.
[4] Efron, B., “The Jackknife, The Bootstrap and Other Resampling Plans”, CBMS-NSF Regional Conference Series in Applied Mathematics Monograph 38, SIAM, Philadelpia., 1982.
[5] Efron B., “More Efficient Bootstrap Computations”, J. Amer. Statist. Assoc., vol. 86, pp. 79–89,1990.
[6] Efron, B.,Tibshirani, R.J., “An Introduction to the Bootstrap”; Chapman & Hall, New York, 1993.
[7] Friedl, H., Stampfer, E., “Jackknife Resampling, Encyclopedia of Environmetrics,” 2, Eds.: A. El- Shaarawi, W. Piegorsch, Wiley:
Chichester, pp. 1089-1098, 2002a.
[8] Friedl, H., Stampfer, E. “Resampling Methods, Encyclopedia of Environmetrics”, 3, Eds.: A. El- Shaarawi, W. Piegorsch,
Wiley:Chichester, pp. 1768-1770, 2002b.
[9] Fox, J., Applied Regression Analysis, Linear Models and Related Methods; Sage, 1997.
[10] Freedman D. A.“Bootstrapping regression models”, The Annals of Statistics, Vol. 9, p. 1218-1228, 1981.
[11] Good, P.I. “Resampling methods” 3rd Ed., Boston :Birkhauser, 2006.
[12] Hawkins, D. M., and Olive, D. J. “Inconsistency of Resampling Algorithms forHigh Breakdown Regression Estimators and a New Algorithm,” (with discussion),Journal of the American Statistical Association, 97, 136-159, 2002.
[13] Heltshe, J.F., Forrester, N.E., “Statistical Evaluation of the Jackknife Estimate of Diversity when Using Quadrat Samples”, Ecology, vol. 66, pp. 107-111, 1985.
[14] Karlis, D., “An introduction to Bootstrap Methods”, 17th conference of Greek Statistical Society, Greece, 2004.
[15] Lahiri, S.N. “Resampling methods for dependent data”, Springer : New York, 2003.
[16] Leger, C., Politis, D. N., Romano, J.P., “Bootstrap Technology and Applications”, Technometrics, vol. 34, pp. 378-397, 1992.
[17] McCullough B.D., “Estimating forecast intervals when the exogenous variable is stochastic”, Journal of Forecasting, Vol. 15, p. 293-304,
1996.
[18] Miller, R.G., “The jackknife- a review”, Biometrika, vol. 61, pp. 1-15, 1974.
[19] Mong, J. and Wang, X. “Resampling-based estimator in non-linear regression”, Statist. Sinica, 4, 187-98, 1994. [20] Quennouille MH. “Approximate tests of correlation in time series.” J R Statist Soc B; 11: pp. 68–84, 1949.
[21] Shao, J., “Bootstrap Model Selection”, J. Amer. Statist. Assoc, vol. 91, pp. 655-665, 1996. [22] Shao, J., Tu, D., “The Jackknife and Bootstrap”; Springer, New York, 1995.
[23] Stine R.A. “Bootstrap prediction intervals for regression”, Journal of The American Statistical Association, Vol. 80, p. 1026-1031, 1985.
[24] Stine, R., A., “Modern Methods of Data Analysis”; Edit: by John Fox, pp. 325-373, Scotland Sage Pub.,1990.
[25] Tukey, J.W. “Bias and confidence in not quite large samples”, Ann. Math. Stat., 29, 614, 1958. [26] Wolter, K.M. “Introduction to Variance estimation”, New York: Springer Verlag, 1985.
[27] Wu, C.F.J., “Jackknife, Bootstrap and Other Resampling Methods in Regression Analysis”, Annals of Statistics, vol. 14, pp. 1343-1350,