The Journal of Social Sciences Research
ISSN(e): 2411-9458, ISSN(p): 2413-6670
Vol. 5, Issue. 9, pp: 1329-1335, 2019 URL: https://arpgweb.com/journal/journal/7
DOI: https://doi.org/10.32861/jssr.59.1329.1335
Academic Research Publishing Group
Original Research Open Access
Evaluating Perceived Quality Factor in Affecting Customer Purchasing
Behaviour
Yuliyanah Sarudin
*School of Maritime Business and Management Universiti Malaysia Terengganu, Malaysia
Sarina Ismail
School of Maritime Business and Management Universiti Malaysia Terengganu, Malaysia
Abstract
The main model examined in this study is the Aaker model of brand equity. The model views perceived quality as the major aspect of brand equity model. This study focuses on facial beauty care brands in Klang Valley, Malaysia. The data were collected using questionnaires distributed to female consumers of facial care products who are aged 18 and above. The respondents must have experiences in using facial beauty care products. The sets of questionnaire were distributed using the intercept method. In all, 311 sets of questionnaire were deemed as valid in this study. In this regard, the result indicated that perceived quality has no significant link with the actual purchase of facial beauty care products in Malaysia.
Keywords: Perceived quality; Brand loyalty; Brand trust; Facial beauty care brand.
CC BY: Creative Commons Attribution License 4.0
1. Introduction
Prior studies reported that how customers’ perceived quality, knowledge and feeling about a beauty care brand often determine a brand’s strength, especially in the beauty care industry (Yeung and Ramasamy, 2012). Meanwhile, brand equity comprises of overall quality and choice intention (Hanaysha, 2016). In this light, brand quality is measured in accordance to brand performance, reliability and durability, and at the same time, high brand quality signifies that that a particular brand is superior than rival brands in the same industry (Walangitan et al., 2015). In the Malaysian context, there is a massive skepticism about the quality of local beauty products as some products, particularly those sold online and through small kiosks, contain harmful ingredients that could impact consumer’s health (Zulkiffli, 2017).
2. Literature Review and Hypothesis
2.1. Brand Equity
Brand equity is the increased value or usage based the prestige of a product’s brand name. In this regard, brand names, such as Cetaphil, Bio Essence and Nano White have given an advantage to the products (Yoo et al., 2000). Researchers have examined brand equity based on the perception of different parties such as manufacturers, investors or consumer and through social and financial domain (Cobb-Walgren et al., 1995). In this light, this study focuses on customers’ perspectives.
2.2. Actual Purchase Behaviour
Actual purchase behaviour comprises of customers’ planned or unplanned intention to pay money in exchange for a product , as well as the purchase and consumption of the particular product, (Doniyor, 2013). Previous studies reported that while intention does not guarantee actual purchase behaviour, customers with the intention to buy a product will be more likely to buy a product compared to those who do not have any intention to purchase (Wee et
al., 2014). Carrington et al. (2010), reported that the purchase intention often translate to actual purchase as the
customers interact with the physical and social environment prior to the sales transaction. Limited studies have investigated the actual buying behaviour of facial beauty care products. This reflects the importance of exploring the actual purchase behaviour of facial beauty care products, especially in Malaysia. There are several concepts that could be explored in this topic, as follow;
2.2.1 Perceived Quality
higher or premium quality motivate customers to buy products from the brand. It can also help differentiate the brand from other similar brand and provide a strong foundation for the expansion of the brand (July et al., 2016). Based on this argument, the first hypothesis states that.
H1: There is a positive relationship between perceived quality and the actual purchase behaviour of beauty care products.
2.2.2. Brand Loyalty
Loyalty is reflected through customers’ tendency to make repeat purchases of the same products or products from the same brand (Mashavha, 2016). Higher customer loyalty could directly increase a company’s profit, thus,
loyalty can be measured based on a customers’ intention to buy the products over and over again. Furthermore, customer loyalty can help prevent customers from choosing other brands, hence, increased loyalty can also reduce marketing costs (Alhedhaif et al., 2016). It is argued that examining customer loyalty could help researchers to better understand retention towards a brand (Jr et al., 2007). Thus, the second hypothesis states that
H2: There is a positive relationship between brand loyalty and the actual purchase behaviour of beauty care products.
2.2.3. Brand Trust
Fayrene and Lee (2011), mentioned that a brand’s strength could often be measured through customers’ trust
towards the brand and the products. Past studies described that brand trust can be defined as customers’ perception on the ability of the brand to fulfil the functions and characteristics as indicated by product’s description (Kabadayi
and Alan, 2012). Brand trust also reflects customers’ confidence that the brand is reliable. In this light, higher brand
trust will lead to more positive outlook and perception towards the brand. Moreover, according to Mashavha (2016), brand trust is determined by customers’ views about the company, the brand, the product and other information about products being sold. Therefore, the third hypothesis states that,
H3: There is a positive relationship between brand trust and beauty care for actual buying.
Figure-1. Research Model
3. Method
Purposive sampling was used to select the sample for this study (Cavana et al., 2001). As the Klang Valley is the most populated area in Malaysia, the study’s respondents were chosen from consumers of beauty care products in Klang Valley (Nellikunnel et al., 2015) . In choosing the respondents, the study decided to set the minimum age limit to 18 based on Hellsten and Wåhlin (2017) who stated that consumers aged between 18 to 40 buy the highest number of beauty care products. Furthermore, the study only target women as compared to men, women are more inclined to buy beauty products to beautify themselves (Moslehpour et al., 2017). Hence, the sampling criteria include, the respondents must be female, and above, have experienced using facial beauty care products prior to the study. 340 sets of questionnaires were distributed to respondents who fulfilled the sampling criteria. The cross-sectional design was chosen to ensure that all respondents fulfil the sampling criteria to achieve the most accurate result.
analysed using the smartPLS software. The analysis was done through multivariate modelling of equation structure (SEM), which is a powerful multivariate analysis method (Ismail, 2014).
The questionnaire was divided into 3 sections, Section A (Respondent Information), Section B (Purchase Information) and Section C (Information Review). Sections C measures all of the the independent variables and dependent variable. There are three (3) independents variables (perceived quality, brand loyalty and brand trust) and one (1) dependent variable (actual buying) in this study. In this study, there are three (3) independents variables (perceived quality, brand loyalty and brand trust) will be a measure with one (1) dependent variable (actual buying). Each variable was measured through 5 items. To avoid common method variance, 2 different Likert-scale the 5-point Likert- scale was used in items on perceived quality, brand loyalty and brand trust) and the 7-point Likert scale was used to measure actual buying.
G Power was used to determine the sample size. This approach is suitable for this study since there is no specific data on the number of beauty product consumers in the Klang Valley. According to Joseph et al. (2014)G * Power 3.1.9.2 software was used to determine the minimum number of required sample. Furthermore, it was stated that the number of respondents must range from 30 to 500 to achieve a sufficient result Sekaran and Bougie (2016). Hence, 340 were set as the sample size of this study. 340 questionnaires were distributed to respondents in the Klang Valley. All of the questionnaires were returned but 27 questionnaires were returned with incomplete missing value and 2 questionnaires (questionnaire number 47 and 218) were excluded due to the presence of outliers (Mahalanalobis Distance).
4. Discussions
Table-1. Present the demographics characteristics of target respondents and summary of demographics characteristics.
Demographic Characteristics Frequency Percentage % Age
Under 20 years old 58 18.6
21-30 years old 226 72.7
31-40 years old 17 5.5
41-50 years old 9 2.9
More than 50 years old 1 0.3
Monthly Income
Less than RM1,000 169 54.3
Between RM1,000-RM2,000 68 21.9
Between RM2,000-RM3,000 47 15.1
Between RM3,000-RM4,000 17 5.5
More than RM4,000 10 3.2
Ethnic
Malay 290 93.2
Chinese 9 2.9
India 9 2.9
Others 3 1.0
Religion
Islam 293 94.2
Buddha 6 1.9
Hindu 5 1.6
Kristian 7 2.3
Level of Education
Primary 0 0
Secondary 34 10.9
Diploma 107 34.4
Degree 160 51.4
Master 9 2.9
PhD 1 0.3
Occupation
Public 27 8.7
Private 94 30.2
Self-employed 9 2.9
Housewife 2 0.6
Student 173 55.6
Others 6 1.9
Marital Status
Single 275 88.4
Married 33 10.6
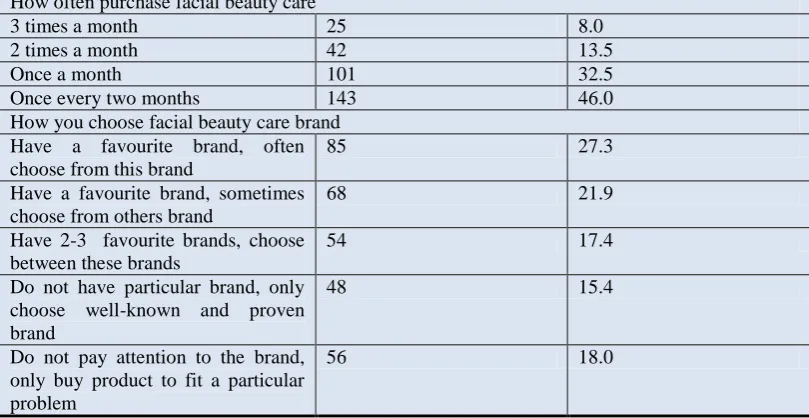
How often purchase facial beauty care
3 times a month 25 8.0
2 times a month 42 13.5
Once a month 101 32.5
Once every two months 143 46.0
How you choose facial beauty care brand Have a favourite brand, often choose from this brand
85 27.3
Have a favourite brand, sometimes choose from others brand
68 21.9
Have 2-3 favourite brands, choose between these brands
54 17.4
Do not have particular brand, only choose well-known and proven brand
48 15.4
Do not pay attention to the brand, only buy product to fit a particular problem
56 18.0
Table 1: Summary of Demographic Characteristics
Table 1 summarises the demographic characteristics of the target respondents. As shown, most respondents are between 21 to 30 years old (72.7%), and earn monthly income of less than RM1, 000 (54.35%). Most of the respondents are single (88.4%). Furthermore, most respondents purchase beauty products once every two months (46.0%) followed by once a month (32.5%) and 2 times a month (13.5%) and 3 times a month (8.0%).
Moreover, most of the respondents have one favourite brand and usually, they will purchase facial beauty products from the same brand (27.3%), meanwhile, 21.9% of the respondents favour one facial brand but sometimes, they also purchase products from others brands. There are also some respondents who do not have any brand preference, and will only purchase a product that fits their needs.
4.1. Data Analysis
The PLS SEM technique was used to validate the underlying theory for this study. The PLS SEM technique was chosen for data analysis due to the lower model complexity and the lenient requirements of the measurement model
and Hair et al. (2007). In this light, the variables in the study are reflective constructs which require construct
validity evaluation. Furthermore, the convergent and discriminating validity of the constructs were determined. In the meantime, based on Fornell guideline, the factor loading factor (FL), the average variance extracted (AVE) and the composite reliability (CR) were identified to find the model’s convergence validity. Table 2 presents the FL, AVE and CR of the study’s measurement model.
Based on the result below, item BL2 and item PQ3 were eliminating due to the presence of outer loading.
Table-2. Assessment of Convergent Validity
Items FL CR AVE
Actual Buying
AB1 I often buy facial beauty care brands. 0.741 0.883 0.602 AB2 I often buy facial beauty care brands on regular basis. 0.713
AB3 I often buy facial beauty care brands for my appearance. 0.842 AB4 I often buy facial beauty care brands that are safety to use. 0.768 AB5 I often buy facial beauty care brands because it can
improve my skin.
0.808
Perceived Quality
PQ1 I believe my preferred facial beauty care brand has a very high quality.
0.866 0.883 0.654
PQ2 I see my preferred facial beauty care brand is better than other brands in terms of colour, shape and appearance.
0.789
PQ4 I know my preferred facial beauty care brand shows good quality.
0.813
PQ5 My preferred facial beauty care brand lasts longer than other brands.
0.764
Brand Loyalty
BL1 I am loyal to my preferred facial beauty care brand. 0.712 0.843 0.574 BL3 I will recommend my preferred facial beauty care brand
to others.
0.761
BL4 I’ll buy my preferred facial beauty care brand even if the price goes up.
BL5 I regularly buy my preferred facial beauty care brand. 0.786 Brand Trust
BT1 My preferred facial beauty care brand has high integrity. 0.772 0.926 0.715 BT2 I feel secure with my preferred facial beauty care brand
because I know it will not let me down.
0.885
BT3 I feel confident with my preferred facial beauty care brand name.
0.854
BT4 Overall, I trust my preferred facial beauty care brand. 0.884 BT5 I can rely on my preferred facial beauty care brand. 0.827
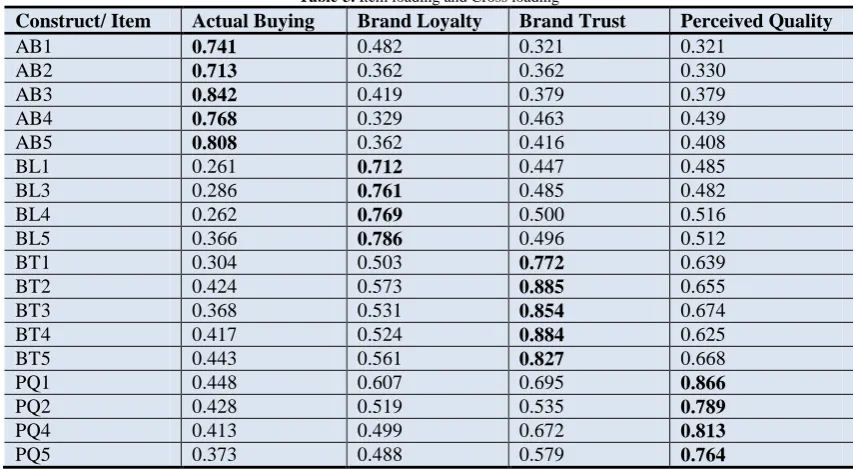
Table 2 summarises the convergent validity assessments of all variables exceed the AVE value threshold of 0.6, except for brand loyalty (0.574). The AVE value of each item ranged from 0.602 to 0.715. The results show good CR score (which range from 0.843 to 0.926). This supports that the measurement has a fair convergent validity. Table 3 shows the cross loading of every item. It can be observed that there is a higher loading value for this respective construct compared to other constructs.
Table-3. Item loading and Cross loading
Construct/ Item Actual Buying Brand Loyalty Brand Trust Perceived Quality
AB1 0.741 0.482 0.321 0.321
AB2 0.713 0.362 0.362 0.330
AB3 0.842 0.419 0.379 0.379
AB4 0.768 0.329 0.463 0.439
AB5 0.808 0.362 0.416 0.408
BL1 0.261 0.712 0.447 0.485
BL3 0.286 0.761 0.485 0.482
BL4 0.262 0.769 0.500 0.516
BL5 0.366 0.786 0.496 0.512
BT1 0.304 0.503 0.772 0.639
BT2 0.424 0.573 0.885 0.655
BT3 0.368 0.531 0.854 0.674
BT4 0.417 0.524 0.884 0.625
BT5 0.443 0.561 0.827 0.668
PQ1 0.448 0.607 0.695 0.866
PQ2 0.428 0.519 0.535 0.789
PQ4 0.413 0.499 0.672 0.813
PQ5 0.373 0.488 0.579 0.764
The discriminant validity is obtained by ascertaining the differences the item’s loading, cross-loading value and comparing these values with the construct’s AVE value and the correlation coefficients of other constructs. In this case, items AVE square root should be higher compared to the correlation coefficients of the other items.
Table 4 illustrates the results of the Heterotrait-Monotrait (HTMT) assessment of discriminant validity. It can be observed all items score less than 0.90. The results of the tests demonstrate that the model does not achieved discriminant validity.
Table-4. Evaluation of Discriminant Validity
Item/ Construct Actual Buying Brand Loyalty Brand Trust Perceived Quality Actual Buying
Brand Loyalty 0.628
Brand Trusr 0.576 0.772
Perceived Quality 0.574 0.828 0.889
*BOLD value is the square root of AVE
Table-5. Path Analysis
Path Beta Standard
Deviation
T- value LL UL Result
BL -> AB 0.275 0.071 3.878 0.153 0.387 Supported BT -> AB 0.224 0.089 2.518 0.069 0.363 Supported PQ -> AB 0.132 0.087 1.524 -0.012 0.273 Not Supported
0.132). It also shows that the variables on brand (T-value > 1.96), specifically brand loyalty (4.452) and brand trust (3.574) are significantly linked with actual purchases behaviour, while perceived quality (1.524) is not significantly linked with actual purchase behaviour. The confidence intervals indicate the value of the lower level and upper level of these three variables (PQ (LL) = -0.012, PQ (UL) = 0.273, (BL (LL) = 0.194, BL (UL) = 0.417) and (BT (LL) = 0.149, BT (UL) = 0.413). Thus, the hypotheses on brand loyalty and brand trust were supported while the hypotheses on perceived quality were not supported.
5. Limitation and Recommendation
The quantitative research method was used in this research. It provides sufficient information on the contextual aspects and provides further understanding and clarifies the variations in respondents’ preferences. In this light, the respondents could only provide an answer according to the quantitative value rather than providing detailed information about their experience using facial beauty care products, which could take more time and cost. This study was also administered for respondents who fulfil the characteristics of the target respondents.
To overcome the limitations of this study, it is recommended for future researchers to adopt either a mixed-method studies or qualitative research mixed-method. This will provide respondents to give their own perception and recommendation about facial beauty care brands as users of beauty products. Other than that, researchers can use online surveys to collect data in lesser cost and time. At the same time, the model can be validated using different method and setting to develop the concept of branding.
6. Conclusion
There is an on-going concern over the quality and safety of local facial beauty care products in Malaysia. It could be argued that Malaysian consumers still have limited awareness towards about quality before making the purchasing decision (Zulkiffli, 2017). At the same time, there is still a lack of studies regarding brand trust in facial beauty care industry. Brand trust is a new item that was included in the model to determine customer-based brand equity related to facial beauty care products among female consumers in Malaysia. Thus, this study investigates how brand trust and consumer perceived quality towards facial beauty care products will influence their purchasing behaviour. This research presents a novel attempt to examine the perceived quality model in the context of Malaysian facial beauty care products. The findings of this study could ensure greater understanding in the near future, despite the limitations, it is hoped that researchers and brand owners/managers can use this study's findings as a guideline.
References
Alhedhaif, S., Lele, U. and Kaifi, B. A. (2016). Brand loyalty and factors affecting cosmetics buying behavior of saudi female consumers. Journal of Business Studies Quarterly, 7(3): 2152.
Bianchi, C., Pike, S. and Lings, I. (2014). Investigating attitudes towards three South American destinations in an emerging long haul market using a model of consumer-based brand equity (CBBE). Tourism Management,
42: 215–23. Available: https://doi.org/10.1016/j.tourman.2013.11.014
Carrington, M. J., Neville, B. A. and Whitwell, G. J. (2010). Why ethical consumers don’t walk their talk: Towards a framework for understanding the gap between the ethical purchase intentions and actual buying behaviour of ethically minded consumers. Journal of Business Ethics, 97(1): 139–58. Available: https://doi.org/10.1007/s10551-010-0501-6
Cavana, R. Y., Delahaye, B. L. and Sekaran, U. (2001). Applied business research qualitative and quantitative methods. John Wiley and Sons Ltd: Milton. 472.
Cobb-Walgren, C. J., Ruble, C. A. and Donthu, N. (1995). Brand equity, brand preference, and purchase intent.
Journal of Advertising, 24(3): 25–40. Available: https://doi.org/10.1080/00913367.1995.10673481
Doniyor, A. (2013). Country of origin and brand loyalty on cosmetic products among Universiti Utara Malaysia students. Atlantic Review of Economics, 2: 1–40. Available: http://repo.uum.edu.my/15221/
Fayrene, C. and Lee, G. C. (2011). Customer- based brand equity: A literature review. Journal of Arts Science and Commerce, 2(1): 33–42.
Hair, J. F., Money, A. H., Samouel, P. and Page, M. (2007). Research methods for business. John Wiley and Sons Ltd: West Sussex.
Hanaysha, J. (2016). The importance of social media advertisements in enhancing brand equity: A study on fast food restaurant industry in Malaysia. International Journal of Innovation, Management and Technology, 7(2): 46–51. Available: https://doi.org/10.18178/ijimt.2016.7.2.643
Hellsten, J. and Wåhlin, S. N. (2017). The beauty of brand loyalty - a case study of how marketers view millennials’ brand loyalty in the beauty industry. Umeå School of Business and Economics Spring. 1–66.
Ismail, R. M. (2014). Mediation impact of mnufacturing strategies on external environmental factors and manufacturing performance.
Joseph, F., Hair, J., Hult, G. T. M., Ringle, C. M. and Sarstedt, M. (2014). A primer on partial least squares structural equation modelling (PLS-SEM. Sage Publication Inc.
July, B. M., Hawley, J. and Hawley, J. M. (2016). Measuring customer-based brand equity : Empirical evidence from the sportswear market in China Measuring customer-based brand equity : empirical evidence from the sportswear market in China. Available: https://doi.org/10.1108/10610420910972783
Kabadayi, E. T. and Alan, A. K. (2012). Brand trust and brand affect: Their strategic importance on brand loyalty.
Journal of Global Strategic Management, 6(1): 80–88. Available: https://doi.org/10.20460/JGSM.2012615788
Mashavha, L. E. (2016). Measuring the influence of brand loyalty on cosmetics purchase intentions of south african female consumers. Association of MBAs. 1–69.
Moslehpour, M., Wong, W. K., Van Pham, K. and Aulia, C. K. (2017). Repurchase intention of Korean beauty products among Taiwanese consumers. Asia Pacific Journal of Marketing and Logistics, 29(3): 569–88. Available: https://doi.org/10.1108/APJML-06-2016-0106
Nellikunnel, S., Rahman, A., Jawaid, A. and Sim, L. E. (2015). Generation Y male cosmetic consumption patterns : regression modelling Syriac Nellikunnel, Abdul Rahman. Arif Jawaid and Lim. Eng. Sim., 5(2): 154–76. Sekaran, U. and Bougie, R. (2016). Research method for business a skill-building approach seventh edition. 7th
edn: 1–447.
Simon, M. (2011). Conducting pilot studies. In dissertation and scholarly research: Recipes for success. (report). Walangitan, A., Pangemanan, S. S. and Rumokoy, F. S. (2015). Analysing the impact of brand equity on consumer
purchase intention of etude house cosmetic product in manado. Jurnal E. M. B. A., 3(2): 758–66.
Wee, C. S., Ariff, M. S. B. M., Zakuan, N. and Tajudin, M. N. M. (2014). Consumers perception, purchase intention and actual purchase behavior of organic food products. Bus. Econ. Res.Online, 3(2): 378–97. Available: https://doi.org/10.1017/CBO9781107415324.004
Yeung, M. and Ramasamy, B. (2012). Are shocks to brands permanent or transient ? Journal of Brand Management,
17(2004): 758–71. Available: https://doi.org/10.1057/bm.2012.30
Yoo, B., Donthu, N. and Lee, S. (2000). An examination of selected marketing mix elements and brand equity.
Journal of the Academy of Marketing Science, 28(2): 195–211. Available: https://doi.org/10.1177/0092070300282002
![Design, synthesis, and biological study of 4-[(2-nitroimidazole-1H-alkyloxyl)aniline]-quinazolines as EGFR inhibitors exerting cytotoxicities both under normoxia and hypoxia](data:image/gif;base64,R0lGODlhAQABAIAAAP///wAAACH5BAEAAAAALAAAAAABAAEAAAICRAEAOw==)