I. Introduction
A
user identification process attempts to determine who an individual is based on the information provided, and the verification process involves confirming the claimed identity of an individual. All existing security access methodologies consider one or more of the following three basic factors: Knowledge (e.g. password), Possessions (e.g. ATM card), and biological traits (e.g. fingerprint, voice, and retina) [1].These methodologies are subject to be lost, theft or forgery; Electroencephalogram (EEG) signals are relatively new biological traits which are recently explored for user identification and verification processes due to its robustness against forgery and theft unlike traditional biometrics [2], [3].
There have been various proposed approaches for EEG based user recognition system, Palaniappan in [4] and [5] proposed to use EEG signals for user identification and verification, respectively. The authors proposed features of Autoregressive (AR) coefficients, channel spectral powers, inter-hemispheric channel spectral power differences, linear and the non-linear complexity of inter-hemispheric channel from 6 channels, Linear Discriminant Classifier (LDC) was used to achieve best identification result (i.e., 100%) with features combined from Rotation, Math., Letter, Baseline tasks, whereas for verification mode the author proposed a two stage authentication approach with same features in [4] and used Manhattan distance. The best achieved result
was obtained with False Accepted Rate (FAR) and False Rejected Rate (FRR) equal to zero using 6 channels belong to single task, testing five subjects from CSU dataset [4]. The author used multiple feature types, more than one channel and mental tasks to identify the subject or verify the input identity. In this paper, for each proposed system one type of features is used, two channels and one mental task are used for identification and verification purposes.
Altahat et al. [4] discussed the reduction of required EEG channels of the EEG based verification system. Signal Power Spectral Density (PSD) was considered as features; the best achieved HETR was (14.69%) using 8 channels when the system was tested on (106) subjects from MMI dataset. In this paper, the energy density of DFT or DCT power spectra are proposed as features from two channels only.
Bajwa and Dantu [5] suggested features for EEG authentication system using statistical information of Daubechies (db8) wavelet transform sub-bands after applying the Fast Fourier Transform (FFT) on the EEG signal. Two types of classifiers were tested: Support Vector Machine (SVM) and Bayesian network; and they achieved the best accuracy rate (100%) when the system was tested on 7 subjects from CSU dataset. In this study, Daubechies (db4) with some statistical moments are considered as features, and the energy distribution of DFT spectra is considered as another feature set.
For identification mode, Yang et al. (2012) [6] proposed the use of wavelet transform for extracting features from raw EEG signals by calculating the mean and standard deviation of 5 sub-bands for 8 channels generating a feature vector with 80 features. In this paper, seven types of statistical moments are calculated for six sub-bands and for two channels generating a feature pool that contains 84 features. They proposed two classifiers Support Vector Machine (SVM),
Keywords
EEG, Wavelet Transforms, DCT, DFT, Energy Features, Statistical Moments, Euclidean Measure.
Abstract
In this study, the approach of combined features from two simultaneous Electroencephalogram (EEG) channels when a user is performing a certain mental task is discussed to increase the discrimination degree among subject classes, hence the visibility of using sets of features extracted from a single channel was investigated in previously published articles. The feature sets considered in previous studies is utilized to establish a combined set of features extracted from two channels. The first feature set is the energy density of power spectra of Discrete Fourier Transform (DFT) or Discrete Cosine Transform; the second one is the set of statistical moments of Discrete Wavelet Transform (DWT). Euclidean distance metric is used to accomplish feature set matching task. The combinations of features from two EEG channels showed high accuracy for the identification system, and competitive results for the verification system. The best achieved identification accuracy is (100%) for all proposed feature sets. For verification mode the best achieved Half Total Error Rate (HTER) is (0.88) with accuracy (99.12%) on Colorado State University (CSU) dataset, and (0.26) with accuracy (99.97%) on Motor Movement/Imagery (MMI) dataset.
* Corresponding author.
E-mail addresses: [email protected] (L. E. George), [email protected] (H. A. Hadi).
DOI: 10.9781/ijimai.2018.12.008
User Identification and Verification from a Pair of
Simultaneous EEG Channels Using Transform Based
Features
Loay E. George
1, Hend A. Hadi
2*
1
College of Science, Remote Sensing and GIS, University of Baghdad, Baghdad (Iraq)
2
Ministry of Education, General Directorate of Education-Karkh III, Baghdad (Iraq)
and k-nearest neighbor classifier to recognize the individuals. A comparison of two kinds of tasks was conducted: motor movement and motor imagery. Their study indicated that imagery tasks show better performance than motor movement tasks. The system was tested on 18 subjects from the Motor/Movement Imagery dataset, the best achieved recognition rate when using SVM classifier was 97.4%.
Daria La Rocca et al. [7] produced an approach based on the fusion of spectral coherence-based connectivity; they fused features from two channels for a single task. They proposed Power Spectral Density (PSD) and Spectral Coherence Connectivity as features; they used a Mahalanobis distance-based classifier to classify (108) subjects from Motor Movement /Imagery dataset, the best achieved accuracy was (100%).
Kumari and Vaish [8] discussed in their paper the fusion of features that were extracted from different mental tasks using canonical correlation analysis from two mental tasks and 6 channels. They proposed to use Empirical Mode Decomposition (EMD), Information Theoretic Measure (ITM) and statistical measurement to extract features. They classified 7 subjects of CSU dataset using Learning Vector Quantization Neural Network (LVQNN) and its extension (LVQ2); they achieved an accuracy of (96.05%). One type of features from two channels and single task are fused in this study to generate the feature vector.
Kumari and Vaish [9] focused in their study on the comparison between the motor movement task and the imagery task. They proposed different methods of Daubechies wavelet transform and different energy methods as features, and then they used Artificial Neural Network (ANN) to classify 5 subjects from Motor Movement/ Imagery dataset, achieving True Accepted Rate (TAR) of (95%). In this paper, the Daubechies (db4) wavelet transform was considered with some of the statistical moments as features from two channels belonging to a single task, the statistical moments are applied on each sub-band, and the statistical distance measure was adopted for matching stage.
Yang et al. [10] discussed the sensitivity of EEG-based recognition system to the type of mental tasks; they proposed Daubechies (db4) packet decomposition and calculated the standard deviation of each sub-band as features. Features from different tasks and electrodes (9 electrodes) were fused to generate the final features vector, then they fed to Linear Discriminant Analysis (LDA) classifier to classify (108) subjects from MMI dataset. The best achieved CRR was (99%) for identification mode whereas they achieved a best verification result with Equal Error Rate (EER=4.5).
However, to make EEG-based user identification and verification system applicable, fast, and accurate, the system must go through few and uncomplicated stages. Also, the acquisition process should be easy and simple so as not to disturb the user. Therefore, the least number of electrodes (or channels) must be attached to the user's scalp, and a minimum number of mental tasks must be asked to be performed by the user. These main problems are discussed in this study in which simple, fast, and different methods are proposed using only two EEG channels when the user is performing one mental task, in order to reduce system complexity while maintaining high system accuracy.
In previous work, [11], [12] and [13] the approach of extracting features from single EEG channels when the user is performing certain mental task was discussed, to keep the complexity of the recognition system as less as possible; competitive results were achieved. In this work, the approach of extracting features from two simultaneous EEG channels when the user is performing one task is discussed, to increase the discrimination ratio of the classes and enhance the performance of the recognition system, using the same feature types proposed in the above mentioned previous works.
This paper is organized as follows: Section II presents the description of used datasets and the proposed methods, Section III discusses the
experiments result, Section VI discusses previous works related to this paper, and Section V presents conclusions.
II. Methodology
In this study, The EEG-based identification and verification system is based on the approach of combined features from two simultaneous EGG channels through the following main stages: (i) Feature extraction stage which in turn comprises three steps; the first step is aimed to transfer the input EEG signal to either frequency domain or scale-shift domain, whereas the second one is aimed to extract the main features from the transformed signal. The third step is feature analysis and combination stage which is aimed to select and combine the more related and discriminated features from two EEG channels belong to the same task to prepare the final feature vector to be the input to the matching stage to make the final decision.
The main problem facing the automatic EEG identification and verification system is the suitable selection of discriminative features from the EEG signal. Extraction of EEG features is conducted in different domains such as the time domain or the frequency domain. The most used feature extraction methods for EEG biometric systems are AR modeling, Power Spectral Density (PSD), the energy of EEG channels and wavelet packet decomposition (WPD) [3].
A. Datasets
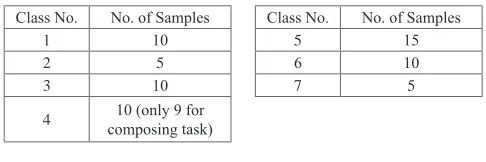
Two public and free datasets which are used and described in [11] and [13] are also tested in this study. The first one is the Colorado State University dataset which is a small dataset that consists of the recordings of 7 healthy volunteers, collected by Keirn and Aunon [14], whereas the second one is Motor Movement/Imagery dataset which is a relatively large dataset that consists of EEG recordings of 109 healthy volunteers; it was described in [15]. The number of samples in each class in CSU dataset is shown in Table I (Note: class 4 has 9 samples for the letter-composing task because of the error occurred in the dataset and mentioned in [8], [14]), whereas in MMI datasets each class consists of 3 samples.
TABLE I. The Number of Samples for Each Class in CSU Dataset Class No. No. of Samples Class No. No. of Samples
1 10 5 15
2 5 6 10
3 10 7 5
4 composing task)10 (only 9 for
B. Proposed System
The proposed methods in [12], [11], and [13] which worked under the approach (using a single channel and a single task) are tested in this study under the second approach (combining features from two channels belonging to the same task).
1) Proposed Features
Two separate sets of features were used for the identification and verification system in previous studies; these are the energy distribution features and statistical moments features:
a) Energy Distribution Features
(1)
(2)
Where C(u) and F(u) are the uth AC coefficient of the DCT and DFT,
respectively, and s() is the input EEG signal.
(3)
Where T(i) represents the F(u) or C(u) coefficients array; �𝑒𝑛(𝑗) is the energy average of jth band; L is the number of coefficients belongingto each band; j=0…(N-1)/L which is the total number of bands. The array en() is considered the feature vector.
b) Statistical Moments Features
The second set of features is the statistical moments of Discrete Wavelet Transforms sub bands.Three types of DWT were proposed to use in previous works: Haar Wavelet Transform which is described by (4) and (5) [18]. Daubechies Wavelet Transform (db4) which is described by (6) and (7) [19], and Bi-orthogonal (Tap9/7) Transform which is described by (8-13) [20]:
(4)
(5)
Where i=0…N/2; N is the length of the input signal; L () is theapproximation coefficients; h () is the detailed coefficient.
(6)
(7)
Where, i∈{0,..,(N/2)-1}, j∈{0,..,N-3}, and k∈{0,..,3}. The scale values (α) and wavelets (β) are given below:α1= (1+√3)/ (4√2), α2= (3+√3)/ (4√2) α3= (3-√3)/ (4√2), α4= (1-√3)/ (4√2) β1= α4, β2= - α3
β3= α2, β4= - α1
The bi-orthogonal (Tap9/7) wavelet transform is applied through three consecutive phases: (i) split phase (ii) lifting phase which is described by (8-11) (iii) scaling phase which is described by (12) and (13) [20]:
Y(2n+1)= s(2n+1)+a[s(2n)+s(2n+1)]
(8)
Y(2n)= s(2n)+b[s(2n-1)+s(2n+1)]
(9)
Y(2n+1)= Y(2n+1)+c[Y(2n)+Y(2n+2)]
(10)
Y(2n)= Y(2n)+d[Y(2n-1)+Y(2n+1)]
(11)
Y(2n)= Y(2n) / k
(12)
Y(2n+1)= -k x Y(2n)
(13)
Where a= -1.586134342, b= -0.052980118, c=0.8829110762, d=0.4435068522, and k=1.230174105
Following equations describe the two sets of statistical moment which are proposed to be applied on the extracted sub-bands.
The 1st Statistical Moments Set is described by (14) whereas a 2nd set is described by (16):
(14)
Where S(i) is the ith coefficient of the sub-band, k is the sub-bandlength, and is the mean which is determined as:
(15)
(16)
Where ΔS(i)=S(i)-S(i+1) for (i=0,…, p-2), and is the average of ΔS(i) as described by (15), and the power n is taken (0.5, 0.75, 1, 2, and 3).2) Two Simultaneous EEG Channels Feature Analysis and
Combination
In this stage the features from two simultaneous EEG channels when the user is performing a certain task are combined to make one feature pool, then the pool size is reduced by applying feature analysis and combination by selecting the most related and discriminated features with lowest within distance and highest between variations to make a final feature vector which led to best recognition and verification accuracy [21][17].
3) Matching Stage
In this stage, the normalized Euclidean distance measure (nMSD) is proposed to calculate the distance between the input pattern and the stored templates(s) to make the final decision which either to identify the user identity in identification mode or to verify the claimed identity based on similarity distance threshold in verification mode. nMSD is given by (17) [22]:
(17)
Where Si is the samples belonging to the ith class, Tj is the templatefeature vector of the jth class, and σ
j is the standard deviation vector of
the jth template.
III. Experimental Results
The experimental study of the second approach (combined features from two EEG channels) was conducted on both considered datasets, and the accuracy of verification and identification system with all proposed features was tested. The second adopted approach enhanced the performance of all suggested features for the identification mode, whereas, for the verification mode, the performance of some methods with the first approach (using one EEG channel) is better than with the second approach.
A. Identification and Verification Experimental Results
check the identification system accuracy [17]. The system was partially trained with 67.66% of total samples of each class for CSU dataset, whereas for MMI dataset each class has three samples; so two samples are used for training in which each one is considered as a template, and one sample is used to test the system.
(18)
The Receiver Operating Characteristic (ROC) Curve is the most used statistical tool for describing the verification system behavior by plotting the False Accepted Rate (FAR)which is given by (19) and measures the average of accepted imposter patterns, against the False Rejected Rate (FRR) which is given by (20) and measures the average of rejected genuine patterns, at various threshold settings to obtain the intersection point between FRR and FAR so the Half Total Error Rate (HTER) can be calculated using (20) to evaluate the performance of the verification system [23], [24]:(19)
(20)
(21)
So the accuracy of the verification system can be calculated using (22):(22)
Where P refers to the genuine patterns; and N refers to the imposter patterns [24].1) Experimental Results of Energy Features of DFT Bands
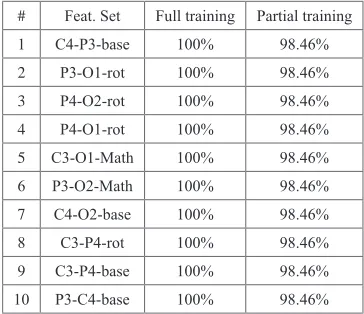
The result of combining the features of DFT energy distribution extracted from two EEG channels; are shown in this section. Tables II and III show some of the identification results when the method is applied to CSU and MMI datasets, respectively. Tables IV and V show some of the verification results of the both datasets.TABLE II. CRR of Some Tested Feature Sets Using the Energy of DFT Bands, CSU Dataset
# Feat. Set Full training Partial training
1 C4-P3-base 100% 98.46%
2 P3-O1-rot 100% 98.46% 3 P4-O2-rot 100% 98.46% 4 P4-O1-rot 100% 98.46% 5 C3-O1-Math 100% 98.46%
6 P3-O2-Math 100% 98.46%
7 C4-O2-base 100% 98.46%
8 C3-P4-rot 100% 98.46% 9 C3-P4-base 100% 98.46% 10 P3-C4-base 100% 98.46%
TABLE III. CRR of Some Tested Feature Sets Using the Energy of DFT Bands, MMI Dataset
# Feat. Set Full Training Partial Training
1 Cz-O1-Task1 100% 100%
2 Fc1-O1-Task1 100% 100%
3 Cp2-Af4-Task4 100% 100% 4 F4-P6-Task4 100% 100% 5 Fcz-O2-Task1 100% 99.69%
6 P7-Oz-Task1 100% 99.69%
7 Fc2-Iz-Task1 100% 99.69%
8 F1-P5-Task1 100% 99.69% 9 Fz-Po3-Task1 100% 99.69% 10 Fc1-Fpz-Task1 100% 99.69%
TABLE IV. FRR, FAR, Accuracy, and HTER of Some Tested Feature Sets Using the Energy of DFT Bands, CSU Dataset
Feat. Set Thr. FRR FAR Acc. HTER C4-P3-base 11.1 1.43 1.56 98.46% 1.49 P3-O1-rot 10.1 1.43 1.58 98.46% 1.51 P4-O2-rot 9.7 2.38 2.47 97.58% 2.42 P4-O1-rot 7.5 2.86 2.39 97.58% 2.62 C3-O1-Math 10.3 2.86 3.84 96.48% 3.35
TABLE V. FRR, FAR, Accuracy, and HTER Of Some Tested Feature Sets Using the Energy of DFT Bands, MMI Dataset
Feat. Set Thr. FRR FAR Accuracy HTER Af4-O2-Task4 21.3 0.31 0.21 99.79% 0.26
P7-Oz-Task1 20.3 0.31 0.27 99.73% 0.29 C2-T9-Task1 24.1 0.31 0.30 99.70% 0.30 Af3-Oz-Task4 20.6 0.31 0.34 99.66% 0.32 Cz-O1-Task1 24.4 0.31 0.35 99.65% 0.33 F1-P5-Task1 22.8 0.31 0.38 99.62% 0.34 Fz-Po3-Task1 22.4 0.31 0.39 99.62% 0.35 Fc2-Iz-Task1 22.7 0.31 0.39 99.61% 0.35 Fpz-P3-Task4 21.2 0.31 0.42 99.58% 0.36 Fc1-O1-Task1 25.1 0.31 0.44 99.56% 0.38
2) Experimental Results of Energy Features of DCT Bands
Tables VI and VII show some of the achieved identification results for the DCT bands energy distribution features when the proposed system is applied on both datasets, whereas Tables VIII and IX show some the achieved verification results.TABLE VI. CRR of Some Tested Feature Sets Using the Energy of DCT Bands, CSU Dataset
# Feat. Set Full training Partial training
1 C3-P4-Rot 100% 100%
2 C4-O2-Base 100% 98.46% 3 P3-O1-Math 100% 98.46% 4 P3-O2-Math 100% 98.46% 5 P4-O2-Lett 100% 98.44%
6 C4-O2-Rot 100% 98.44%
7 P3-P4-Rot 100% 98.44%
TABLE VII. CRR of Some Tested Feature Sets Using the Energy of DCT Bands, MMI Dataset
# Feat. Set Full training Partial training
1 Afz-P7-Task4 100% 100%
2 F7-O2-Task4 100% 100% 3 Fc6-P4-Task4 100% 100% 4 F7-P6-Task4 100% 100% 5 Fp2-P6-Task4 100% 100%
6 Cp1-Iz-Task4 100% 100%
7 Cpz-Oz-Task4 100% 100%
8 Fcz-F6-Task4 100% 99.69% 9 C1-Af3-Task4 100% 99.69% 10 Cz-Fp1-Task4 100% 99.69%
TABLE VIII. FRR, FAR, Accuracy, and HTER Using the Energy of DCT Bands, CSU Dataset
Feat. Set Thr. FRR FAR Accuracy HTER P3-O2-Math 9.6 0.95 1.12 98.90 1.03
C3-P4-Rot 17.0 2.38 2.39 97.58 2.39 P4-O2-Lett 17.1 2.38 2.39 97.58 2.39 C4-O2-Base 9.7 2.86 2.63 97.36 2.74 P3-O1-Math 9.3 2.38 2.73 97.36 2.55
TABLE IX. FRR, FAR, Accuracy, and HTER of the Energy of Sliced DCT Spectra Features, MMI Dataset
Feat. Set Thr. FRR FAR Accuracy HTER Cp1-Iz-Task4 19.6 0.31 0.22 99.78% 0.26 Fp2-T9-Task4 19.3 0.31 0.25 99.75% 0.28 Cpz-Oz-Task4 18.8 0.31 0.25 99.74% 0.28 T7-O2-Task1 19.2 0.31 0.28 99.72% 0.29 Fz-Po7-Task1 20.0 0.31 0.30 99.70% 0.30 Fp1-Pz-Task4 20.1 0.31 0.31 99.69% 0.31 Po4-Iz-Task1 19.2 0.31 0.31 99.69% 0.31 Cpz-Iz-Task1 19.8 0.31 0.31 99.69% 0.31 F7-O2-Task4 20.3 0.31 0.36 99.64% 0.33 Af3-O2-Task1 20.1 0.31 0.36 99.64% 0.33
3) Experimental Results of Statistical Moments Features of
Haar Wavelet Transform
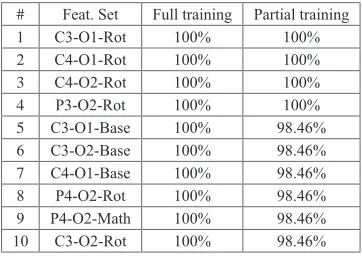
Tables X and XI present the results of some conducted tests of the introduced identification system using Haar wavelet transform with the 2nd set of statistical moments that is applied to CSU and MMI datasets, respectively. Tables XII and XIII show some conducted verification results on both datasets.
TABLE X. CRR of Some Tested Feature Sets Using the Statistical Moments of HWT Bands, CSU Dataset
# Feat. Set Full training Partial training
1 C3-O1-Rot 100% 100%
2 C4-O1-Rot 100% 100% 3 C4-O2-Rot 100% 100% 4 P3-O2-Rot 100% 100% 5 C3-O1-Base 100% 98.46%
6 C3-O2-Base 100% 98.46%
7 C4-O1-Base 100% 98.46%
8 P4-O2-Rot 100% 98.46% 9 P4-O2-Math 100% 98.46% 10 C3-O2-Rot 100% 98.46%
TABLE XI. CRR of Some Tested Feature Sets Using the 2nd Statistical
Moments Set of HWT Bands, MMI Dataset
# Feat. Set Full training Partial training
1 F7- O1 -Task4 100% 99.39%
2 Fz-Po4 -Task4 100% 99.08% 3 F6-Oz -Task4 100% 99.08% 4 Fc2-F8-Task4 100% 99.39% 5 F4-Po4-Task4 100% 99.08%
6 Cz-Af4-Task4 100% 98.78%
7 Afz-O1-Task4 100% 98.78%
8 Fp2-Po8-Task4 100% 98.47% 9 Fp1-Oz-Task4 100% 98.78% 10 Cp1-F8-Task4 100% 98.47%
TABLE XII. FRR, FAR, Accuracy and HTER Using the 2nd Statistical
Moments Set of HWT Bands, CSU Dataset Feat. Set Thr. FRR FAR Accuracy HTER C3-O1-Rot 10.2 1.4 1.3 98.7 1.4 C4-O1-Rot 12.1 1.4 1.6 98.5 1.5 C4-O2-Rot 10.0 1.4 1.6 98.5 1.5 P3-O2-Rot 10.0 2.9 2.9 97.4 2.9 C3-O1-Base 11.2 2.4 2.4 97.6 2.4
TABLE XIII. FRR, FAR, Accuracy and HTER Using the 2nd Statistical
Moments Set of HWT Bands, MMI Dataset Feat. Set Thr. FRR FAR Accuracy HTER F6-Poz-Task4 19.8 0.31 0.41 99.59% 0.36 F7-O1 -Task4 15.4 0.31 0.45 99.55% 0.38 Fp1-Iz-Task4 22.3 0.31 0.50 99.51% 0.40 Fp1-Oz-Task4 18.6 0.61 0.49 99.51% 0.55 Fp2-Po8-Task4 17.4 0.61 0.51 99.49% 0.56 Fz-Po4-Task4 20.8 0.61 0.53 99.47% 0.57 Afz-O1-Task4 18.1 0.61 0.65 99.35% 0.63 Cp1-F8-Task4 19.6 0.61 0.66 99.34% 0.63 F6-P2-Task4 19.6 0.61 0.66 99.34% 0.63 Fc2-Iz-Task4 20.5 0.61 0.77 99.23% 0.69
4) Experimental Results of Statistical Moments Features of
Daubechies (db4) Wavelet transform
Tables XIV and XV show some of the conducted tests results of the identification system based on Daubechies wavelet transform (db4) with the 2nd set of statistical moments on CSU dataset and 1st statistical moments on MMI dataset. Tables XVI and XVII show some conducted verification results on both datasets.
TABLE XIV. CRR of Some Tested Feature Sets Using the Statistical Moments of db4 Bands, CSU Dataset
# Feat. Set Full training Partial training
1 C4-O1-Rot 100% 100%
2 C4-O2-Rot 100% 100% 3 P3-P4-Rot 100% 100% 4 P4-O1-Rot 100% 100% 5 P4-O2-Rot 100% 100%
6 C3-O2-Lett 100% 98.44%
7 C3-O1-Base 100% 98.46%
TABLE XV. CRR of Some Tested Feature Sets Using the Statistical Moments of db4 Bands, MMI Dataset
# Feat. Set Full training Partial training
1 Af8-P3-Task4 100% 100%
2 Af8-Poz-Task4 100% 100% 3 Fp1-Po4-Task4 100% 99.69% 4 Fpz-Po4-Task4 100% 99.69% 5 Af8C56-Task4 100% 99.69%
6 T10-C48-Task4 100% 99.69%
7 Af8-Po4-Task4 100% 99.69%
8 Af8-Iz-Task4 100% 99.69% 9 Fc3-O1-Task4 100% 99.39% 10 Fcz-Po4-Task4 100% 99.39%
TABLE XVI. FRR, FAR, Accuracy and HTER Using the 2nd Statistical
Moments Set of db4 Bands, CSU Dataset Feat. Set Thr. FRR FAR Accuracy HTER C3-O2-Lett 6.9 0.95 1.04 98.88 1.00 C4-O2-Rot 8.0 1.43 1.04 0.99 1.23 C4-O1-Rot 10.6 1.43 1.32 98.68 1.38 P4-O2-Rot 10.3 1.43 1.35 98.68 1.39 C3-O1-Base 11.5 1.43 1.58 98.46 1.51
TABLE XVII. FRR, FAR, Accuracy and HTER Using the 2nd Statistical
Moments Set of db4 Bands, CSU Dataset Feat. Set Thr. FRR FAR Accuracy HTER Af8-Poz-Task4 23.1 0.31 0.31 99.69% 0.31 Af8-Po4-Task4 18 0.31 0.38 99.62% 0.34 Fp2-P8-Task4 19.4 0.31 0.38 99.62% 0.34 F2-Iz-Task1 24.6 0.31 0.37 99.63% 0.34 F7-Po4-Task4 19.1 0.31 0.44 99.56% 0.37 Fp1-Po4-Task4 22.5 0.31 0.49 99.51% 0.4
Af8-Iz-Task4 19.6 0.31 0.49 99.51% 0.4 Fcz-Po4-Task4 19.8 0.31 0.54 99.46% 0.42 Af3-Po3-Task4 22 0.61 0.47 99.53% 0.54
Fpz-Po4-Task4 22 0.61 0.48 99.52% 0.55
5) Experimental Results of Statistical Moments Features of TAP
9/7 Wavelet Transform
The best identification results of the system based on Statistical Moments of Tap9/7 Sub-bands are in Tables XVIII and XIX, whereas for verification system in Tables XX and XXI; for both datasets.
TABLE XVIII. CRR of Some Tested Feature Sets Using the Statistical Moments of Tap9/7 Bands, CSU Dataset
# Feat. Set Full training Partial training
1 P4-O2-Rot 100% 100%
2 P3-O2-Rot 100% 100% 3 C3-O2-Base 100% 100% 4 C3-O2-Rot 100% 100% 5 P3-O1-Rot 100% 100%
6 C4-O1-Rot 100% 98.46%
7 P4-O1-Rot 100% 98.46%
8 P4-O1-Math 100% 98.46% 9 C3-O2-Math 100% 98.46% 10 C3-P4-Rot 100% 98.46%
TABLE XIX. CRR of Some Tested Feature Sets Using the Statistical Moments of Tap9/7 Bands, MMI Dataset
# Feat. Set Full training Partial training
1 T10-P4-Task4 100% 100%
2 Fc1-Af8-Task4 100% 100% 3 Fp1-O2-Task4 100% 99.69% 4 Fpz-Po8-Task4 100% 99.69% 5 Fc3-P8-Task4 100% 99.69%
6 Fcz-O1-Task4 100% 99.69%
7 Fc2-Po7-Task4 100% 99.69%
8 C6-Po8-Task4 100% 99.69% 9 Cp3-Af8-Task4 100% 99.69% 10 Cp6-Af4-Task4 100% 99.69%
TABLE XX.FRR, FAR, Accuracy and HTER Using the 2nd Statistical
Moments Set of Tap9/7 Bands, CSU Dataset Feat. Set Thr. FRR FAR Accuracy HTER C4-O1-Rot 15.8 0.95 0.81 99.12 0.88 P4-O1-Rot 8.2 0.95 1.30 98.68 1.13 P4-O2-Rot 12.4 1.43 1.23 98.68 1.33 P3-O2-Rot 10.2 1.43 1.30 98.68 1.37 P4-O1-Math 8.1 1.43 1.52 98.46 1.47
TABLE XXI. FRR, FAR, Accuracy and HTER Using the 2nd Statistical
Moments Set of Tap9/7 Bands, MMI Dataset Feat. Set Thr. FRR FAR Accuracy HTER F6-Oz-Task4 22.2 0.31 0.24 99.76% 0.27 Fpz-Po8-Task4 17.9 0.31 0.30 99.70% 0.3 Cp3-Af8-Task4 19.5 0.31 0.31 99.69% 0.31
Fp1-O2-Task4 17.7 0.31 0.36 99.64% 0.33 Po4-Iz-Task1 22.4 0.31 0.37 99.63% 0.34 C6-Po8-Task4 18.8 0.31 0.38 99.62% 0.34 Af8-Po8-Task4 19.2 0.31 0.39 99.61% 0.35 Fcz-O1-Task4 20.3 0.31 0.40 99.60% 0.35 Fc2-Po7-Task4 18.3 0.31 0.42 99.58% 0.36 Af8-Poz-Task4 20.1 0.31 0.46 99.55% 0.38
B. Execution Time
The specification of the computer lap top that was used in the conducted tests is Intel® Core ™ i5-2450M CPU with (4GB) RAM, the operating system is windows7 (64bit), and the development programming language is Microsoft Visual C#. Table XXII shows the average elapsed time, (in milliseconds) of the proposed methods on both datasets for one signal only. Taking into consideration the recording time for each sample of CSU dataset is (10 sec) with the sampling rate (250 Hz), and the recoding time for MMI dataset is (1 minute) with the sampling rate (160 Hz).
TABLE XXII. The Average Processing Time Results (in msec) for CSU and MMI Datasets
CSU dataset MMI dataset
Proposed Method
Feature Extraction
Time
Proposed Method
Feature Extraction
Time
IV. Comparison With Related Works
In this section, the comparison between the two adopted approaches (using two EEG channels and using one EEG channel) and the comparison with the other recent related works are shown. Tables XXIII and XXIV show the comparisons of the results of the adopted (as 2nd) approach in this paper with the (1st) adopted approach in previously proposed work. The second approach combines the features from two channels belonging to the same task, so this approach also keep the complexity of the system low because the user is asked to perform only one mental task in the acquisition stage.
The comparison of the findings of this work and other related works for identification and verification modes are shown in Tables XXV and XXVI.
TABLE XXIII. The Results of the Proposed Methods Under the Two Approaches, Identification Mode
Proposed Method
First approach Second approach
Full training
Partial training
Full training
Partial training
CSU dataset
DFT 100% 100% 100% 98.46 DCT 100% 100% 100% 100% HWT 100% 98.46% 100% 100% Db4 100% 100% 100% 100% Tap9/7 100% 98.46% 100% 100%
MMI dataset
DFT 100% 99.08% 100% 100% DCT 100% 99.08% 100% 100% HWT 100% 97.25% 100% 99.39%
Db4 100% 97.55% 100% 100% Tap9/7 100% 98.78% 100% 100%
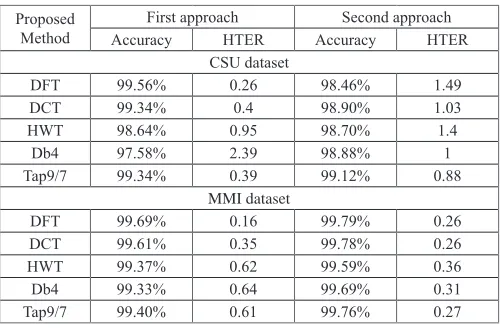
TABLE XXIV. The Results of the Proposed Methods Under the Two Approaches, Verification Mode
Proposed
Method AccuracyFirst approachHTER AccuracySecond approachHTER CSU dataset
DFT 99.56% 0.26 98.46% 1.49 DCT 99.34% 0.4 98.90% 1.03 HWT 98.64% 0.95 98.70% 1.4
Db4 97.58% 2.39 98.88% 1 Tap9/7 99.34% 0.39 99.12% 0.88
MMI dataset
DFT 99.69% 0.16 99.79% 0.26 DCT 99.61% 0.35 99.78% 0.26 HWT 99.37% 0.62 99.59% 0.36 Db4 99.33% 0.64 99.69% 0.31 Tap9/7 99.40% 0.61 99.76% 0.27
V. Conclusions And Future Work
In this paper an extended approach to extract features from user EEG signal is adopted, The features which are proposed in previously conducted studies are tested in this study to check the discriminative degree of this features when they are combined from two simulated EEG channels to generate one feature pool. This approach has improved the performance of the identification system, but for the verification system the performance of the first approach for most types of features is better than the second approach.
This approach also keeps the computational complexity low, and the user performs a single task to take his EEG features. After completing this study, the findings showed that one or two EEG channels are enough to extract discriminate features and recognize the individuals when the proposed methods were tested on the available datasets.
Wider Daubechies wavelet methods such as (db8, db10, ..) and a new type of statistical moments are recommended as new features for EEG based user identification and verification system.
TABLE XXV. Comparisons with Other Published Works on CSU Dataset and MMI Dataset Based on the Number of Subjects, the Number of used Channels and Tasks, Identification
CSU dataset
Author #subject #Ch. #Task # Features Accuracy (%)
[25] 5 6 4 4 CRR=100%
[8] 7 6 2 3 CRR=96.05%
Proposed DFT 7 2 1 1 CRR=100%
Proposed DCT 7 2 1 1 CRR=100%
Proposed HWT 7 2 1 1 CRR=100%
Proposed Daub4 7 2 1 1 CRR=100%
Proposed Tap9/7 7 2 1 1 CRR=100%
Motor Movement/Imagery dataset
[6] 18 8 1 2 CRR=97.4%
[7] 108 2 1 1 CRR=100%
[9] 5 1 1 for train 1for test 4 TAR=95%
[10] 108 9 4 1 CRR=99%
Proposed DFT 109 2 1 1 CRR=100%
Proposed DCT 109 2 1 1 CRR=100%
Proposed HWT 109 2 1 1 CRR=100%
Proposed Db4 109 2 1 1 CRR=100%
References
[1] C. Ashby, A. Bhatia, F. Tenoreb, and J. Vogelsteina, “Low-Cost Electroencephalogram (EEG) based Authentication,” in 15th International IEEE EMBS Conference on Neural Engineering, Cancun, Mexico, 2011,
pp. 422-445.
[2] P. Campisi and D. La Rocca, “Brain Waves for Automatic Biometric-based User Recognition,” IEEE transactions on information forensics and security, vol. 9, no. 5, pp. 782-800, 2014.
[3] M. Abo-Zahhad, S., M. Ahmed, and S., N. Abbas, “State-of-the-art Methods and Future Perspectives for Personal Recognition Based on Electroencephalogram Signals,” IET Biometrics, vol. 4, no. 3, pp. 179–
190, 2015.
[4] S. Altahat, M. Wagner, and E., M. Marroquin, “Robust Electroencephalogram Channel Set for Person Authentication,” in IEEE International Conference on Acoustics, Speech and Signal Processing (ICASSP), 2015, pp. 997-1001.
[5] G. Bajwa and R. Dantu, “Neurokey: Towards a New Paradigm of Cancelable Biometrics-based Key Generation using Electroencephalograms,”
Computers & Security, vol. 62, pp. 95-113, 2016.
[6] S. Yang and F. Deravi, “On the effectiveness of EEG signals as a source of biometric information,” in 2012 Third International Conference on Emerging Security Technologies (EST), 2012, pp. 49-52.
[7] D. La Rocca, P. Campisi, B. Vegso, P. Cserti, and G. Kozmann, “Human Brain Distinctiveness Based on EEG Spectral Coherence Connectivity,”
IEEE Transactions on Biomedical Engineering, vol. 61, no. 9, pp.
2406-2412, 2014.
[8] P. Kumari and A. Vaish, “Feature-level Fusion of Mental Task’s Brain Signal for an Efficient Identification System,” Neural Computing and Applications, vol. 27, no. 3, pp. 659-669, 2015.
[9] P., K. Sharma and A. Vaish, “Individual Identification Based on Neuro-Signal using Motor Movement and Imaginary Cognitive Process,” Optik-International Journal for Light and Electron Optics, vol. 127, no. 4, pp.
2143-2148, 2015.
[10] S. Yang, F. Deravi, and S. Hoque, “Task Sensitivity in EEG Biometric
Recognition,” Pattern Analysis and Applications, pp. 1-13, 2016.
[11] H., A. Hadi and L., E. George, “EEG Based User Identification Methods
Using Two Separate Sets of Features Based on DCT and Wavelet,” sent for publication to Journal of Theoretical and Applied Information Technology,
vol. xx, no. x, pp. xx-xx, 2017.
[12] H., A. Hadi and L., E. George, “EEG Based User Identification and Verification Using the Energy of Sliced DFT Spectra,” International
Journal of Science and Research (IJSR), vol. 6, no. 9, pp. 46-51, 2017.
[13] L. E. George and H. A. Hadi, “Brainwaves for User Verification using
Two Separate Sets of Features based on DCT and Wavelet,” International Journal of Advanced Computer Science and Applications (IJACSA), no. 9,
pp. 240-246, 2018.
[14] Z., A. Keirn and J., I. Aunon, “A new Mode of Communication between
Man and his Surroundings,” IEEE transactions on biomedical engineering,
vol. 37, no. 12, pp. 1209-1214, 1990.
[15] G. Schalk, D., J. McFarland, T. Hinterberger, N. Birbaumer, and J., R. Wolpaw, “BCI2000: a General-Purpose Brain-Computer Interface (BCI) System,” IEEE Transactions on biomedical engineering, vol. 51, no. 6,
pp. 1034-1043, 2004.
[16] N. AHMED, T. Natarajan, and K., R. RAO, “Discrete Cosine Transform,”
IEEE transactions on Computers, vol. 100, no. 1, pp. 90-93, 1974.
[17] A., M.,J. Abbas and L., E. George, “Palm Vein Identification and
Verification System Based on Spatial Energy Distribution of Wavelet Sub-Bands,” International Journal of EmergingTechnology and Advanced Engineering, vol. 4, no. 5, pp. 727-734, may 2014.
[18] J. S. Walker, A primer on Wavelets and Their Scientific Applications.: CRC
press, 2008.
[19] J. Shen and G. Strang, “Asymptotics of Daubechies Filters, Scaling
Functions, and Wavelets.,” Applied and Computational Harmonic Analysis, vol. 5, no. 3, pp. 312-331, 1998.
[20] M. Beladgham, A. Bessaid, A., M. Lakhdar, and A., T. Ahmed, “Improving
Quality of Medical Image Compression using Biorthogonal CDF Wavelet Based on Lifting Scheme and SPIHT Coding,” Serbian Journal of Electrical Engineering, vol. 8, no. 2, pp. 163-179, 2011.
[21] S. N. Mohammed and L. E. George, “Subject Independent Facial Emotion
Classification Using Geometric Based Features,” Research Journal of Applied Sciences, Engineering and Technology, vol. 11, no. 9, pp.
1030-1035, 2015.
[22] W. K. Pratt, Digital Image Processing. A Wiley-Inter Science Publication,
2001.
[23] R. Fluss, B. Reiser, D. Faraggi, and A. Rotnitzky, “Estimation of The ROC
Curve under Verification Bias,” Biometrical Journal, vol. 51, no. 3, pp.
475-490, 2009.
[24] T. Fawcett, “An Introduction to ROC Analysis,” Pattern recognition
letters, vol. 27, no. 8, pp. 861-874, 2006.
[25] R. Palaniappan, “Electroencephalogram Signals from Imagined Activities:
A novel Biometric Identifier for a Small Population,” in International Conference on Intelligent Data Engineering and Automated Learning,
2006, pp. 604-611.
TABLE XXVI. Comparisons with Other Published Works on CSU Dataset and MMI Dataset Based on the Number of Subjects, the Number of Used Channels and Tasks, Verification
Author #Subject # Ch. # Tasks # Features Accuracy (%) CSU Dataset
[26] 5 6 1 4 FAR=0, FRR=0
[5] 7 6 1 1 Acc.=100%
Proposed DFT 7 2 1 1 Acc.=98.46%, FAR=1.43, FRR=1.56
Proposed DCT 7 2 1 1 Acc.=98.90%, FAR=0.95, FRR=1.03
Proposed HWT 7 2 1 1 Acc.=98.70%, FAR=1.4, FRR=1.3
Proposed Db4 7 2 1 1 Acc.= 98.88%,FAR=0.95, FRR=1.04
Proposed Tap9/7 7 2 1 1 Acc.= 99.12%,FAR=0.95, FRR=0.81
MMI Dataset
[10] 108 9 4 1 EER=0.045
[4] 106 8 1 1 HTER=14.64
Proposed DFT 7 2 1 1 Acc.= 99.79%,FAR=0.31, FRR=0.21
Proposed DCT 7 2 1 1 Acc.= 99.78%,FAR=0.31, FRR=0.22
Proposed HWT 7 2 1 1 Acc.= 99.59%,FAR=0.31, FRR=0.41
Proposed Daub4 7 2 1 1 Acc.= 99.69%,FAR=0.31, FRR=0.31
[26] R. Palaniappan, “Two-Stage Biometric Authentication Method using Thought Activity Brain Waves,” International Journal of Neural Systems,
vol. 18, no. 1, pp. 59-66, 2008.
Hend A. Hadi
Hend A. Hadi was born in Baghdad, Iraq 1986, assistant instructor at ministry of education, Baghdad, Iraq. She holds a master degree from college of science/ University of Baghdad in 2018. Her main research concerns are: Digital Signal Processing, Pattern Recognition & Classification, Database applications, Visual Based application.
Loay E. George