284
Copyright © 2011-15. Vandana Publications. All Rights Reserved.
Volume-5, Issue-3, June-2015
International Journal of Engineering and Management Research
Page Number: 284-289
Linear Approximation of Web user Categorization
Ratnesh K. Jain1, Diwakar Shukla2, Saurabh Jain3
1
Kendriya Vidyalaya, Arah, Bhojpur, Bihar, INDIA
2
Department of Computer Science & Applications, Dr. H. S. Gour, University, Sagar, MP, INDIA
3
Department of Computer Applications, Shri Vaishnav Institute of Technology and Science, Indore, MP, INDIA
ABSTRACT
Web logs are being utilized as huge data repository for mining interesting and potentially useful patterns. When mined properly these patterns provide the support to designer of the web site; analyst and management executives in strategic decision making such as improvement of content, structure or in making adaptive web sites. Web logs although contains many information but doesn’t clearly indicate the page refreshing. If we are able to record the refreshing then in the Markov chain model we can add one more state which can be utilized to categorize the users of website into three categories i.e. faithful, Partially Impatient and Completely Impatient
users. Jain et al. [3] in his paper derived some theorem to study each type of users’ behavior and shown that how do users behavior differ. In this paper we approximate the expression using straight line and least square method and did comparative study. We find that approximate expressions can be used to predict the behavior of the users which is independent of parameters also.
Keywords---- Web mining, Pattern discovery, Adaptive web sites, Markov chain model, and Transition probability.
I.
INTRODUCTION
In a Web site with a large number of Web pages, users often have navigational questions, such as, where am I? Where have I been? And where can I go [1]? We can easily find out the answer of the first two questions i.e. Where am I? and Where have I been? But, the question where can I go? Is trickier and require prediction based on the previous trends. A good web site is that which has capability to help the users to find answers to all three questions. Web sites that change their presentation and organization to help users find the answer to the third question on the basis of next page access prediction are known as adaptive Web sites. There are so many methods are available to predict the next page access. One of them is Markov Chain model. Naldi [6] in 2002 gave an interesting contribution for the use of markov chain model towards the determination of traffic sharing among multiple operators in competitive market. In 2003 Zhao Li and Jeff Tian[4] tested the suitability of Markov Chain as web usage model and validated the model. After that many of the researchers uses this model to answer the third question where can I go?
Markov chain, named after Andrey Markov, is used to model a stochastic (random) process with the Markov property. Having the Markov property means that, given the present state, future states are independent of the
past states. At each instant the system may change its state from the current state to another state, or remain in the same state, according to a certain probability distribution. The changes of state are called transitions, and the probabilities associated with various state-changes are termed transition probabilities.
II.
RELATED WORK
The close resemblance between web applications and the state transition mechanism, Markov models have been widely used for modeling users’ web navigation behavior [2]. Several researchers have proposed the use of Markov chain models to model user access pattern.
Jain et al. [3] suggested new information in the web log to represent users refreshing activity. He used this refreshing information as a state named as ‘Refresh State’ and study the impact of refreshing on the transition probability. In their research work based on the refresh button click they divided the users into three categories: faithful user, partially impatient user and completely impatient user and did the simulation study to compare the users’ behavior.
285
Copyright © 2011-15. Vandana Publications. All Rights Reserved.
students’ profiles for a target eLearning oriented Web siteand described the entire process of discovering student profiles on an eLearning Web based platform.
III.
MARKOV MODEL WITH REFRESH
STATE (DUE TO [3])
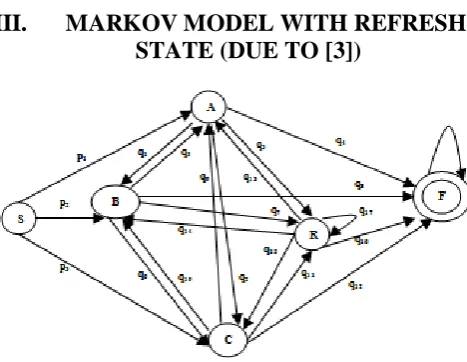
When we utilize the Markov model for web user categorization each web page of a website represents a state and navigation from one page to another is called transition. The whole website can be represented by a transition probability matrix (called transition matrix in short) which contains one-step transition probabilities in the Markov model. The Markov model is then used for next page access prediction by calculating the conditional probabilities of visiting other pages in the future given the user’s current position and/or previously visited pages.
Let our web site is consist of three web pages named A, B, C. We can introduce two more state namely Start State and Finish State represented by S and F respectively. If we assume that web log has an entry per refresh button click or refresh button click can be detected from the web logs, we can introduce a new state which we named Refresh State and represented by R. The model is shown in figure 1.1.
Name of the variables indicating the transition probability are shown as the label of the edges as shown in fig 1.1. A user can start accessing the Web site by accessing any of the three web pages. Labels on edges from S to other states are indicating the initial probability. As shown in the figure there in no edge from S to R and S to F indicating that without accessing any web page user neither press the refresh button nor he closes the web site. Hence the tuple < X, T, λ > that define Markov chain model is as follows:
X = { S, A, B, C, R, F }, λ = {p1,p2,p3,0,0}
T =
1 0 0 0 0
q q 5 q q q
q q 0 q q
q q q 0 q
q q q q 0
F R C B A
F R C B A
17 16 1 14 13
12 11 10
9
8 7 6 5
4 3 2 1
3.1 Some Results for nth
As per Jain, R. K. [3], the starting conditions are: Attempts (Due to [3])
1 (0)
p A X
P = = , P X(0) B =p2
= ,
3 (0)
p C X
P = = ,
0 R X
P (0) = = , PX(0)=F=0.
And there are three types of users Faithful Users, Partially Impatient Users and Completely Impatient Users. The nth attempt probability for each type of user is specified below as derived in [3].
3.11 nth Attempt Results for Faithful User (Due to [3])
A Faithful user at the n-1th attempt can be either on a particular web page of which he is a Faithful user (for example he can be at state A if he is a Faithful user of page A) or it can be at state R. Then the probability of reaching on states A, B, C on the nth attempt can be calculated using the following theorems-
Theorem 1: The transition probability of reaching on state A at nth
(i) When n is even
attempt when user is faithful
n
13 n 3 1 2n
q q p A ) ( X
P = = ,
For n=0,1,2,3……. (ii) When n is odd
0 A 1) (2n X
P + = =
,
For n= 0,1,2,3……
Theorem 2: The transition probability of reaching on state B at nth
(i) When n is even:
attempt when user is faithful-
n 14 n 7 2 2n
q q p B ) ( X
P = = ,
For n=0,1,2,3…….
(ii) When n is odd: ( ) B 0 X
P 2n+1 = = ,
For n= 0, 1, 2...
Theorem 3: The transition probability of reaching on state C at nth
(i) When n is even:
attempt when user is faithful-
n 15 n 11 3 2n
q q p C ) ( X
P = = ,
For n=0,1,2,3…
(ii) When n is odd: ( ) C 0 X
P 2n+1 = = ,
For n= 0,1,2,3…
3.1.2 nth Attempt Results for Partially Impatient User (Due to [3])
If user continuous with attempts to access web pages then at the n-1th attempt he can be at state A, B, C or user can do refresh which we represent the state R that means user can be at state A or B or C or R then the probability of reaching on states A, B, C on the nth attempt can be calculated using the following theorems-
286
Copyright © 2011-15. Vandana Publications. All Rights Reserved.
(i) When n is even10 n 5 1 -n 1 3 n 9 6 1 -n 2 2 n 9 n 2 1 n 5 n 1 1 2n q q q p q q q p q q p q q p A ) ( X
P = = + + +
For =1,2,3… (ii) When n is odd
1 n 9 n 2 3 1 n 5 n 1 2 1 2n q q p q q p A ) ( X
P + = + + +
=
For n= 0,1,2,3……
Theorem 5: The transition probability of reaching on state B at nth
(i) When n is even
attempt when user is partially impatient-
9 1 -n 5 n 1 3 n 10 n 6 2 n 5 n 1 2 10 1 -n 9 n 2 1 2n q q q p q q p q q p q q q p B ) ( X
P = = + + + ,
For n=1,2, … (ii) When n is odd
n 1 10 n 6 3 n 5 1 n 1 1 1
2n ) B p q q p q q
( X
P + = = + + + ,
For n= 0,1,2,3……
Theorem 6: The transition probability of reaching on state C at nth
(i) When n is even
attempt when user is partially impatient-
n 10 n 6 3 n 9 n 2 3 1 -n 9 5 n 2 2 6 1 -n 5 n 1 1 2n q q p q q p q q q p q q q p C ) ( X
P = = + + +
For n=1,2,3… (ii) When n is odd
n 10 1 n 6 2 n 9 1 n 2 1 1
2n ) C p q q p q q
( X
P + = = + + + ,
For n= 0,1,2,3……
3.1.3 nth Attempt Results for Completely Impatient User (Due to [3])
A Completely impatient user if continuous with attempts to access web pages then at the n-1th attempt he can be at state A, B and C then the probability of reaching on states A, B, C on the nth attempt can be calculated using the following theorems-
Theorem 7: The transition probability of reaching on state A at nth
(i) When n is even
attempt when user is completely impatient:
. 1,2,3 n For q q q p q q q p q q p 2 q q p q q p A ) ( X P 10 n 5 1 -n 1 3 1 -n 10 9 n 6 2 n 13 n 3 1 n n 9 n 2 1 n 5 n 1 1 2n … … = + + = = + +
(ii) When n is odd
n q n )q q p q (p n 2 A ) ( X P 13 3 9 3 5 2 1
2n = +
+ = ,
For n =0,1,2,…
Theorem 8: The transition probability of reaching on state B at nth
(i) When n is even
attempt when user is completely impatient:
1,2,3... n For , q q q p q q q p q q p 2 q q p q q p B ) ( X P 9 1 -n 5 n 1 3 10 1 -n 9 n 2 1 n 14 n 7 2 n n 10 n 6 2 n 5 n 1 2 2n = + + = = + +
(ii) When n is odd
P X( ) B 2n(p q p q )qnqn
14 7 10 3 1 1 1
2n = +
+ = ,
For n= 0, 1, 2, 3……
Theorem 9: The transition probability of reaching on state C at nth
(i) When n is even
attempt when user is completely impatient:
. 1,2,3,.... n For , n 15 n 11 3 n n 10 n 6 3 n 9 n 2 3 n 5 2 1 -n 1 2 1 -n 10 n 6 1 1 2n q q p 2 q q p q q p q q q p q q q p C ) ( X P = + + + + = =
(ii) When n is odd
( ) C 2n(p q p q )qnqn X P 15 11 6 2 2 1 1
2n = +
+ = ,
For n= 0,1,2,3……
IV.
LINEAR APPROXIMATION
Consider two variables Y and X as
Y = P[X = .] and
X = n
Now we can draw line Y = a + bX using principle of
least square.
The two normal equations are
ƩY = ma + ƩX
ƩXY = a ƩX + b ƩX
b∧
2
Where m is number of pair points available on the graph,
= 2 2 ) ( ) )( ( X X m Y X XY m Σ − Σ Σ Σ − Σ ] [ 1 X m Y n
a= Σ − Σ
∧
The line is plotted as approximation:
Y = a∧+ b∧X
Averaging over many varying parameters p, q etc. provide average relationship-
Y = a + bX
287
Copyright © 2011-15. Vandana Publications. All Rights Reserved.
The linear approximation is having downward trend in both the cases. It is matching with the original trend as observed in [3]. Further, the line pattern is independent of q-parameters.
The approximate relationship between state probability and transition number is showing downward trend as observed in above graph. The line is independent of q-parameter.
288
Copyright © 2011-15. Vandana Publications. All Rights Reserved.
The graph in fig 9(a), 9(b) and 9(c) is decliningwith the number of transaction as in the fig 8(a), 8(b) and 8(c) which suggest that 9(a), 9(b) and 9(c) is linear approximation of the fig 8(a), 8(b) and 8(c) and it is independent of the values of p and q.
The approximate relationship between state probability and transition number for the completely impatient user of page A is shown in the fig 11(a), 11(b) and 11(c) which shows similar trends as shown in the figure 10(a), 10(b) and 10(c).
289
Copyright © 2011-15. Vandana Publications. All Rights Reserved.
The behavior of completely impatient user of pageC in the linear approximation is again trending downward
which is similar to the previous trend in [3]. Here again the values of p and q are not affecting the behavior.
VI.
CONCLUSION
The paper shows that linear approximation could be made effectively to the probability values and number of transitions. The basic feature of this approximation is that they are independent of model parameters. One can use the line approximation probabilities directly for computation of state probabilities in the Markov chain model.
REFERENCES
[1] Nielsen, J.: Designing Web Usability, New Riders Publishing, USA, 2000.
[2] S. Karlin and H. M. Taylor: A First Course in Stochastic Processes, 2nd Ed. Academic Press, New York, 1975.
[3] R. K. Jain, S. S. Thakur, R. S. Kasana, and S. Jain: “Web User Categorization and behavior study based on refereshing”, Int. J. Advanced Networking and Applications, Volume: 01, Issue: 02, pp.76-84, 2009.
[4] Zhao Li and Jeff Tian: “Testing the Suitability of Markov Chains as Web Usage Models”, Computer Software and Applications Conference, 2003, Proceeding of 27th
[5] Marques, A and Belo, O.: “Discovering Student Web Usage Profiles Using Markov Chains” The Electronic Journal of e-Learning Vol. 9, No.1, 2011, pp. 63-74, available online a
Annual International Conference COMPSAC 2003, Published by IEEE, pp. 356-361.