SRef-ID: 1432-0576/ag/2005-23-3487 © European Geosciences Union 2005
Annales
Geophysicae
Solar eclipse effect on geomagnetic induction parameters
A. ´Ad´am, J. Ver˜o, and J Szendr˜oi
Geodetic and Geophysical Research Institute of the Hungarian Academy of Science, Sopron, Hungary
Received: 9 March 2005 – Revised: 28 September 2005 – Accepted: 11 October 2005 – Published: 21 December 2005
Abstract. The 11 August 1999 total solar eclipse had been studied using a large array of stations in Central Europe (Bencze et al., 2005). According to the result of this study, the amplitudes of the field line resonance (FLR)-type pulsa-tions decreased in and around the dark spot by about a factor of 2, and this decrease moved with the velocity of the dark spot in the same direction. This decrease was interpreted as a switch-off of the FLR-type pulsations, due to a change in the eigenperiod of the field line as a consequence of a change in the charged particle distribution along the field line. An ef-fect was also found in the phase of the (magnetic or electric) perpendicular components.
At the Nagycenk (NCK) observatory lying in the zone of totality, both magnetic and electric records were available. The magnetotelluric (MT) sounding curve computed by the usual method for the eclipse interval (08:00–14:00 UT) fits the previously known standard curve extremely well. During the eclipse, however, impedance values in the FLR period range were highly scattered. The scatter remained as long as the eclipse lasted. Coherence values between magnetic and electric components decreased significantly. In contrast, an earlier similar switch-off of the FLR-type activity on the same day did not cause a similar scatter, in spite of a com-parably low coherence. Thus, the lack of FLR-type activity disturbed the usual MT connection between the magnetic and electric components during the eclipse.
The induction vector (tipper), especially its real part, shows a clear effect of the eclipse in the FLR period range (24–29 s), too. Both at NCK and at Bad Bergzabern (BBZ, westernmost station and longest FLR period)), a definite de-crease in the real tipper was ascertained during the totality. The average direction of the tipper did not change.
Concerning both parameters, a random effect cannot fully explain the observed phenomena. The scatter of the EM in-duction parameters is most likely due to the switch-off of the FLR activity. The possibility of such an effect should Correspondence to: A. ´Ad´am
be considered in induction studies. Pilipenko and Fedotov (1993) supposed an opposite effect and emphasised lower quality data, if resulting from FLR-type pulsations, while we claim high quality data just from such an activity.
Keywords. Electromagnetics (Measurements and stan-dards; Scattering and diffraction) – Magnetospheric physics (Current system)
1 Introduction
A total solar eclipse swept over Central Europe, includ-ing Hungary, on 11 August 1999 between about 10:00 and 12:00 UT. As the density of the geomagnetic observato-ries is highest here, and many temporary stations were op-erated during that time, a unique opportunity was given to study the effect of the eclipse on geomagnetic variations. A Hungarian-German-Japanese-Czech group studied the geo-magnetic pulsations during the eclipse, mainly in the Pc3 pe-riod range=15–45 s) (Bencze et al., 2005).
Pc3 pulsations have two different generation mechanisms, even if the primary source is for both types the upstream waves excited in the pre-shock interplanetary space. These waves have a rather flat spectrum, peaked at a period depend-ing on the interplanetary magnetic field (IMF) (B), on aver-age as T(s)=170/B(nT) (Ver˜o, 1986). A part of the upstream waves (UW) penetrates without significant modification into the magnetosphere and reaches the surface, causing UW-type activity there with identical periods at all latitudes.
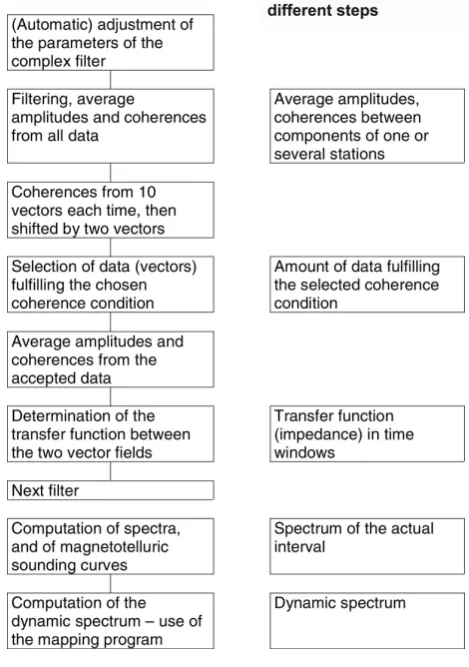
Fig. 1. Scheme of the program used in the data processing and the results obtained by this program used in the study (Verő 1972).
15
Fig. 1. Scheme of the program used in the data processing and the
results obtained by this program used in the study (Ver˜o, 1972).
Bencze et al. (2005) studied Pc3 pulsations during the 1999 eclipse. They found a localised decrease in their ac-tivity, concentrated at the dark spot. The amplitude decrease amounted to about 50 percent. Leaving the totality zone, the effect disappeared rather quickly. Moreover, the decrease moved in the same direction as the dark spot, and the ve-locities were similar, too. This effect was interpreted as a switch-off of the FLR mechanism due to a change in the eigenperiod of the geomagnetic field lines in consequence of a loss of charged particles along the field line. Since with-out solar electromagnetic radiation, the electron density de-creases in the lower part of the ionosphere and consequently upward transport of charged particles weakens and the den-sity of charged particles decreases both in the upper iono-sphere and plasmaiono-sphere.
The Sopron group started investigations of the source ef-fect in induction parameters in the late sixties, following the ideas of Price (1962) on the dimension of the induc-ing (source) field A structure similar to the field-line reso-nance, i.e. E-W direction elongated, namely the auroral elec-trojet has been studied from an induction point of view by Mareschal, 1981; Pirjola, 1982, etc. A multi-nation East European array of stations was operated in 1969 to study
magnetotelluric (MT) parameters when pulsations have lati-tude dependent periods, i.e. if in modern terms, FLR activity is present ( ´Ad´am et al., 1976). It was shown that MT appar-ent resistivities coincide for FLR and mixed-type variations measured at the Nagycenk (NCK) observatory. Impedance elements computed from low amplitude UW intervals are re-jected in mixed activity against those from higher amplitude FLR signals.
Pilipenko and Fedotov (1993) tried, at first, to separate MT values from UW and FLR activities. They assured an op-posite effect and emphasised lower quality data, if resulting from FLR-type pulsations, while we claim high quality data just from such an activity. Their theory cannot be discussed in this paper.
2 Material used and processing method
The aim of the present study was to investigate the eclipse effect on EM induction parameters, among them, on MT impedance tensor elements and on induction vectors. The impedance tensor is the complex transfer function between the horizontal magnetic and electric field (Cagniard, 1953; Weaver, 1994), and the induction vector is the complex trans-fer function between the vertical magnetic field and the hor-izontal magnetic field (Wiese, 1965) (see Appendix). Both depend on the period of the variations used. At a given pe-riod, all these parameters in a first approximation only de-pend on the geoelectric structure below the station. Sec-ondary effects – as a source effect – may be due to the charac-ter of the incoming signal and to the geoelectric environment of the station.
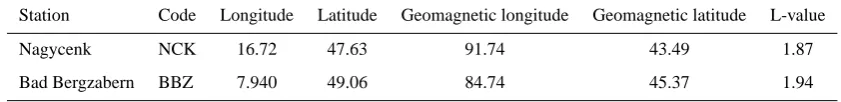
We choose the two stations given with co-ordinates in Ta-ble 1 for the study of the eclipse effect in induction methods. BBZ is the westernmost European station in the totality zone. Here three magnetic components were available with a sam-pling interval of 2 s. NCK is among the easternmost stations, and here both magnetic and electric records were available with a sampling interval of 1 s.
[image:2.595.48.283.73.407.2]3 Eclipse effect in NCK pulsation activity
The NCK observatory was situated in the totality zone. Here both magnetic and electric (earth current) data were avail-able, thus the behaviour of the MT impedance tensor could also be studied.
All the data series were filtered in the full period range of Pc3, i.e. between 15 and 45 s, using the program described in Fig. 1. Filtered amplitudes and MT sounding curves were determined, both for monitoring the accuracy of the two in-dependently recorded data and to obtain information about the character of the electromagnetic field and about its even-tual changes.
Figure 2 presents the average amplitude in the magnetic H-component in each minute at 24 s, i.e. at the local FLR period (22–24 s). The totality occurred at 10:47 UT and had a duration of 1.5 min. Before 10:18 UT the FLR-type activity was strong. This is confirmed by the period of the activity (24 s) and by the beating structure: amplitudes increase and decrease in 3–4 min, making beats consisting of about 8 to 10 cycles, as usual (Ver˜o and Miletits, 1994).
Around 10:20 UT the amplitudes decreased significantly, by a factor of about two less than previously, and the beating structure is less evident. At 10:48 UT there is a sudden in-crease in the amplitude. This event consisted of rather irreg-ular beats. At 10:51 UT the pulsation activity was switched off.
The NCK data correspond to a switch-off of the pre-existing FLR type pulsations during the totality and for a certain time interval afterwards. Another quite similar event did occur earlier on the same day, between 08:15–08:40 UT, when it was not connected with the eclipse, and similar switch-offs are by no means seldom.
The disappearance of the pulsations alone is not necessar-ily an eclipse effect. The attenuation has to be restricted to the zone of the dark spot and it has to move synchronously with it.
4 Eclipse effect in NCK impedance elements
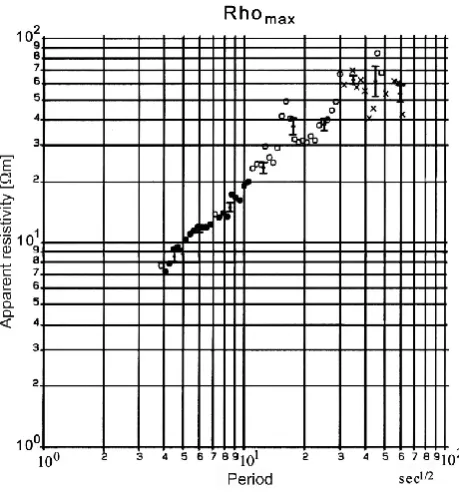
The values of the MT impedance elements were determined from each 30 min interval around the eclipse and from the full interval between 08:00–14:00 UT. Figure 3 shows the MT sounding curve from the full interval. The quality is very high, are the quality parameters of the apparent resis-tivities are well above the average, even for those measured in the observatory. Computations made with the program presented in Fig. 1 automatically reject the impedance val-ues from time intervals not fulfilling coherence conditions. This strictly corresponds to the plane-wave cases.
A detailed study of the main (Zxy, Zyx)impedance
ele-ments computed for the local FLR periods (22–29 s) is shown in Fig. 4. (Outside of this range some impedance values are missing because of low activity or have no significant varia-tions).
Fig. 2. Average amplitudes of the NCK H component at the local FLR period, 24 s during the eclipse, August 11, 1999, 1000-1100 UT (local time is +1 h).
16
Fig. 2. Average amplitudes of the NCK H component at the
[image:3.595.318.547.68.170.2]lo-cal FLR period, 24 s during the eclipse, 11 August 1999, 10:00– 11:00 UT (local time is +1 h).
Fig. 3. MT sounding curve of NCK (Rhomax)from records around the solar eclipse, 11 August 1999. Individual points were obtained from parts of the 6-h records to illustrate the scatter.
[image:3.595.312.542.235.483.2]Fig. 4. MT impedance elements at NCK on August 11, 1999, on the eclipse day around the totality in 30 min intervals for periods 22-29 s. Red line is Zxy, blue Zyx.
18
Fig. 4. MT impedance elements at NCK on 11 August 1999, on
the eclipse day around the totality in 30 min intervals for periods 22–29 s. Red line is Zxy, blue Zyx.
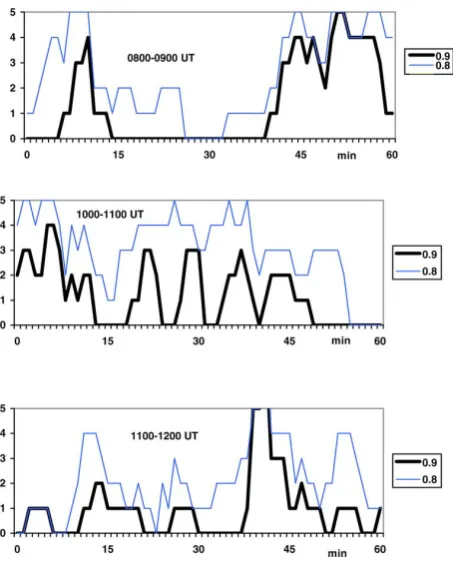
Fig. 5. Number of amplitude-vector groups (from 10 values each) of the filtered 24 s amplitudes (FLR period) from the possible maximum of 5 when the coherence limit 0.9 (thick line) and the 0.8 limit (thin line) was surpassed.
19
Fig. 5. Number of amplitude-vector groups (from 10 values each)
of the filtered 24 s amplitudes (FLR period) from the possible maxi-mum of 5 when the coherence limit 0.9 (thick line) and the 0.8 limit (thin line) was surpassed.
magnetic latitudes (L-values), where the FLR periods are longer, thus these longer periods could become earlier dis-turbed, too. For example, at Hartland (England), where the (near) totality occurred at 10:14 UT, the FLR period was about 35 s. Later, the dark spot swept over Europe with an effect at decreasing periods. According to these figures, the connection between the magnetic and electric fields changed during the eclipse in the FLR period range. It is, however, to
be mentioned that up to now, there had been no experimental indication for some deviation between impedances computed from UW-and FLR-type pulsations.
There is a further possibility to check the connection be-tween local magnetic and electric fields during the eclipse. The program presented in Fig. 1 yields the coherence val-ues for groups of ten amplitudes, sliding the initial point of computation each time by two amplitudes, if the selected co-herence condition is not fulfilled, and if it is fulfilled, by ten amplitudes, i.e. by the accepted series. Coherence is com-puted in each case between the two mutually perpendicular components of the magnetic and electric fields. The coher-ence condition is generally 0.9, sometimes, especially in the case of strong electromagnetic noise and/or strong geologic distortions the condition is lowered down to as low a value as 0.6.
The information about coherence can be used here to show the correspondence or similarity between the two fields. The coherence decreases, if the ratio of the amplitudes changes and/or if the phase difference changes between them. The coherence is more sensitive to changes in the phase differ-ence, i.e. to polarisation, than to the change in the amplitude ratio (Bencze et al., 2005).
The number of amplitude-vectors fulfilling the 0.9 and the 0.8 coherence conditions are plotted in Fig. 5 vs. time. The first part shows this amount in the interval 08:00–09:00 UT, where between 08:15–08:40 UT the mentioned switch-off occurred. The coherence did not reach the 0.9 limit and even the 0.8 limit was seldom reached.
The switch-off which is possibly in connection with the eclipse lasted from 10:49 until 11:37 UT. During this time, the coherence reached in a few cases the 0.9 limit, but until 11:02 UT no such case occurred, and the amounts were everywhere lower than elsewhere. Between 08:00 and 14:00 UT no such sections were found.
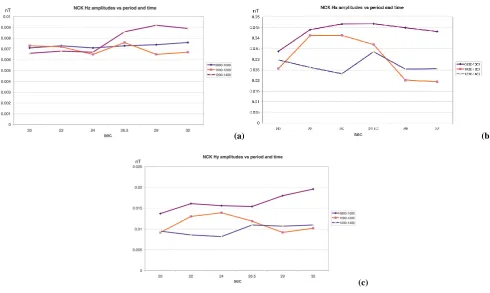
[image:4.595.53.284.65.215.2] [image:4.595.56.283.285.567.2]Fig. 6a. Pseudo-spectrum of the NCK vertical magnetic component (Hz) in 2-hour sections of time, for periods 20 – 32 s. (For explanation of the pseudo-spectra see also text).
20
(a) (b)
Fig. 6c. The same as Fig. 6a, but for the Hy horizontal component.
22 (c)
Fig. 6. (a) Pseudo-spectrum of the NCK vertical magnetic component (Hz)in 2-h sections of time, for periods 20–32 s. (For explanation of
the pseudo-spectra, also see the text). (b) The same as Fig. 6a, but for theHxhorizontal component. (c) The same as Fig. 6a, but for theHy
horizontal component.
Fig. 7. NCK real tippers vs. period in 2-hour sections (periods 18-52 s).
23 Fig. 7. NCK real tippers vs. period in 2-h sections (periods 18–
52 s).
5 Eclipse effect on induction vectors (NCK and BBZ)
The transfer functions between the vertical and the horizontal magnetic components, and the induction vectors (or tippers), are complex quantities, too. As the real parts are mostly greater than the imaginary ones (e.g. at both NCK and BBZ the real parts are about twice the imaginary parts) , we only use in the following the former ones. The domination of the real component among our data proves Schmucker’s (1970) early suggestion that the (anomalous) vertical field is almost
in phase with the inducing horizontal field. Induction vectors depend on the local and regional geological structure and sensitively indicate conductivity inhomogeneities. We com-puted induction vectors for the stations NCK and BBZ, being the most distant available stations in the totality zone. The vectors were computed in 30- and 120-min intervals within the 08:00-14:00 UT interval for periods 18–52 s. The coher-ence limit was set here at 0.6, as in the case of the vertical magnetic component, low amplitudes result in a low signal to noise ratio and correspondingly in low coherences.
[image:5.595.53.282.432.556.2]Fig. 8. NCK real tippers vs. period in 2-h sections (FLR periods,
22–32 s).
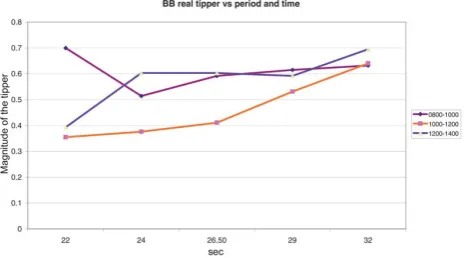
Fig. 9. BBZ real tippers vs. period in 2-hour sections (FLR periods, 22-32 s).
25
Fig. 9. BBZ real tippers vs. period in 2-h sections (FLR periods,
22–32 s).
The average direction of the tippers is in the Pc3 range at NCK SW, at BBZ SSE. The NCK tippers in the period range 18–52 s are plotted in Fig. 7 for the three 2-h inter-vals. Outside of the FLR range (24–29 s) the scatter is rather high, due to the low quantity of the accepted sections. In the FLR range (Fig. 8) the tippers in the eclipse interval are less than outside of the eclipse time. This difference (0.08 against 0.23) is quite stable within this FLR range.
A similar processing yielded for BBZ low and stable val-ues for the tipper in the FLR range. The average tippers are around 0.4 at periods 22–26.5 s in comparison to 0.6 at longer periods (Fig. 9). For longer periods, the difference stepwise disappeared. No similar change was found outside of the eclipse time. At periods shorter than 22 s, no reliable tippers were obtained.
Thus, the eclipse resulted at both stations in a decrease in the induction effect, that is, of the vertical magnetic compo-nent as related to the horizontal compocompo-nents. The effect was also studied in a higher time resolution, i.e. in 30-min inter-vals. In Fig. 10, NCK tippers are plotted vs. time for periods 22, 24 and 26.5 s. A significant decrease is evident at 24 s, starting at 10:30 UT. At 22 s, the decrease at 11:30 UT may indicate that the dark spot reached the corresponding low lat-itudes, too.
Fig. 10. NCK real tippers at FLR periods (22, 24, 26.5 s) in 30 min, sections, 0800-1400 UT.
26 Fig. 10. NCK real tippers at FLR periods (22, 24, 26.5 s) in 30-min
sections, 08:00–14:00 UT.
Fig. 11. BBZ real tippers at FLR periods (22, 24, 26.5 s) in 30 min sections, 0800-1400 UT.
27
Fig. 11. BBZ real tippers at FLR periods (22, 24, 26.5 s) in 30-min
sections, 08:00–14:00 UT.
Some decreases of the tippers were found at BBZ, too (Fig. 11). The decreases started at periods of 22 and 26.5 s earlier, (09:30 UT) than at NCK, again indicating the earlier eclipse there. A similar early decrease appeared at NCK tip-pers (09:00 UT), too, which is of unknown origin.
6 Discussion
The aim of the present study was to investigate the effect of a total solar eclipse on induction parameters. As far as we know, no similar study had been carried out in the past.
According to a study of the effect of the eclipse on Pc3 pul-sations (Bencze et al., 2005), the FLR mechanism ceased to amplify corresponding UW periods, and therefore the type of pulsations producing the induction effect switched from mainly an FLR-type activity to mainly a UW-type for an interval starting simultaneously with the eclipse and lasting longer than the eclipse lasted. This switch moved together with the dark spot.
[image:6.595.51.283.68.198.2] [image:6.595.314.546.250.377.2] [image:6.595.52.285.253.382.2]Table 1. Stations used and their co-ordinates.
Station Code Longitude Latitude Geomagnetic longitude Geomagnetic latitude L-value Nagycenk NCK 16.72 47.63 91.74 43.49 1.87 Bad Bergzabern BBZ 7.940 49.06 84.74 45.37 1.94
phase difference variations are much more concentrated in a narrow phase range for FLR-type pulsations than for UW (see Bencze et al., 2005).
In the case of the induction vectors (real part of the tippers), significantly lower values were found during the eclipse than in other times in the FLR range. In some cases the start of the decrease in the tipper shifted simultaneously with the dark spot.
The concurrent explanation of the observed effects would be a purely random scatter due to low activity and a corre-spondingly worse signal to noise ratio. However, the detected changes are too systematic to be of a purely random origin. In addition, experience with the computation of these induc-tion parameters convinced us that the observed effects are no artefacts of industrial or other noise.
The physical source of the changes in the induction param-eters is supposedly a change in the distribution of the induced currents, which is a typical change in the source. FLR-type variations are restricted to a narrow (100–200 km wide) E-W directed strip, while UE-W type pulsations are induced in a wide area in a great part of the daytime hemisphere. In the latter case, the variable H-D phase relations refer to a chang-ing distribution of the UW originatchang-ing currents.
The alternation of FLR- and UW-type pulsations may re-sult in certain changes in the induction parameters. This may appear as a scatter of the computed parameters, natu-rally only in the FLR period range, where two different kinds of sources are active. This can be the cause for unexpected scatter if the pulsation activity is low. Else where, just the low amplitude of the UW-type activity means that in long records, UW sections have very low weights or they are fully eliminated by the coherence conditions.
It is to be noted that during the whole interval of the eclipse, both the ionospheric and magnetospheric parameters (especially electron density) continuously changed. There-fore, no stable condition for the appearance of FLR could develop, i.e. the induction effect had to change, too, during the eclipse.
Appendix A
The equations of the magnetotelluric method and of the geomagnetic induction arrows (tippers) are based on the Maxwell equations.
a) Magnetotelluric (MT) method
Apparent electric resistivities at a certain point are deter-mined from variations of the electric (E) and magnetic (H) field at a certain periodT. Using the complex components of the transfer function – i.e. of the impedance tensor Z -, the basic formulas express the connection between theEandH field variations:
Ex(T )=Zxx(T )Hx(T )+Zxy(T )Hy(T ),
Ey(T )=Zyx(T )Hx(T )+Zyy(T )Hy(T ).
The so-called apparent resitivity and its phase are in practical units:
ρxy=0.2T E
x
Hy 2
=0.2T Zxy
2
,
WhereE is in units mV/km,H is in nT, the apparent resis-tivity is in ohmm.
ϕ=t an−1I mZxy ReZxy
(By changing the indices x and y, one obtains the symmetric formulas for the other pair of values).
One obtains the value of the maximum and minimum impedances (and apparent resistivities) by rotating the com-ponents ofZby an angle to be determined from the compo-nents.
Apparent resistivity and phase vs. period give the sound-ing curves.
b) Induction arrows (tippers). Similar formulas are valid for the transfer function between the vertical componentHzand
the horizontal components ofH:
Hz(T )=Xzx(T )Hx(T )+Xzy(T )Hy(T ).
HereXis a complex quantity, the absolute value of the re-sultant both for the real and imaginary parts yields the corre-sponding induction arrows, its direction is:
α=tan−1Xzy Xzx
.
Acknowledgements. The authors thank Professors H L¨uhr
(Pots-dam) and K. Yumoto (Nagoya) for the magnetic records. The present work was supported by the Hungarian State Grant OTKA RS 408048.
References
´
Ad´am, A., Miletits, J., and Ver˜o, J.: Inhomogeneity of the pulsation field and its effect on the MT values, Geoelectric and Geothermal Studies, (Ed.) ´Ad´am, A., Akad´emiai Kiad´o, Budapest, 296–302, 1976.
Bencze, P., Heilig, B., Zieger, B., Szendr˜oi, J., Ver˜o, J., L¨uhr, H., Yumoto, K., Tanaka, Y., and Strestik, J.: Effect of the 11 August 1999 total solar eclipse on geomagnetic pulsations, Manuscript to be published in Earth Planets Space, 2005.
Cagniard, L.: Basic theory of the magnetotelluric method of geo-physical prospecting, Geophysics, 18, 605–635, 1953.
Mareschal, M.: Source effect and the interpretation of geomagnetic sounding data at sub-auroral latitudes, Geophys. J. R. Astr. Soc., 67, 125–136, 1981.
Pilipenko, V. A. and Fedotov, E. N.: Magnetotellric sounding of the crust and hydromagnetic monitoring of the magnetosphere with the use of the ULF waves, Ann. Geophys., 36, 19–33, 1993. Pirjola, R.: Electromagnetic induction in the Earth by a plane wave
or by fields of line currents harmonic in time and space, Disserta-tion at the Faculty of Science of the University of Helsinki, 161, 1982.
Price, A. T.: The theory of magnetotelluric method when the source field is considered, J. Geophys. Res., 67, 1907–1918, 1962. Schmucker, U.: Anomalies of geomagnetic variations in the
South-western United States, Bulletin of the Scripps Institution of Oceanography, Univ. of California Press, San Diego, La Jolla, California, 13, 166, 1970.
Ver˜o, J.: On the determination of the magnetotelluric impedance tensor, Acta Geod., Geoph. Mont. Hung., 7, 333–351, 1972. Ver˜o, J.: Experimental aspects of low latitude pulsations. A review,
J. Geophys. R., 60, 106–120, 1986.
Ver˜o, J. and Miletits, J.: Impulsive pulsation events and pulsation beats, J. Atm. Terr. Physics, 56, 433–445, 1994.
Ver˜o, J., L¨uhr, H., Vellante, M., Best, I., Strestik, J., Miletits, J., Holl´o, L., Szendr˜oi, J., and Zieger, B.: Upstream waves and field line resonance: simultaneous presence and alternation in Pc3 pulsation events, Ann. Geophys., 16, 34–48, 1998,
SRef-ID: 1432-0576/ag/1998-16-34.
Weaver, J. T.: Mathematical methods for geoelectromagnetic induc-tion, Applied an engineering mathematics series 7, Wiley, New York, 316, 1994.