10
ASSESSING DETERMINANTS OF NEPALI INTERNATIONAL TRADE: A
REFERENCE TO THE WORLD TRADE ORGANIZATION
Arun GC
Ministry of Agriculture and Livestock Development, Nepal
Received: Sept 03, 2019 Accepted: Nov 29, 2019 Published: Dec 30, 2019
Abstract
:Nepal, a land-locked by two giant economies - China and India, is the first "Least Developed Country" (LDC) to become a member of the World Trade Organization (WTO) through the negotiation process. Moreover, Nepal aimed to diversify its trade and to make the trade regime more liberal to integrate into a global trading system being a member of the WTO. Therefore, the paper aimed to evaluate impacts of determinants of Nepali international trade. The secondary data were accessed from the Nepal Rastra Bank and the World Bank. More importantly, to execute a multiple regression model, we used the World Bank data from 1965 to 2015. The result suggested that Agricultural value addition, industrial value addition and service value addition showed a different impact on Nepali international trade. The determinants of Nepali international trade can be internalize in trade policy of Nepal to achieve it initial objectives.
Keywords:
International Trade, World Trade Organization, Nepal
1.
Introduction
Trade liberalization is considered as one of the key approaches to achieve higher efficiency in international trade and economic development (OECD, 2017). Tariff and non-tariff barriers are the important factors affecting the efficiency of the trade. Meanwhile, the World Trade Organization (WTO) was established on January 1, 1995 (WTO, 2015) to encourage member states on the reduction of the tariff and removal of the non-tariff barriers to the trade. Consequently, any member of the WTO aims to get wider market access and diversify their trade – both an export and an import.
11
During 2009 to 2016, Nepal’s major imports were - "Petroleum", "M.S. Billet", Gold, "Liquefied Petroleum Gas", Crude soybean oil, "Motorcycle", "Telephone", "Rice", "Medicines" and "Cement clinkers". Similarly, during the same period, top export were Carpet, Woven fabric, Lentils, Woolen shawls, Flat rolled iron products, Jute bags, single yarn, wire of iron, mixture of juice and Big Cardamom (TEPC, 2017).
2. Objective
Even after decades of being a member of the WTO, Nepali trade has not changed the momentum as expected – especially on the export side. Therefore, the paper attempted to assess the Nepali trade sector and sought to compare the trade regime before and after the accession to the WTO. Specifically, the paper tried to accomplish following two specific objectives.
i. To evaluate determinants of Nepali trade
ii. To assess Nepali trade before and after the accession to the WTO
3. Methodology
3.1. DataThe data on an export and an import of “Goods and Services”, value addition of agriculture, industry and service sectors, the Gross National Income (GNI) and the Exchange rate was accessed from the World Bank databank (http://databank.worldbank.org/data/home.aspx) since 1965 to 2015. Thus, obtained data were transformed into billion USD from current USD except official exchange rate. The official exchange rate was taken as local currency per USD. To evaluate the diversification of the destination for Nepal’s international trade, data from fiscal year 1994/95 to 2016/17 were used from the Nepal Rastra Bank, the central bank of Nepal
(https://nrb.org.np/red/publications/economic_bulletin/Quarterly_Economic_Bulletin--2017-04_(Mid_April)-new.pdf).
3.2. Model specification
The three models were specified to conduct the study. The first model dealt with total trade. Total trade is defined as the sum of the export and the import of an individual year. Total trade was assigned as a dependent variable and remaining variables – agriculture value addition, service value addition, industrial value addition, GNI and the exchange rate were used as the independent variables. Then, the multiple regression models for the total trade were defined as
Y = X β +e ……….(1) e~ independent identical distribution N(0, σ2) Where,
Y = (51 × 1) Total Trade Value vector
X = (51 × 6) (AgVA, SerVA, IndVA, GNI, Ex and Constant) with first column is one vector β = (6×1) least square estimator vector
e = (50×1) error term vector
Further, the models have been specified to assess the impact on the export and the import using same dependent variables.
Ye = Xe βe +e ……….(2) e~ independent identical distribution N(0, σ2) Where,
Ye = (51 × 1) Total Trade Value vector
Xe = (51 × 6) (AgVA, SerVA, IndVA, GNI, Ex and Constant) with first column is one vector βe = (6×1) least square estimator vector
e = (50×1) error term vector Similarly,
Yi = Xi βi +e ……….(3) e~ independent identical distribution N(0, σ2) Where,
Yi = (51 × 1) Import Value vector
Xi = (51 × 6) (AgVA, SerVA, IndVA, GNI, Ex and Constant) with first column is one vector βi = (6×1) least square estimator vector
12
Here,TV = total trade volume in billion USD
AgVA = Agriculture value addition in billion USD SerVA = Service value addition in billion USD IndVA = Industrial value addition in billion USD GNI = Gross National Income in billion USD Ex = Official exchange rate in Local currency to USD
3.3. Data Analysis
The data was analyzed using the ordinary least square technique. The statistical package R is used for the data analysis.
4. Results
The results has been presented obtained from the analysis.
4.1. Descriptive Analysis
The descriptive analysis, mean, median, variance, standard deviation and number of observations were considered. The table below presents the descriptive analysis of the dataset.
Table 1: Descriptive analysis of the variables
TV
AgVA
SerVA
IndVA
GNI
Ex
median
1,179.62
1,644.67
1,104.30
556.71
3,531.84
29.37
mean
2,501.36
2,090.16
2,205.26
854.97
5614.17
41.23
variance
8322129.00 2805672.00 7179445.00 701909.80 33701760.00 927.99
std.dev
2884.81
1675.01
2679.45
837.80
5805.32
30.46
No. observations
51
51
51
51
51
51
Trade Value (TV), Agriculture Value Addition (AgVA), Service Value Addition (SerVA), Industrial Value Addition (IndVA) and Gross National Income (GNI) are in billion USD. The exchange rate (Ex) is in Nepali Rupee per USD.
4.2. Total Trade
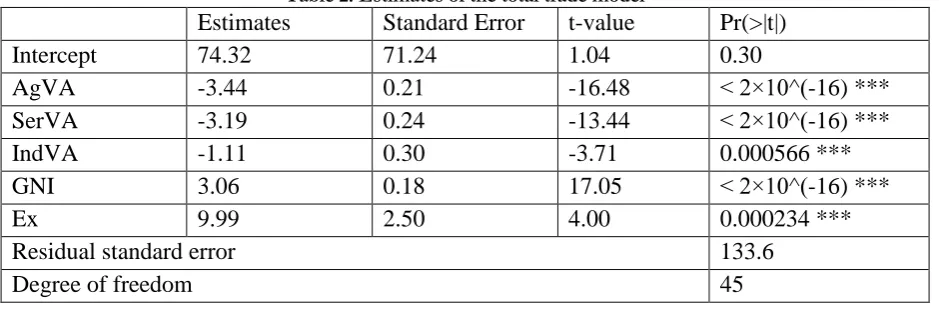
To assess the determinants of total trade a multiple regression was employed and the result has been presented in Table 2.
Table 2: Estimates of the total trade model
Estimates
Standard Error
t-value
Pr(>|t|)
Intercept
74.32
71.24
1.04
0.30
AgVA
-3.44
0.21
-16.48
< 2×10^(-16) ***
SerVA
-3.19
0.24
-13.44
< 2×10^(-16) ***
IndVA
-1.11
0.30
-3.71
0.000566 ***
GNI
3.06
0.18
17.05
< 2×10^(-16) ***
Ex
9.99
2.50
4.00
0.000234 ***
Residual standard error
133.6
13
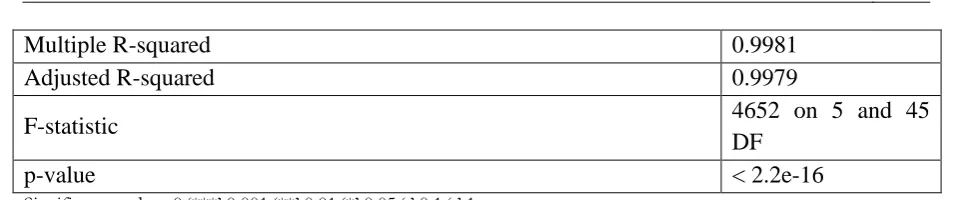
Multiple R-squared
0.9981
Adjusted R-squared
0.9979
F-statistic
4652 on 5 and 45
DF
p-value
< 2.2e-16
Significant. codes: 0 ‘***’ 0.001 ‘**’ 0.01 ‘*’ 0.05 ‘.’ 0.1 ‘ ’ 1
The final model for total trade is
TV = 74.32 + (-3.44) AgVA + (-3.19) SerVA + (-1.11) IndVA + 3.06 GNI + 9.99 Ex ………(4)
The independent variables in the model are explaining the total trade by 99.81% as multiple R-squared value was found 0.9981 with the p-value less than 2.2*10^(-16) and all dependent variables are highly significant. Moreover, all the value additions – agriculture, service and industrial were found negatively affecting the total trade. However, the GNI and the official exchange rate were found positively affecting the total trade. The model suggests that the total trade goes on increasing with decreasing rate if all the value additions increase. A unit increase in agriculture value addition leads to decrease the total trade by 3.44 billion USD if all other variables kept constant. Similarly, a unit increase in the service value addition leads to decrease the total trade by 3.19 billion USD – keeping all other variables constant. Likewise, a unit increase in industrial value addition causes a decrease in the total trade by 1.11 billion USD, subjected to an assumption of keeping other variables constant. In case of the GNI, a unit increment in the GNI increases the total trade by 3.06 billion USD. Finally, a unit increase in the official exchange rate causes increase in the total trade by 9.99 USD.
4.3. Export
To determine the factor affecting Nepali export the multiple regression model was run and the result was presented in Table 3.
Table 3: Estimates for the Export Model
Estimates
Standard Error
t-value
Pr(>|t|)
Intercept
41.93
43.95
0.95
0.34
AgVA
-0.67
0.13
-5.24
4.11e-06 ***
SerVA
-0.67
0.14
-4.55
4.04e-05 ***
IndVA
0.38
0.19
2.05
0.0462 *
GNI
0.52
0.11
4.64
2.98e-05 ***
Ex
8.91
1.54
5.78
6.61e-07 ***
Residual standard error
82.43
Degree of freedom
45
Multiple R-squared
0.9865
Adjusted R-squared
0.985
F-statistic
657.8 on 5 and
45 DF
p-value
< 2.2e-16
14
The final export model is:Export = 41.93 + (-0.67) AgVA + (-0.67) SerVA + (0.38) IndVA + 0.52 GNI + 8.91 Ex ………(5)
The independent variables in the model are explaining the total trade by 98.65% as multiple R-squared value was found 0.9865 with the p-value less than 2.2*10^(-16) and all dependent variables are highly significant except industrial value addition which is significant at 90%. Two value additions – agriculture and service, were found negatively affecting the export. However, the industrial value addition, the GNI and the official exchange rate were found positively affecting the export. A unit increase in agriculture value addition leads to decrease the total trade by 0.67 billion USD if all other variables kept constant. Similarly, a unit increase in the service value addition leads to decrease the total trade by 0.67 billion USD – keeping all other variables constant. Likewise, a unit increase in industrial value addition causes increase in the total trade by 0.38 billion USD, subjected to assumption of keeping other variables constant. In case of the GNI, a unit increment in the GNI increases the total trade by 0.52 billion USD. Finally, a unit increase in the official exchange rate causes increase in the total trade by 8.91 USD.
4.4. Import
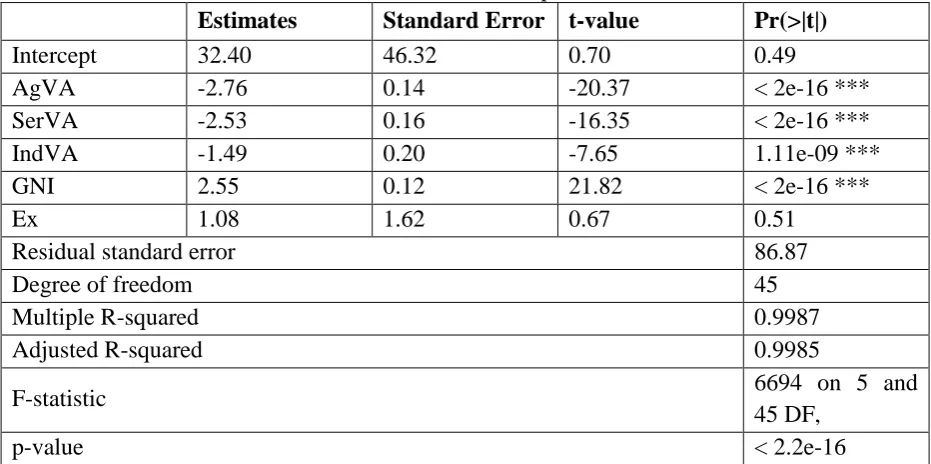
To assess the determinants of import, the multiple regression model was executed, and the result has been presented in Table 4.
Table 4: Estimates for the import model
Estimates
Standard Error t-value
Pr(>|t|)
Intercept
32.40
46.32
0.70
0.49
AgVA
-2.76
0.14
-20.37
< 2e-16 ***
SerVA
-2.53
0.16
-16.35
< 2e-16 ***
IndVA
-1.49
0.20
-7.65
1.11e-09 ***
GNI
2.55
0.12
21.82
< 2e-16 ***
Ex
1.08
1.62
0.67
0.51
Residual standard error
86.87
Degree of freedom
45
Multiple R-squared
0.9987
Adjusted R-squared
0.9985
F-statistic
6694 on 5 and
45 DF,
p-value
< 2.2e-16
Signif. codes: 0 ‘***’ 0.001 ‘**’ 0.01 ‘*’ 0.05 ‘.’ 0.1 ‘ ’ 1
The final model for import is:
Export = 32.40+(-2.76) AgVA+(-2.53) SerVA+(-1.49) IndVA+2.55 GNI+1.08 Ex ………(6)
15
the service value addition leads to decrease the total trade by 2.53 billion USD – keeping all other variables constant. Likewise, a unit increase in industrial value addition causes decrease in the total trade by 1.49 billion USD, subjected to assumption of keeping other variables constant. In case of the GNI, a unit increment in the GNI increases the total trade by 2.55 billion USD. Finally, a unit increase in the official exchange rate causes increase in the total trade by 1.08 USD.
Comparing all these three models, the agricultural value addition and service value addition were found negatively affecting the total trade, export and import. However, the GNI and the exchange rate were found positively affecting the total trade, export and import. In the case of Industrial value addition, it was found positively affecting in export but negatively affecting total trade and import.
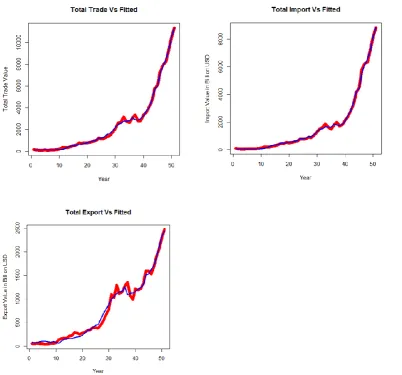
Figure 1: Fitted line for all three regression models. (Red colour indicates original value and blue colour indicates predicated value)
The figure suggests that the model can predict the total trade, export and import with higher degree of accuracy.
5. Conclusion
16
value addition, industrial value addition and service value addition showed a different impact on Nepali international trade. In the case of total value, all value additions are affecting negatively. The more insight was obtained from disaggregation of the total trade value into export and import. For the export industrial value addition was found positively contributing while agricultural value addition and service value addition were still found negatively affecting with marginal effect. As in total trade, import was found negatively affected by all value additions. It showed that if all – agricultural, service and industrial value additions were increased, import can be reduced. The model suggested that agricultural and service value additions are stronger factors to reduce import. In the case of export, the model suggested that industrial value addition is good option to promote export. The GNI and exchange rate were found strong positive influencing factors affecting to total trade, export and import. The higher exchange rate was found favorable for the promotion of export rather than import.
The surge of the import alone is not a bad indicator for developing economies like Nepal. However, disaggregation of import list suggested that the increasing imports are merely promoting productivity of the economy since most of the imports are for immediate consumptions. Therefore, increasing import is exerting pressure to the domestic industry and negatively affecting their welfare.
Considering increasing trade deficit of Nepal, the export and import models, used here, have provided useful information for policy-makers to manipulate trade policy to achieve narrow down trade deficit. Similarly, significant trade diversification is crucial for the export promotion and import management.
References
Adhikari, R., Dahal, N., & Pradhananga, M. (2008). Ensuring Development-Supportive Assession of the Least Developed Countries to the WTO: Learning from Nepal. Kathmandu: International Institute for Sustainable Development.
CBS. (2014). Population monograph of Nepal. Kathmandu: Central Bureau of Statistics, National Planning Commission Secretariat, Government of Nepal.
Jull, C. (2006). The impact of agriculture-related WTO agreements on the domestic legal framework in the Kingdom of Nepal. Rome: United Nations Food and Agriculture Organization.
MoAD. (2015). Statistical Information in Nepalese Agriculture. Kathmandu: Ministry of Agricultural Development(MoAD), Government of Nepal.
MoF. (2017). Economic Survey 2016/17. Kathamndu: Ministry of Finance, Government of Nepal.
NRB. (2017). Nepal Rastra Bank: Quarterly Economic Bulletin -Mid April 2017. Kathmandu: Nepal Rastra Bank (NRB).
OECD. (2017, 6 12). Trade liberalisation. Retrieved from OECD: http://www.oecd.org/tad/tradeliberalisation.htm Pandey, P. R., Adhikari, R., & Wagle, S. (2014). Nepal's Accession to the World Trade Organization: Case Study of
Issues Relevant to Least Developed Countries. New York: United Nations Department of Economic and Social Affairs.
TEPC. (2017). Export Import Data Bank. Retrieved from Trade and Export Promotion Center: http://www.efourcore.com.np/tepcdatabank/transactionmonthwise.php?searchreport=transactionmonthwise.p hp