www.biogeosciences.net/6/2743/2009/
© Author(s) 2009. This work is distributed under the Creative Commons Attribution 3.0 License.
Biogeosciences
Patterns of dissolved organic carbon and nitrogen fluxes in
deciduous and coniferous forests under historic high nitrogen
deposition
S. Sleutel1, J. Vandenbruwane1, A. De Schrijver2, K. Wuyts2, B. Moeskops1, K. Verheyen2, and S. De Neve1
1Department of Soil Management, Ghent University, Coupure Links 653, 9000 Ghent, Belgium 2Laboratory of Forestry, Ghent University, Geraardsbergsesteenweg 267, 9090 Melle, Belgium
Received: 5 June 2009 – Published in Biogeosciences Discuss.: 16 July 2009
Revised: 14 October 2009 – Accepted: 29 October 2009 – Published: 1 December 2009
Abstract. Numerous recent studies have indicated that dis-solved organic carbon (DOC) and nitrogen (DON) play an important role in C and N cycling in natural ecosystems, and have shown that N deposition alters the concentrations and fluxes of dissolved organic substances and may increase leaching losses from forests. Our study was set up to ac-curately quantify concentrations and flux patterns of DOC, DON and dissolved inorganic nitrogen (DIN) in deciduous and coniferous forest in Flanders, Belgium, under histori-cal high nitrogen deposition. We measured DOC, DON and DIN concentrations at two weekly intervals in a silver birch (SB) stand, a corsican pine (CP) stand and a pine stand with higher N deposition (CPN), and used the SWAP model (cal-ibrated with PEST) for generating accurate water and matter fluxes. The input with precipitation was an important source of DON, but not for DOC. Release of DOC from the for-est floor was minimally affected by forfor-est type, but higher N deposition (CPN stand) caused an 82% increase of DOC release from the forest floor. Adsorption to mineral soil ma-terial rich in iron and/or aluminum oxyhydroxides was sug-gested to be the most important process removing DOC from the soil solution, responsible for substantial retention (67– 84%) of DOC entering the mineral soil profile with forest floor leachate. Generally, DON was less reactive (i.e. less re-moval from the soil solution) than DOC, resulting in decreas-ing DOC/DON ratios with soil depth. We found increased DOC retention in the mineral soil as a result of higher N de-position (84 kg ha−1yr−1additional DOC retention in CPN
compared to CP). Overall DON leaching losses were 2.2, 3.3 and 5.0 kg N yr−1 for SB, CP and CPN, respectively,
con-Correspondence to: S. De Neve ([email protected])
tributing between 9–28% to total dissolved N (TDN) leach-ing. The relative contribution to TDN leaching from DON loss from SB and CP was mainly determined by (large) dif-ferences in DIN leaching. The large TDN leaching losses are alarming, especially in the CPN stand that was N saturated.
1 Introduction
Soil organic matter (SOM) is generally subdivided in two operationally defined fractions, namely solid and dissolved organic matter. Dissolved organic matter (DOM) is opera-tionally defined as the continuum of organic compounds in the dissolved phase passing a filter with a certain pore size (mostly 0.45µm). Dissolved organic carbon (DOC) and ni-trogen (DON) are thus defined as the carbon and nini-trogen included in the DOM. The high mobility of DOM results in translocation of organic material and nutrients within and be-tween ecosystems. The downward transport of DOM and as-sociated elements with percolating water also plays a crucial role in soil formation (Zysset and Berggren, 2001), nutrient loss (Kaiser et al., 2001) and eutrophication of ground and surface waters. DOC and DON produced in upland forest soils can leach below the rooting zone and move into aquatic ecosystems (Perakis and Hedin, 2002), where they can influ-ence ecosystem processes.
and chemical composition of DOM are related to a large number of external and internal chemical and physical fac-tors (Kalbitz et al., 2000). Precipitation, average temperature (Christ and David, 1996) and the number of drying-rewetting cycles (Prechtel et al., 2000) can be considered to be more or less constant within certain climatic regions. External dis-turbing influences, mostly as a result of human activities, are much more variable and have been reported to change the chemical composition, concentrations and thus fluxes of DOM. Of these disturbing factors, sulfate deposition (Evans et al., 1988), changes in soil solution ionic strength (Kalbitz et al., 2000) and pH (Vance and David, 1992), and ecosystem nitrogen input (Pregitzer et al., 2004) with throughfall water were found to be the most important.
During the last century, the concentration of nitrogenous compounds in the atmosphere increased as a result of hu-man activities. Combustion of fossil fuels and intensive live-stock breeding are probably the two major sources of reac-tive N forms in the atmosphere (Galloway et al., 1995). This increased atmospheric nitrogen emission resulted in an ele-vated wet and dry deposition in aquatic and terrestrial ecosys-tems, causing changes in biogeochemical cycles (Aber et al., 1989), including cycling of DOM (McDowell et al., 2004).
Contradictory results have been reported concerning the effect of elevated N deposition on DOM cycling within ecosystems and various mechanisms have been hypothesized and tested. Sj¨oberg et al. (2003) found no significant changes in DOC and DON production in mor humus after repeated N additions in a lab experiment. Also Raastad and Mul-der (1999) found no significant effects on DOC and DON concentrations after 4 years of nitrogen addition to a forested catchment in Sweden. Currie et al. (1996) found fluxes of DON from the forest floor to be positively correlated with rates of N addition, but export of DON from the mineral soil appeared unaffected by 7 years of N amendments. Park et al. (2002) found a reduced DOC release, but increased re-lease of DON and dissolved inorganic nitrogen (DIN) from a deciduous forest floor after NH4NO3amendments. Magill
et al. (2000) found no effect of nitrogen additions on DOC concentrations, but reported increased DON concentrations in soil water at 60 cm depth. Pregitzer et al. (2004) reported dramatic increases in leaching losses of DOC and DON dur-ing an 8-year N addition experiment in the field. Also Fang et al. (2008) found very large DON leaching losses in forests under large ambient N deposition and found that experimen-tal N additions further increased DON losses in the study forests (Fang et al., 2009).
Despite the important role that is attributed to DOC and DON dynamics and leaching in many ecosystems, relatively few studies have estimated actual fluxes of DOC and DON leaving the soil system. In those studies that estimated annual DOC and DON fluxes, water balances and water fluxes have most often been obtained in a very simple manner. Moreover, the potential impact of increased N deposition on DOC and DOM cycling in forest ecosystems has mostly been studied
in laboratory and field manipulation experiments in which mineral nitrogen forms are artificially added to the ecosys-tem. However, these manipulation experiments all cover a limited time scale that will often not be sufficient to reach a new equilibrium situation. Finally, DOC and DON fluxes have usually been measured at only one or two ecosystem strata. Therefore, the objective of this study was to accurately quantify concentration and flux patterns of DOC and DON in the different ecosystem strata (bulk deposition, throughfall, and four soil compartments) of a deciduous and coniferous forest on sandy soil in Flanders that had been subjected to high N depositions for several decades. We also investigated the effect of additional atmospheric N deposition on DOC and DON dynamics by including a forest edge exposed to the prevailing wind direction. An explicit goal of this study was to quantify the potential effect of forest type and deposition load on the relative contribution of DON in total dissolved N (TDN) leaching.
2 Materials and methods 2.1 Site description
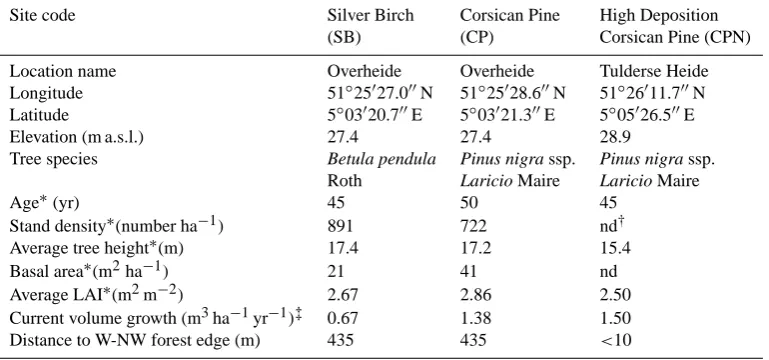
Table 1. Stand characteristics of the three selected forest stands.
Site code Silver Birch Corsican Pine High Deposition (SB) (CP) Corsican Pine (CPN) Location name Overheide Overheide Tulderse Heide Longitude 51◦25027.000N 51◦25028.600N 51◦26011.700N Latitude 5◦03020.700E 5◦03021.300E 5◦05026.500E Elevation (m a.s.l.) 27.4 27.4 28.9
Tree species Betula pendula Pinus nigra ssp. Pinus nigra ssp.
Roth Laricio Maire Laricio Maire
Age∗(yr) 45 50 45
Stand density∗(number ha−1) 891 722 nd† Average tree height∗(m) 17.4 17.2 15.4 Basal area∗(m2ha−1) 21 41 nd Average LAI∗(m2m−2) 2.67 2.86 2.50 Current volume growth (m3ha−1yr−1)‡ 0.67 1.38 1.50 Distance to W-NW forest edge (m) 435 435 <10
∗Results from complete stand survey in 2006; †nd = not determined;
‡data deducted from Jansen et al. (1996).
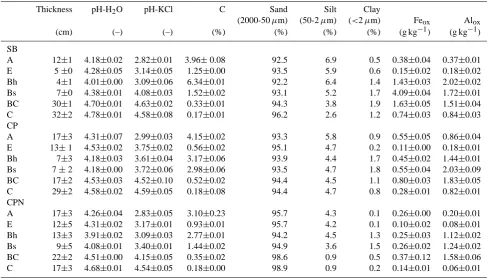
according to USDA Soil Taxonomy. Composite soil sam-ples (15 augerings per composite sample) were airdried and homogenized, sieved over a 2 mm mesh and analysed for im-portant general soil properties (Table 2). The pH was mea-sured potentiometrically in a 1/2.5 soil/1 M KCl extract (pH-KCl) and in a 1/5 soil/water extract (pH-H2O). Total carbon
(Ctot)and total nitrogen (Ntot)were measured by dry
com-bustion at 850◦C using an elemental analyzer (Vario MAX CNS, Elementar, Germany). The NH+4-acetate method was used to determine the cation-exchange capacity (CEC) of the soils. Particle-size distribution was determined by the pipette method. Ammonium oxalate-extractable iron and aluminum (Feoxand Alox)was extracted using the method of Jackson
et al. (1986) and then measured with an atomic absorption spectrophotometer (SpectrAA, Varian, Belgium).
The forest floor of the three forest stands consisted of a succession of Oi, Oe and Oa layers, with a sharp boundary between the Oa and mineral A horizon. Consequently the forest floors were classified as mor humus types. The thick-ness of the forest floor (Oi+Oe+Oa) was 5, 3 and 2 cm in the SB, CP and CPN stands, respectively. Forest floor material (Oi+Oe+Oa) from a 0.25 m2square was completely sampled in 9 replicates at each of the three forest stands and weighed under field moist conditions. Subsamples of these homoge-nized samples were taken for chemical analyses. Portions of these subsamples were dried at 60◦C for 96 h to determine moisture content and the amount of dry forest floor material per m2 was calculated. The dried subsamples were ground using a ball-mill and stored in glass vials until further chem-ical analyses (Table 3).
2.2 Experimental set-up and sample collection
Litterfall in the three forest stands was collected in 9 repli-cates using round collection baskets (0.25 m2)equipped with nylon wire netting at 60 cm above the soil surface for 1 year. An inert PVC weight was used to prevent the samples to be blown over the edge of the basket. Samples were collected monthly and dried at 60◦C for dry matter determination. The dried samples from each collection basket were then bulked per location and ground for further chemical analyses.
Within each of the forest stands, three replicate plots of about 20 m2 each and spaced about 10 m apart were estab-lished to monitor the amount and composition of throughfall water, forest floor leachate, soil solution and groundwater. In SB and CP, the plots were installed in the middle of the stands to avoid edge influences, while in CPN, plots were installed within the first 10 m from the exposed forest edge. Water samples were collected and measured fortnightly be-tween March 2005 and March 2006. The three replicate plots within the each of the three forest stands can be considered as pseudo-replicates, and not as completely independent repli-cates. However, this choice of replication was the only man-ner to have the replicates within these three forest stands on one homogenous soil type.
Table 2. Mineral soil properties to a depth of 90 cm at the three sites under investigation (SB: silver birch, CP: Corsican pine, CPN: high
deposition Corsican pine).
Thickness pH-H2O pH-KCl C Sand Silt Clay
(2000-50µm) (50-2µm) (<2µm) Feox Alox
(cm) (–) (–) (%) (%) (%) (%) (g kg−1) (g kg−1)
SB
A 12±1 4.18±0.02 2.82±0.01 3.96±0.08 92.5 6.9 0.5 0.38±0.04 0.37±0.01 E 5±0 4.28±0.05 3.14±0.05 1.25±0.00 93.5 5.9 0.6 0.15±0.02 0.18±0.02 Bh 4±1 4.01±0.00 3.09±0.06 6.34±0.01 92.2 6.4 1.4 1.43±0.03 2.02±0.02 Bs 7±0 4.38±0.01 4.08±0.03 1.52±0.02 93.1 5.2 1.7 4.09±0.04 1.72±0.01 BC 30±1 4.70±0.01 4.63±0.02 0.33±0.01 94.3 3.8 1.9 1.63±0.05 1.51±0.04 C 32±2 4.78±0.01 4.58±0.08 0.17±0.01 96.2 2.6 1.2 0.74±0.03 0.84±0.03 CP
A 17±3 4.31±0.07 2.99±0.03 4.15±0.02 93.3 5.8 0.9 0.55±0.05 0.86±0.04 E 13±1 4.53±0.02 3.75±0.02 0.56±0.02 95.1 4.7 0.2 0.11±0.00 0.18±0.01 Bh 7±3 4.18±0.03 3.61±0.04 3.17±0.06 93.9 4.4 1.7 0.45±0.02 1.44±0.01 Bs 7±2 4.18±0.00 3.72±0.06 2.98±0.06 93.5 4.7 1.8 0.55±0.04 2.03±0.09 BC 17±2 4.53±0.03 4.52±0.10 0.52±0.02 94.4 4.5 1.1 0.80±0.03 1.83±0.05 C 29±2 4.58±0.02 4.59±0.05 0.18±0.08 94.4 4.7 0.8 0.28±0.01 0.82±0.01 CPN
A 17±3 4.26±0.04 2.83±0.05 3.10±0.23 95.7 4.3 0.1 0.26±0.00 0.20±0.01 E 12±5 4.31±0.02 3.17±0.01 0.93±0.01 95.7 4.2 0.1 0.10±0.02 0.08±0.01 Bh 13±3 3.91±0.02 3.09±0.03 2.77±0.01 94.2 4.5 1.3 0.25±0.03 1.12±0.02 Bs 9±5 4.08±0.01 3.40±0.01 1.44±0.02 94.9 3.6 1.5 0.26±0.02 1.24±0.02 BC 22±2 4.51±0.00 4.15±0.05 0.35±0.02 98.6 0.9 0.5 0.37±0.12 1.58±0.06 C 17±3 4.68±0.01 4.54±0.05 0.18±0.00 98.9 0.9 0.2 0.14±0.01 0.06±0.01
Table 3. Main properties of forest floor material and annual litterfall at the three selected forest stands.
Silver Birch Corsican Pine High Deposition Corsican Pine
(SB) (CP) (CPN)
Forest floor
Dry matter (DM) (kg m−2) 5.80±1.50a 5.30±1.36a 4.00±0.50b Ash (%) 14.9±14.7a 19.8±10.4a 27.4±12.9a Ctot(%) 48.4±4.1a 45.8±4.0a 43.7±1.4a
Ntot(%) 2.24±0.23a 1.70±0.32b 1.61±0.33b
C/N 21.6±0.5a 27.0±3.1b 27.2±3.5b pH-H2O 3.79±0.02a 3.80±0.03a 4.02±0.01b
Annual litterfall
Dry matter (kg m−2yr−1) 0.37±0.02a 0.82±0.10b 0.56±0.13a Ctot(%) 50.5±0.1a 49.4±0.5b 49.6±0.6b
Ntot(%) 1.56±0.05a 0.82±0.11b 1.07±0.10a
C/N 32.4±1.1a 60.2±12.2b 46.4±8.9b
a,bMeans with a different letter within the same line differ significantly at thep <0.05 level.
flux and N flux to the forest floor is generally limited to 2 and 1%, respectively (Alcock and Morton, 1985). Through-fall and precipitation water were collected using polyethy-lene funnels (177 cm2)supported by and draining into two-liter polyethylene bottles. The bottles were placed below ground level to keep the samples cool and to protect them
[image:4.595.123.473.429.599.2]were discarded, and the remaining samples of each plot were pooled volume-weighted to one bulk sample. A 300 ml sub-sample was then taken for chemical analysis.
The forest floor leachate was collected using three zero-tension lysimeters per plot, installed directly underneath the forest floor. These lysimeters were made from 30 cm long rectilinear polyvinylchloride (PVC) guttering (338 cm2) cov-ered with wire netting (1.5 mm mesh size) and connected with 20 cm flexible PVC tubing to a two-liter PE bottle in-stalled beneath the lysimeter. At every sampling event, the three forest floor leachate samples of each plot were pooled volume-weighted to one bulk sample and the PE sampling bottles were replaced by collectors that were rinsed with dis-tilled water.
The soil solution in the different horizons was sampled us-ing acid washed ceramic suction cup lysimeters (Model 1900 Soil Water Sampler with B02M2 cup, Soilmoisture Equip-ment Corp., Santa Barbara, USA). A preliminary experiEquip-ment indicated that these lysimeters have least influence on the sampled DOC concentration compared to other types (Van-denbruwane, 2008). Per plot (three replicate plots per site), a lysimeter was installed at each of three depths (15, 25 and 65 cm, corresponding approximately to the bottom of the E, Bs and BC horizon) to sample the percolating water. The applied suction was−50 kPa. The lysimeters were installed 6 months before the start of the monitoring program and on average 3.2 l of soil solution was sampled by each lysimeter in order to bring them in equilibrium with the surrounding soil (solution) before the effective start of the sample collec-tion. No water could be extracted from the ceramic cups in the CP plots between mid September and the end of Novem-ber.
For groundwater sampling, perforated PVC tubes (4 cm diameter) equipped with PE tubing to the bottom, were in-stalled to a depth of 2.5 m in the mineral soil. At every sam-pling event, the depth of the groundwater table was measured using an electronic water level meter and the sampling tube was evacuated three times before effective sampling. The groundwater was pumped up through PE tubing draining into a B¨uchner flask which was connected to a vacuum pump.
The matric potential in the mineral soil of the SB and CP stand was monitored continuously using electronic tensiome-ters (T4, UMS GmbH, M¨unchen, Germany) connected to a datalogger (DL2e, Delta-T Devices Ltd., Cambridge, UK), equipped with an external 12 V power supply (TV-Batt, UMS GmbH, M¨unchen, Germany). Tensiometers were installed at three depths (15, 25 and 65 cm) in the three replicate plots of the SB and CP stands only, and the matric potentials were recorded at hourly intervals. For purposes of model calibra-tion (Appendix A), the moisture content of the soil at these depths was determined gravimetrically at four occasions and converted to volumetric moisture content using the bulk den-sities measured on intact soil cores.
Soil temperature at different depths in the soil profile (15, 25, 65 and 90 cm) was recorded in one SB plot on
an hourly base using electronic temperature probes with Fenwall-thermistor (Th2-f, UMS GmbH, M¨unchen, Ger-many) connected to a datalogger (DL2e, Delta-T Devices Ltd, Cambridge, UK) equipped with an external 12 V power supply (TV-Batt, UMS GmbH, M¨unchen, Germany). 2.3 Chemical analyses
Before analysis, all samples were filtered through 0.45µm nylon syringe filters (Rotilab®, Carl Roth GmbH, Karlsruhe, Germany) and kept at −18◦C until analysis. All samples were analyzed for DOC, TDN, NO−3 and NH+4 concentra-tion. Total dissolved carbon (TDC) and dissolved inorganic carbon (DIC) were determined on a Shimadzu TOC-V CPN-analyzer (Shimadzu Corp., Tokyo, Japan) with IR detec-tion following thermal oxidadetec-tion. Dissolved organic carbon (DOC) was calculated as the difference between TDC and DIC. Total dissolved nitrogen (TDN) was determined after alkaline persulfate oxidation (Koroleff, 1983) as NO−3 with a continuous flow autoanalyser. Samples were analyzed for dissolved inorganic nitrogen (DIN) ((NO−3+ NO−2)-N and NH+4-N) using a continuous flow autoanalyser (ChemLab System 4) and dissolved organic nitrogen (DON) was calcu-lated as the difference between TDN and DIN. A substantial subset of samples with various concentrations and origins, were analyzed for NO−2-N, but none were above the detec-tion limit. Detecdetec-tion limits for nitrate-N and ammonium-N were 0.21 and 0.03 mg N l−1respectively, whereas the 95% confidence interval (CI) and thus detection limit of the DON determinations was variable and depended on the DIN/TDN ratio (Vandenbruwane et al., 2007a).
2.4 Calculation of solute fluxes
Water fluxes of precipitation and throughfall were measured on site fortnightly. The water fluxes through the forest floor and mineral soil at different depths in the three forest stands were calculated using the mechanistic water-balance model SWAP (Table 4). Detail on these simulations is provided in Appendix A. Fortnightly solute fluxes were then calcu-lated by multiplying the fortnightly water fluxes by the fort-nightly solute concentrations. These solute fluxes where then summed to yield the annual solute flux for each stratum. For the period mid September – end November where no water could be extracted from the ceramic cups in the CP plots, in-terpolated values between the neighbouring sampling times were used.
2.5 Statistical analyses
Table 4. Water fluxes (mm yr−1)in the different strata of the three forest stands.
High Deposition
Stratum Silver Corsican Corsican
Birch (SB) Pine (CP) Pine (CPN)
Precipitationa 784 784 792
Throughfalla 654 569 504
Humus percolateb 649 564 497
E-horizonb 468 420 423
Bh-horizonb 376 358 368
BC-horizonb 281 210 224
Groundwater depthc 182 209 213
aResults from the actual measured volumes at the site. bResults from the SWAP model calculations. cAverage groundwater depth measured in field (cm).
bulk deposition collectors (SB and CP) and (CPN). Correla-tions between DOC and DON concentraCorrela-tions in forest floor leachates of each of the three stands and in the three min-eral horizons of the three stands together were analysed by linear regression analysis. The significance of the linear re-gressions was assessed using ANOVA. All statistical analy-ses were performed using SPSS 12.0. Since the solute fluxes result from the combination of measured concentrations with simulations of water fluxes with the SWAP model, the repli-cated outcomes of the flux calculations do not allow for a rigorous statistical analysis. However, an exhaustive error propagation analysis using Monte Carlo techniques, which would be appropriate in this case, was outside of the scope of this study.
3 Results
3.1 Nitrogen deposition
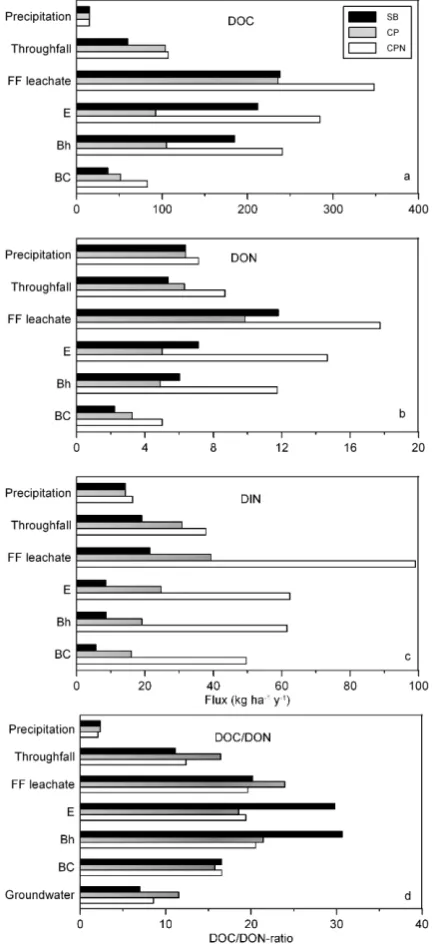
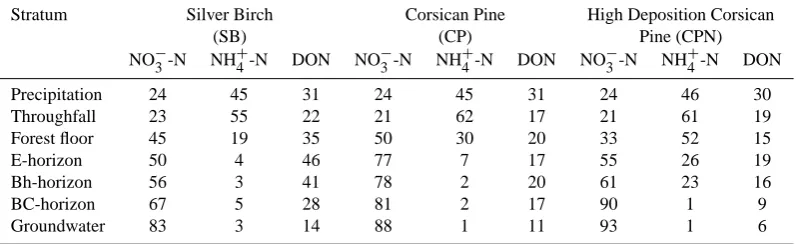
The bulk DIN deposition in precipitation at the Over-heide (SB and CP) and Tulderse Heide site (CPN) (14.2 kg DIN ha−1yr−1 and 16.4 kg DIN ha−1yr−1, respec-tively) were not significantly (p>0.05) different (Fig. 1), and neither was the DON deposition (6.4 kg DON ha−1yr−1 and 7.1 kg DON ha−1yr−1, respectively). As a result, the bulk TDN deposition with precipitation only differed about 3 kg N ha−1yr−1between the two sites, and this difference was not significant. Thus, DIN contributed for about 70% to the TDN deposition in this region and was mainly in the form of ammonium-N (65% of DIN) (Table 5).
[image:6.595.50.286.99.215.2]The DIN and DON throughfall fluxes differed between the two neighbouring stands; 19.1 and 5.4 kg N ha−1yr−1 in the SB stand and 30.8 and 6.3 kg N ha−1yr−1 in the adjacent CP stand, but according to Duncan’s MRT post-hoc test this difference was not significant. The DIN and DON throughfall fluxes in the CPN plots of 37.8 and
Fig. 1. Annual fluxes of dissolved organic carbon (DOC) (a),
ni-trogen (DON) (b) and dissolved inorganic nini-trogen (DIN) (c) and DOC/DON-ratio (d) in the different strata of the three forest stands (SB: silver birch, CP: Corsican pine, CPN: high deposition Corsican pine).
Table 5. Average TDN composition (as % of TDN) in the different strata of the three forest ecosystems over the 1 year sampling period.
Stratum Silver Birch Corsican Pine High Deposition Corsican
(SB) (CP) Pine (CPN)
NO−3-N NH+4-N DON NO−3-N NH+4-N DON NO−3-N NH+4-N DON Precipitation 24 45 31 24 45 31 24 46 30 Throughfall 23 55 22 21 62 17 21 61 19 Forest floor 45 19 35 50 30 20 33 52 15 E-horizon 50 4 46 77 7 17 55 26 19 Bh-horizon 56 3 41 78 2 20 61 23 16
BC-horizon 67 5 28 81 2 17 90 1 9
Groundwater 83 3 14 88 1 11 93 1 6
ANOVA, and hence significant differences reported above must be interpreted with caution.
3.2 Temporal concentration patterns of DOC and DON The DOC concentrations sampled below the forest floor showed a very similar pattern (largest concentrations in au-tumn) at the SB and CP sites, whereas a different pattern (little seasonal flucturations) and higher concentrations were found at the CPN site. The course of the DOC concentra-tions in the forest floor leachate was influenced by the water fluxes during the sampled fortnight and the preceding night(s) (Fig. 2). For instance, considering the three dry fort-nights in late May and June followed by a high water flux at the beginning of July, the DOC concentrations in the litter leachate increased steadily during the dryer weeks i.e. ac-cumulation of leachable DOM occurred in the forest floor during dryer periods. This accumulation effect for DOC was also observed on 27 July, 26 October and 22 December. The inverse effect i.e. dilution as a result of a higher water flux occurred on 10 August, 9 December and 23 February. In the SB and CP stands, lower DOC concentrations were observed with increasing soil temperature, whereas higher tempera-tures tended to increase DOC release from the forest floor material in the CPN stand.
The DON concentrations below the forest floor material exhibited no clear seasonal pattern in the SB and CP stands. DON concentrations tended to be larger in the CPN stand (but not significantly), and the largest concentrations were observed in summer and early autumn. Positive correlations between DOC and DON concentrations were found in the forest floor leachates of the SB and CP stands (r=0.461, p=0.063 andr=0.775,p=0.013, respectively). However, there was no correlation (p=0.481) between DOC and DON concentrations in the forest floor leachate of the CPN stand.
More or less constant DOC concentrations were measured below the BC horizon throughout the year at all sites, with limited seasonal fluctuations (Fig. 3). The restricted DOC fluctuations in the lower part of the soil profile compared to the larger variations in DOC concentrations entering the
min-eral soil suggest the presence of a mechanism controlling the DOC concentrations in the mineral soil.
The DON concentration below the BC horizon exhibited no clear seasonal pattern, and in general flucuations were larger than for DOC, especially in the CPN stand. DON con-centrations in the CPN stand tended to be largest in spring and summer.
3.3 Annual fluxes in the ecosystem strata
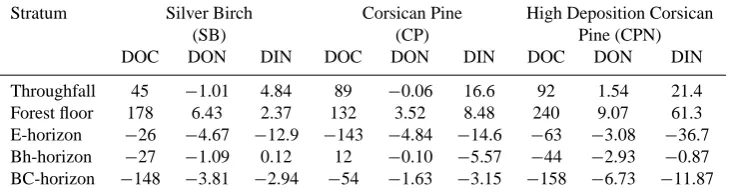
The DOC flux in precipitation water measured in our study was 15 kg ha−1yr−1 at both sites (Fig. 1a). Passage of precipitation water through the SB, CP and CPN canopies added 45, 89 and 92 kg DOC ha−1yr−1, respectively, to the throughfall water flux (Table 6).
The forest floor was by far the major source of DOC in these ecosystems (Table 6). Average DOC fluxes under the forest floor in the SB, CP and CPN were 236, 238 and 348 kg ha−1yr−1, respectively. Fluxes of DOC decreased consistently with depth in the mineral soil, though the ma-jor DOC retention took place at different depths: in SB and CPN most DOC (148 kg ha−1yr−1)was removed between the lower boundaries of the Bh and BC horizons, while in CP more DOC removal occurred in the upper horizons. The DOC fluxes leaching below the BC horizon ranged from 37 kg ha−1yr−1in the SB stand over 51 kg ha−1yr−1in the CP stand to 83 kg ha−1yr−1in the CPN stand (Fig. 1a), sug-gesting an influence of both tree species (SB versus CP) and forest edge proximity (CP versus CPN). Overall, the min-eral soil profile of the SB, CP and CPN stand retained 201, 185 and 265 kg DOC ha−1yr−1 respectively or 84, 79 and
Table 6. Net addition (indicated by a + sign) or removal (indicated by a−sign) (kg ha−1yr−1)of DOC, DON, and DIN from solution as it passed through each stratum or horizon. Calculated as: the flux through the stratum minus the flux through the stratum above.
Stratum Silver Birch Corsican Pine High Deposition Corsican
(SB) (CP) Pine (CPN)
DOC DON DIN DOC DON DIN DOC DON DIN Throughfall 45 −1.01 4.84 89 −0.06 16.6 92 1.54 21.4 Forest floor 178 6.43 2.37 132 3.52 8.48 240 9.07 61.3 E-horizon −26 −4.67 −12.9 −143 −4.84 −14.6 −63 −3.08 −36.7 Bh-horizon −27 −1.09 0.12 12 −0.10 −5.57 −44 −2.93 −0.87 BC-horizon −148 −3.81 −2.94 −54 −1.63 −3.15 −158 −6.73 −11.87
Similar as for DOC, the forest floor was the largest source of DON in the three forest stands releasing 6.4, 3.5 and 9.1 kg ha−1yr−1in the SB, CP and CPN stand respectively (Table 6), suggesting an effect of forest edge proximity on the release of DON from the forest floor. The total amount of DON retained by the mineral soil of the SB, CP and CPN stand was 9.6, 6.6 and 12.7 kg ha−1yr−1or 81, 67 and 72% of the DON entering the mineral soil, respectively. The an-nual DON fluxes leaving the rooting zone of these forest ecosystems were 2.2, 3.3 and 5.0 kg ha−1yr−1in the SB, CP
and CPN stand respectively (Fig. 1b). The DON concentra-tions further decreased by an additional 23, 14 and 32% be-tween the lower boundary of the BC horizon and the ground-water in the SB, CP and CPN stand, respectively. Thus, fur-ther DON removal processes are active in the deeper mineral soil, but retention was less intensive than for DOC.
3.4 Relationship between DON and DOC
The DON concentrations in the forest floor of SB and CP stands and in the different mineral soil compartments of the three forest stands were positively correlated with the mea-sured DOC concentrations. We found an average DOC/DON ratio in the mineral soil solutions of these ecosystems of about 24.
Generally, passage of rainwater through the forest canopy increased the DOC/DON ratio substantially, from 2.1–2.4 to 11–16 (Fig. 2). The forest floor leachate had DOC/DON val-ues of 20, 24 and 20 in the SB, CP and CPN stand, respec-tively, which were only just lower than the C/N ratios of the respective forest floor materials (22, 27 and 27, respectively). During passage through the mineral soil, the DOC/DON ratio remained more or less constant (±20–24 in CP and CPN) or increased to a maximum of 31 (SB), and then decreased sharply to 7–12 in the groundwater, suggesting a strong preferential removal of DOC compared to DON. Generally, DON showed smaller changes within the forest ecosystem compared to DOC, pointing towards lower over-all reactivity of N-containing DOM compounds.
3.5 Contribution of DON to TDN
On average, about 30% of the TDN in precipitation water consisted of DON (Table 5). Increase in DIN during passage through the forest canopies at the three stands, in combina-tion with the limited DON release (or retencombina-tion in the SB and CP stands) from the canopies, substantially reduced the con-tribution of DON to TDN fluxes (Table 5). DON represented 22, 17 and 19% of TDN in throughfall water in the SB, CP and CPN stands, respectively. The (relatively) larger DON release from forest floor material increased again the contri-bution of DON to TDN in the forest floor leachates in SB and CP. On the contrary, very large DIN release from the CPN forest floor lowered the DON contribution to TDN in forest floor percolates to only 15%. The contribution of DON to TDN decreased with depth in the mineral soil in the SB and CPN stands, whereas it remained rather constant in the CP stand.
4 Discussion
4.1 Major sources and sinks of DOC and DON
Although atmospheric deposition was a minor source of DOC in these ecosystems, it was the major net source of DON. Neff et al. (2002) indicated that the major sources of atmospheric organic nitrogen (AON) include byproducts of reactions between NOx and hydrocarbons, marine and
ter-restrial sources of reduced (amino acid) N and the long-range transport of organic matter (dust, pollen etc.) and bacteria.
Fig. 2. Average concentrations of dissolved organic carbon (DOC) (a), nitrogen (DON) (b) and dissolved inorganic nitrogen (DIN) (c)
in the zero-tension lysimeter samples from the forest floor collected from 21 March 2005 to 21 March 2006. Bars represent the average standard error over the monitoring period per forest stand. Water fluxes of litter leachate in the three forest stands and average air temperature during the measuring fortnights (d). (SB: silver birch, CP: Corsican pine, CPN: high deposition Corsican pine).
for a stoichiometric N enrichment of DOM as found here: (i) abiotic reaction between DOM and inorganic nitrogen and (ii) the microbial (mycorrhizal) incorporation of DIN with subsequent release of DON. Davidson et al. (2003) described an abiotic mechanism producing DON through reaction of nitrite with DOM. Colman et al. (2007), however, found that this apparent abiotic N incorporation was likely the result of iron interference with nitrate measurements.
Fig. 3. Average concentrations of dissolved organic carbon (DOC) (a) and nitrogen (DON) (b) and dissolved inorganic nitrogen (DIN) (c) in the lysimeter samples from the BC horizon collected from 21
March 2005 to 21 March 2006. Bars represent the average stan-dard error over the monitoring period per forest stand. Water fluxes (+=downward,−=upward) under the three forest stands and aver-age soil temperature during the measuring fortnights (d). (SB: silver birch, CP: Corsican pine, CPN: high deposition Corsican pine).
[image:9.595.316.537.69.539.2]strong sorbents for DOM (Kaiser et al., 1996), pointing to-wards sorption as the main removal mechanism. In CP re-tention was stronger closer to the soil surface, but this was related to Bs material laying closer to the surface. Also Qualls and Haines (1992) indicated that adsorption, rather than biodegradation, is more likely responsible for maintain-ing low DOC concentrations in the mineral soil.
We found decreasing DOC/DON ratios with increasing soil depth in the three forest stands, which is in accordance to the findings of Michalzik et al. (2001) and Lajtha et al. (2005). The latter attributed this difference to the pref-erential sorption of high C/N hydrophobic DOM to mineral soil constituents over hydrophilic DOM with a much lower and less variable C/N ratio. Several studies found higher DOC/DON ratios in the hydrophilic and hydrophobic acid fractions (which were found to be preferentially sorbed to iron and aluminum oxyhydroxides) and lower ratios in the hydrophilic neutrals fraction (e.g. Qualls and Haines, 1991). Sequential batch sorption experiments with the soils from this study involving chemical fractionation of DOC and DON (Vandenbruwane, 2008) confirmed the lower reactivity of DON compared to DOC.
Substantial amounts of DOC (71–76%) and DON (14– 32%) were retained between the lower boundary of the min-eral soil profile (<65 cm) and the groundwater. Schwesig et al. (2003) found that DOC leaching from the rooting zone is highly resistant to mineralization and concluded that the fur-ther decrease of DOC concentrations in the subsoil could not be attributed to mineralization. Siemens et al. (2003) showed that substantial amounts of DOM were removed by sorption in deeper mineral subsoil, and Jardine et al. (2006) indicated the importance of DOC accumulation in lower horizons for carbon sequestration.
4.2 Influence of the forest type
Although the adjacent SB and CP stands are subject to iden-tical bulk precipitation deposition, the DIN (and other ions) throughfall water fluxes tended to differ between both stands (but not significantly). It is generally known that, under iden-tical site and meteorological conditions, coniferous forests receive more atmospheric deposition via throughfall water than deciduous forest types. This difference can be explained by (i) the summer-green character of the deciduous forest (Rothe et al., 2002), (ii) differences in vegetation structure such as leaf area index (LAI), canopy height and canopy clo-sure (Erisman and Draaijers, 2003) and (iii) differences in form or shape of leaves or needles (Smith, 1981). As a re-sult, observed differences in DOM dynamics between for-est types are not solely due to inherent differences in DOM quality and quantity, but may result from indirect differences in biogeochemical and hydrological cycles which are related to the forest type. The coniferous forest had higher DOC and DON throughfall water fluxes compared to the
decidu-ous forest which can result from different canopy interactions between the studied forest types.
In contrast to the observed throughfall water fluxes, the forest type only slightly affected the DOC and DON fluxes via forest floor leachate. A higher percentage of the DON input with forest floor leachate was retained in the mineral soil of the SB stand (81%) compared to the CP stand (67%), suggesting a difference in the distribution of N over the dif-ferent DOM fractions. Since the CP stand intercepted more DIN than the SB stand, this finding is in accordance with the findings of McDowell et al. (2004) that proportionally more DON is in the hydrophilic fractions as a result of chronic ni-trogen amendments. Although the DOC/DON ratio in most strata differed substantially between both stands, the DOM leaching from the BC horizon showed a similar DOC/DON ratio under both forest types. However, since the number of measurements was both spatially and temporally limited, the observed differences should be interpreted with caution.
The major differences between the two forest stands were in the relative contribution of DON to TDN fluxes in the dif-ferent strata. Whereas DON was a substantial part of total nitrogen fluxes in the deciduous forest (28–46%), its con-tribution to TDN was only 20% at most in the coniferous forest. Since absolute DON fluxes differed only slightly be-tween both forest types, the differences in the DON/TDN ra-tio were mainly due to large differences in DIN fluxes. 4.3 Influence of forest edge proximity
One of the objectives of this study was to investigate the ef-fect of different levels of N throughfall deposition on the dy-namics of DOC and DON. Therefore, a forest stand CPN was selected with the forest edge oriented to the prevailing wind direction. Forest edges are more effective at filtering atmo-spheric deposition than forest interiors; they are subject to a so-called edge effect on throughfall deposition (De Schrijver et al., 2007; Draaijers, 1993). This edge effect significantly increases throughfall N deposition compared to the forest in-terior and decreases exponentially with increasing distance from the forest edge. The CPN stand indeed received higher TDN inputs with throughfall water compared to the CP and SB stands (+25%).
questionable whether the relatively limited increase in mea-sured N input (25%) can result in the large increase in DOM release from the forest floor (82%). However, two other fac-tors could help to explain the elevated DOM release:
i) the N throughfall deposition measured between March 2005 and March 2006 is relatively low compared to earlier studies in the same region under similar condi-tions (Neirynck et al., 2002). Although the N deposi-tion more than doubled between 1870 and 1980 (Asman et al., 1988), recent data indicated that N deposition in Flanders decreased with 18% between 1990 and 2004 (MIRA, 2006). Thus, although the N deposition and the difference in N input between both stands is relatively small to date, the biogeochemical cycles in all observed stands, but especially in the CPN stand (because of its proximity to the forest edge), are probably still influ-enced by the very large historical nitrogen inputs which lasted for several decades. Due to its colloidal prop-erties, the physico-chemical release of DOM from the forest floor is influenced to a considerable extent by the ionic strength and ionic composition of throughfall wa-ter (Kalbitz et al., 2000).
ii) Besides the elevated ion throughfall deposition flux, the proximity of a forest edge furthermore influences the microclimatic conditions (like light intensity, air temperature, relative humidity, soil moisture and litter moisture) (Marchand and Houle, 2006) which in turn also might affect DOM dynamics. Therefore, observed differences in DOM dynamics between both coniferous stands (CP and CPN) were probably due to a combi-nation of factors influenced by an edge effect of which increased N input is one.
The combination of larger DOC fluxes entering the min-eral soil with forest floor leachate, together with an almost equal percentagewise retention (by sorption) in the mineral soil (78% in CP and 76% in CPN) results in larger DOC retaining in the mineral soil in CPN (84 kg ha−1yr−1 addi-tional DOC retained compared to CP). This is in agreement with the findings of Hyv¨onen et al. (2008) concerning the impact of long-term N addition on carbon stocks in soils in northern Europe. Also, the DOC and DON fluxes leaving the rooting zone were substantially larger as a result of the forest edge effect. Similarly, Pregitzer et al. (2004) reported DOC and DON exports to be elevated by more than 3 and 6 times respectively after 8 years of artificial nitrate additions as NaNO3(30 kg N ha−1yr−1).
We assessed whether differences in DOC sorption capac-ity between stands could have influenced results of DOC (and DON) leaching between forest type and deposition level. To this end, we recalculated Feoxand Aloxconcentrations in the
B and B/C horizons on a molar basis, weighing molar con-centrations with depth of the B+B/C horizons (assuming an overall bulk density of 1.5). SB tended to have a larger
ad-sorptive capacity (58.6 mol Feox+Aloxm−2)compared to CP
and CPN (36.3 and 37.3 mol Feox+Aloxm−2, respectively).
However, DOC retention in the mineral soil (which can be considered mainly as sorption) in these forest was found to be 201, 185 and 265 kg DOC ha−1yr−1in SB, CP and CPN, respectively (Vandenbruwane, 2008), which does not relate directly to Feox and Alox concentrations. Vandenbruwane et
al. (2007b) indeed found that while the DOC sorption capac-ity in the Bh horizon was 80–100% saturated, it was only from 39–45% and 16–18% saturated in the Bs and BC hori-zons, respectively. Therefore, possible differences in sorp-tion capacity do not seem to have influenced DOC leaching in the different forest stands.
Still, the overall higher DIN fluxes in the CPN stand re-sulted in a smaller relative contribution of DON to TDN. Park and Matzner (2006) also found that the contribution of nitrate increased whereas that of DON decreased with increasing throughfall nitrogen input. Our results furthermore suggest that there is a difference in the location within the ecosystem strata where maximum nitrification occurs. In CP, most nitri-fication seems to occur in the forest floor, while in CPN this seems to be in the upper mineral horizons (A and E).
4.4 Leaching of DON
Previous studies of DON leaching under forest often con-sidered only DON concentrations directly beneath the forest floor (e.g. McDowell et al., 1998). Other studies where DON in the mineral soil was measured were often based on mea-surements of concentrations rather then fluxes. In the few studies where fluxes were calculated, this was mostly done based on much simplified water balances (e.g. Pregitzer et al., 2004). In this study time series of DON measurements in different ecosystem strata were coupled to accurate hydro-logical flux calculations to yield a reliable estimate of DON leaching fluxes below rooting depth and its contribution to overall N leaching losses.
only 6–14%, probably as a result of additional DON reten-tion in the deeper mineral horizons.
Our data indicated that the total nitrogen input (DON+DIN) with throughfall water was higher than the total N output through leaching to the groundwater in the three replicated plots of the SB and CP stand. This means that N still accumulates in these forest ecosystems. The opposite was found in the CPN plots, namely the export of nitrogen was larger than the input with throughfall water. These findings show that this ecosystem released nitrogen instead of taking it up, which may be an indication for nitrogen (over)-saturation as a result of the long-term high nitrogen deposition. The very large TDN concentrations at 65 cm depth especially in CPN (around 20 ppm TDN) and in the groundwater (flux weighed average concentration of 24.0 ppm DIN), both mainly as NO−3, are of serious concern. These groundwater concentrations are confirmed by balance calculations of yearly water (224 mm yr−1, Table 4) and
DIN fluxes below 65 cm (56.8 kg DIN ha−1yr−1), yielding a concentration of 25.4 ppm. It seems that especially in these pine forests excessive atmospheric inputs have created a situation where groundwater nitrate tresholds can no longer be met, especially in the forest edges exposed to the prevailing wind directions.
5 Conclusions
The inclusion of a forest edge allowed to evaluate long term differences in N deposition without the need for multi year artificial addition of N. Therefore, the results of this study reflect the true influence of long term elevated N deposition and gradients therein. Also, the monitoring of fluxes of DOC, DON and DIN at a large number of ecosystem strata (precip-itation, throughfall, forest floor, three mineral soil horizons and groundwater) allowed for a detailed analysis of sinks and sources of these compounds. Our results show that for mon-itoring of DOC and DON dynamics and leaching to ground-water sufficient vertical resolution is necessary, and measure-ments in only one or two ecosystem strata will not allow to make correct conclusions.
DON represented 30% of the TDN input with precipita-tion. The contribution of DON to ecosystem N inputs is ap-parently not negligible although it has frequently been omit-ted from ecosystem nutrient balances. The contribution of DON to TDN leaching was mainly determined by the DIN fluxes. Since these DIN fluxes are in turn determined by canopy interception of N, the DON/TDN ratio is influenced by forest type and forest edge proximity.
Appendix A
Calculation of hydrological fluxes
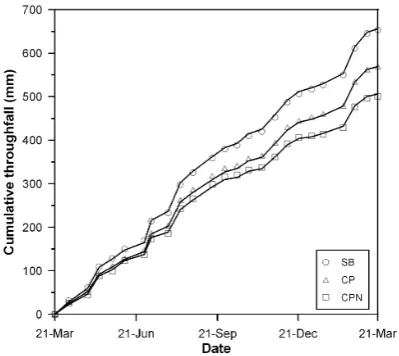
The fortnightly water fluxes of precipitation and canopy throughfall (mm) were determined using the measured water volumes at each sampling occasion. Because of the high tem-poral and spatial variability of the water volumes collected with the zero-tension lysimeters, forest floor leachate fluxes could not be quantified using the measured volumes.
Water balances and fluxes were calculated for the three dif-ferent forest stands and for each fortnightly sampling period of the one year monitoring program using the SWAP model (Van Dam, 2000; Van Dam et al., 1997). The water balance within this model can be described as:
P=E+R+D+Q+1S (A1)
whereP is the precipitation,Ethe evapotranspiration,Qthe leaching flux,R the runoff, Dthe lateral drainage and1S the change in the water storage in the soil profile.
Within the SWAP model, the potential evapotranspiration is calculated using the Penman-Monteith equation. The po-tential evapotranspiration is divided over interception evapo-ration, potential soil evaporation and potential transpiration. The total amount of interception in the forest stands was cal-culated according to Gash et al. (1995). Potential transpi-ration is calculated from the potential evapotranspitranspi-ration by reducing the evapotranspiration during rainfall with the cal-culated interception evaporation.
To calculate the hydrological fluxes, the application of the SWAP model requires (i) meteorological data, (ii) abiotic characteristics of the site (soil physical and drainage char-acteristics, grondwater level) and (iii) vegetation dependent parameters (including crop resistance, LAI or soil cover, stor-age capacity of the crown, tree height, rooting depth and root distribution).
A1 Meteorological data
Table A1. Measured soil hydrological characteristics (θres= residual water content;θsat= saturated water content;α= shape parameter;n=
shape parameters;Ksat= saturated hydraulic conductivity) for the three sites under investigation.
Depth (cm) θares θasat αa na Ksatb
(cm) (cm3cm−3) (cm3cm−3) cm−1 (-) (cm d−1)
SB
5–0c 0.000 0.500 0.100 1.25 800 0–17 0.068 0.405 0.021 1.82 336 17–21 0.076 0.409 0.020 2.83 404 21–58 0.034 0.332 0.017 3.92 321
>58 0.031 0.315 0.016 3.16 334 CP
3–0c 0.000 0.500 0.100 1.25 800 0–30 0.074 0.432 0.024 2.21 533 30–37 0.063 0.450 0.020 2.25 534 37–61 0.044 0.357 0.018 3.56 440
>61 0.034 0.316 0.016 3.31 348 CPN
2–0c 0.000 0.500 0.100 1.25 800 0–29 0.078 0.405 0.029 1.89 217 29–42 0.066 0.383 0.027 1.87 251 42–73 0.025 0.303 0.023 3.57 658
>73 0.039 0.300 0.019 2.86 386
aParameters resulting from the fit of the van Genuchten equation to the datapoints of the measured water retention curves; bparameter resulting from laboratory measurements;
cdata for the forest floor are based on Tiktak and Bouten (1994).
A2 Soil physical properties
Water retention curves of the forest soils at different depths were determined in the lab by measuring the water content of intact soil cores gravimetrically at six different matrix potentials (−3, −5, −7, −10, −33 and −100 kPa). This was done by means of the sandbox apparatus (Eijkelkamp Agrisearch Equipment, Giesbeek, The Netherlands) for ma-trix potentials between−3 and−10 kPa, and with pressure chambers (Soilmoisture Equipment, Santa Barbara, CA) for matrix potentials of−33 and−100 kPa. The model of van Genuchten (1980) was fitted to these data points to obtain the water retention parameters (Table A1). The saturated hy-draulic conductivity (Ksat)was measured in the lab on intact
soil cores using a constant head permeameter (Eijkelkamp Agrisearch Equipment, Giesbeek, The Netherlands).
Since the groundwater level was at a depth of 1.5 m or more throughout the experiment, free drainage of the soil profile at a depth of 90 cm was assumed. Run-off or run-on was set to zero since the study sites were located run-on flat terain with sandy soils. No lateral drainage was calculated for the three sites since ditches and canals were absent in the immediate proximity of the study plots.
A3 Stand characteristics
The most important stand parameters within the model are tree height, soil cover fraction (SC), storage capacity of the canopy (S), minimum crop resistance (rcrop), rooting depth
(Droot)and root distribution (`root). Tree height was
mea-sured using an ultrasonic height meter (Vertex III, Hagl¨of Sweden AB), while the other stand parameters were esti-mated using the parameter estimation package PEST (see further).
A4 Parameter estimation
Table A2. The most important stand and crop characteristics used in the SWAP model calculations.
Stand Daroot,f rcanopyb,f `croot,f SCd,f Interception parameters
(cm) (s/m) (–) (m2m−2) pe,f(–) Se,f(cm) SB 87 149 0.00/8.69/0.00/0.77 0.93/0.92/0.90g 0.70/0.98/0.70g 0.40/0.45/0.57g CP 71 138 0.09/3.34/0.00/1.70 1.00/1.00/0.93 0.69/0.69/0.62 0.47/0.39/0.23 CPN 71 138 0.09/3.34/0.00/1.70 0.91/1.00/0.77 0.63/0.58/0.40 0.37/0.35/0.29
aRooting depth;
bminimum canopy resistance;
crelative root density at four relative rooting depths (0.00; 0.20; 0.50; 1.00); dsoil cover fraction;
eparameters for Gash model to simulate interception for forests:p= free throughfall coefficient;S= storage capacity of canopy; fSWAP parameters estimated using PEST;
gparameter values at three crop development stages (DVS) (0.00; 1.00; 2.00).
Fig. A1. Cumulative throughfall volume (mm) for the three forest
stands in Ravels as measured on site from 21 March 2005 till 21 March 2006. The data points represent field measurements, whereas the solid lines represent the SWAP simulations optimized by PEST during calibration.
in this run were: the exponent in the hydraulic conductivity function (van Genuchten-Mualem equation) (λ)for the litter layer and the mineral soil, rooting depth, minimum canopy resistance and relative root density as a function of relative rooting depth (Tables A1 and A2).
Acknowledgements. This study was funded by the Special
Re-search Fund (BOF) of Ghent University. Steven Sleutel and An De Schrijver are post-doctoral research fellows of the Science Foundation Flanders (FWO). We thank T. Coddens, S. Schepens, L. Willems and G. De bruyn for the chemical analyses and G. Geudens, K. Avaux, L. Deboosere and M. Schatteman for help with the experimental set-ups. We thank the three anonymous reviewers for their valuable comments.
Edited by: S. Bouillon
References
Aber, J. D., Nadelhoffer, K. J., Steudler, P., and Melillo J. M.: Ni-trogen saturation in Northern forest ecosystems, BioScience, 39, 378–386, 1989.
Alcock, M. R. and Morton, A. J.: Nutrient content of throughfall and stemflow in woodland recently established on heathland, J. Ecol., 73, 625–632, 1985.
Asman, W. A. H., Drukker, B, and Janssen, A. J.: Modelled histor-ical concentrations and depositions of ammonia and ammonium in Europe, Atmos. Environ., 22, 725–735, 1988.
Blackwood, C. B., Waldrop, M. P., Zak, D. R., and Sinsabaugh, R. L.: Molecular analysis of fungal communities and laccase genes in decomposing litter reveals differences among forest types but no impact of nitrogen deposition, Environ. Microbiol., 9, 1306– 1316, 2007.
Brookshire, E. N. J., Valett, H. M., Thomas, S. A., and Webster, J. R.: Atmospheric N deposition increases organic N loss from temperate forests, Ecosystems, 10, 252–262, 2007.
Carreiro, M. M., Sinsabaugh, R. L., Repert, D. A., and Parkhurst, D. F.: Microbial enzyme shifts explain litter decay responses to simulated nitrogen deposition, Ecology, 81, 2359–2365, 2000. Christ, M. J. and David, M. B.: Temperature and moisture effects
on the production of dissolved organic carbon in a spodosol, Soil Biol. Biochem., 28, 1191–1199, 1996.
Colman, B. P., Fierer, N., and Schimel, J. P.: Abiotic nitrate incor-poration in soil: is it real?, Biogeochemistry, 84, 161–169, 2007. Currie, W. S., Aber, J. D., and McDowell, W. H.: Vertical transport of dissolved organic C and N under long term N amendments in pine and hardwood forests, Biogeochemistry, 35, 471–505, 1996. Davidson, E. A., Chorover, J., and Dail, D. B.: A mechanism of abiotic immobilization of nitrate in forest ecosystems: the fer-rous wheel hypothesis, Glob. Change Biol., 9, 228–236, 2003. De Schrijver, A., Geudens, G., Augusto, L., Staelens, J., Mertens, J.,
Wuyts, K., Gielis, L., and Verheyen, K.: The effect of forest type on throughfall deposition and seepage flux: a review, Oecologia, 153, 663–674, 2007.
Draaijers, G. P. J.: The variability of atmospheric deposition to forests: the effects of canopy structure and forest edges, PhD Dissertation, Utrecht University, 1993.
[image:14.595.67.267.268.446.2]most important factors influencing dry deposition and models used for generalisation, Environ. Poll., 124, 379–388, 2003. Evans, A., Zelazny, L. W., and Zipper, C. E.: Solution parameters
influencing dissolved organic carbon in 3 forest soils, Soil Sci. Soc. Am. J., 52, 1789–1792, 1988.
Fang, Y. T., Zhu, W. X., Gundersen, P., Mo, J. M., Zhou, G. Y., and Yoh, M.: Large loss of dissolved organic nitrogen from nitrogen-saturated forests in subtropical China, Ecosystems, 12, 33–45, 2009.
Fang, Y. T., Gundersen, P., Mo, J. M., and Zhu, W. X.: Input and output of dissolved organic and inorganic nitrogen in subtropical forests of South China under high air pollution, Biogeosciences, 5, 339–352, 2008, http://www.biogeosciences.net/5/339/2008/. Galloway, J. N., Schlesinger, W. H., Levy, H., Michaels A., and
Schnoor J. L.: Nitrogen fixation: anthropogenic enhancement – environmental response, Global Biogeochem. Cy., 9, 235–252, 1995.
Gash, J. H. C., Lloyd, C. R., and Lachaud, G.: Estimating sparse forest rainfall interception with an analytical model, J. Hydrol., 170, 79–86, 1995.
Hyv¨onen, R., Persson, T., Andersson, S., Olsson, B., Agren, G. I., and Linder, S.: Impact of long-term nitrogen addition on carbon stocks in trees and soils in northern Europe, Biogeochemistry, 89, 121–137, 2008.
Jackson, M. L., Lim, C. H., and Zelazny, L. W.: Oxides, hydrox-ides, and aluminosilicates, in: Methods of Soil Analysis, Part I: Physical and mineralogical methods, edited by: Klute, A., 2nd ed., ASA & SSSA, Madison WI, USA, 101–150, 1986. Jansen, J. J., Sevenster, J., and Faber, P. J.: Opbrengsttabellen voor
belangrijke boomsoorten in Nederland, IBN rapport, no. 221, 240 pp., 1996 (in Dutch).
Jardine, P. M., Mayes, M. A., Mulholland, P. J., Hanson, P. J., Tarver, J. R., Luxmoore, R. J., McCarthy, J. F., and Wilson, G. V.: Vadose zone flow and transport of dissolved organic carbon at multiple scales in humid regions, Vadose Zone J., 5, 140–152, 2006.
Kaiser, K., Guggenberger, G., and Zech, W.: Sorption of DOM and DOM fractions to forest soils, Geoderma, 74, 281–303, 1996. Kaiser, K., Guggenberger, G., and Zech, W.: Organically bound
nu-trients in dissolved organic matter fractions in seepage and pore water of weakly developed forest soils, Acta Hydroc. Hydrob., 28, 411–419, 2001.
Kalbitz, K., Solinger, S., Park, J.-H., Michalzik, B., and Matzner, E.: Controls on the dynamics of dissolved organic matter in soils: a review, Soil Sci., 165, 277–304, 2000.
Koroleff, F.: Simultaneous oxidation of nitrogen and phosphorus compounds by persulfate, in: Methods of seawater analysis, edited by: Grasshoff, K., Eberhardt, M., and Kremling, K., 2nd edn. Verlag Chemie, Weinheim, 1983.
Lajtha, K., Crow, S. E., Yano, Y., Kaushal, S. S., Sulzman, E., Sollins, P., and Spears, J. D. H.: Detrital controls on soil solu-tion N and dissolved organic matter in soils: a field experiment, Biogeochemistry, 76, 261–281, 2005.
Magill, A. H., Aber, J. D., Berntson, G. M., McDowell, W. H., Nadelhoffer, K. J., Melillo, J. M., and Steudler, P.: Long-term ni-trogen additions and nini-trogen saturation in two temperate forests, Ecosystems, 3, 238–253, 2000.
Marchand, P. and Houle, G.: Spatial patterns of plant species rich-ness along a forest edge: What are their determinants?, Forest
Ecol. Manag., 223, 113–124, 2006.
McDowell, W. H., Currie, W. S., Aber, J. D., and Yano, Y.: Effects of chronic nitrogen amendments on production of dissolved or-ganic carbon and nitrogen in forest soils, Water Air Soil Pollut., 105, 175–182, 1998.
McDowell, W. H., Magill, A. H., Aitkenhead-Peterson, J. A., Aber, J. D., Merriam, J. L., and Kaushal, S. S.: Effects of chronic trogen amendment on dissolved organic matter and inorganic ni-trogen in soil solution, Forest Ecol. Manag., 196, 29–41, 2004. Michalzik, B. and Matzner, E.: Dynamics of dissolved organic
ni-trogen and carbon in a Central European Norway spruce ecosys-tem, Eur. J. Soil. Sci., 50, 579–590, 1999.
Michalzik, B., Kalbitz, K., Park, J.-H., Solinger, S., and Matzner, E.: Fluxes and concentrations of dissolved organic carbon and nitrogen – a synthesis for temperate forests, Biogeochemistry, 52, 173–205, 2001.
MIRA: Milieu- en natuurrapport Vlaanderen, Achtergronddocu-ment 2006 Vermesting, edited by: Overloop, S., Bossuyt, M., Ducheyne, S., et al., Vlaamse Milieumaatschappij, online avail-able at: www.milieurapport.be, 2006.
Neff, J. C., Holland, E. A., Dentener, F. J., McDowell, W. H., and Russell, K. M.: The origin, composition and rates of organic ni-trogen deposition: A missing piece of the nini-trogen cycle?, Bio-geochemistry, 57/58, 99–136, 2002.
Neirynck, J., Van Ranst, E., Roskams, P., and Lust, N.: Impact of decreasing throughfall depositions on soil solution chemistry at coniferous monitoring sites in northern Belgium, Forest Ecol. Manag., 160, 127–142, 2002.
Park, J. H., Kalbitz, K., and Matzner, E.: Resource control on the production of dissolved organic carbon and nitrogen in a decidu-ous forest floor, Soil Biol. Biochem., 34, 813–822, 2002. Park, J. H. and Matzner, E.: Detrital control on the release of
dis-solved organic nitrogen (DON) and disdis-solved inorganic nitrogen (DIN) form the forest floor under chronic N deposition, Environ. Pollut., 143, 178–185, 2006.
Perakis, S. S. and Hedin, L. O.: Nitrogen loss from unpol-luted South American forests mainly via dissolved organic com-pounds, Nature, 415, 416–419, 2002.
Prechtel, A., Alewell, C., Michalzik, B., and Matzner, E.: Different effect of drying on the fluxes of dissolved organic carbon and nitrogen from a Norway spruce forest floor, J. Plant Nutr. Soil Sci., 163, 517–521, 2000.
Pregitzer, K. S., Zak, D. R., Burton, A. J., Ashby, J. A., and MacDonald, N. W.: Chronic nitrate additions dramatically in-crease the export of carbon and nitrogen from northern hardwood ecosystems, Biogeochemistry, 68, 179–197, 2004.
Qualls, R. G. and Haines, B. L.: Geochemistry of dissolved organic nutrients in water percolationg through a forest ecosystem, Soil Sci. Soc. Am. J., 55, 1112–1123, 1991.
Qualls, R. G. and Haines, B. L.: Biodegradability of dissolved or-ganic matter in forest throughfall, soil solution and stream water, Soil Sci. Soc. Am. J., 56, 578–586, 1992.
Qualls, R. G., Haines, B. L., Swank, W. T., and Tyler, S. W.: Re-tention of soluble organic nutrients by a forested ecosystem, Bio-geochemistry, 61, 135–171, 2002.
Rothe, A., Huber, C., Kreutzer, K., and Weis, W.: Deposition and soil leaching in stands of Norway spruce and European Beech: Results from the H¨oglwald research in comparison with other European case studies, Plant Soil, 240, 33–45, 2002.
Schwesig, D., Kalbitz, K., and Matzner, E.: Mineralization of dis-solved organic carbon in mineral soil solution of two forest soils, J. Plant Nutr. Soil Sci., 166, 585–593, 2003.
Siemens, J., Haas, M., and Kaupenjohann, M.: Dissolved organic matter induced denitrification in subsoils and aquifers?, Geo-derma, 113, 253–271, 2003.
Sj¨oberg, G., Bergkvist, B., Berggren, D., and Nilsson, S. I.: Long-term N addition effects on the C mineralization and DOC pro-duction in mor humus under spruce, Soil Biol. Biochem., 35, 1305–1315, 2003.
Smith, W.: Air pollution and forests: interactions between air con-taminants and forest ecosystems, New York, Springer Verlag, 397 pp., 1981.
Solinger, S., Kalbitz, K., and Matzner, E.: Controls on the dynamics of dissolved organic carbon and nitrogen in a Central European deciduous forest, Biogeochemistry, 55, 327–349, 2001. Tiktak, A. and Bouten, W.: Soil water dynamics and long-term
wa-ter balances of a Douglas fir stand in The Netherlands, J. Hydrol., 156, 265–283, 1994.
Vance, G. F. and David, M. B.: Dissolved organic carbon and sulfate sorption by spodosol mineral horizons, Soil Sci., 154, 136–144, 1992.
Van Dam, J. C.: Field-scale water flow and solute transport. SWAP model concepts, parameter estimation, and case studies, Disser-tation, Wageningen University, 2000.
Van Dam, J. C., Huygen, J., Wesseling, J. G., et al: Simulation of water flow, solute transport and plant growth in the soil-water-atmosphere-plant environment, Theory of SWAP version 2.0. SC-DLO, Technical Document 45, Wageningen, The Nether-lands, 1997.
Vandenbruwane, J., De Neve, S., Qualls, R. G., Salomez, J., and Hofman, G.: Optimization of dissolved organic nitrogen (DON) measurements in aqueous samples with high inorganic nitrogen concentrations, Sci. Total Environ., 386, 103–113, 2007a. Vandenbruwane, J., De Neve, S., Qualls, R. G., Sleutel, S., and
Hof-man, G.: Comparison of different isotherm models for dissolved organic carbon (DOC) and nitrogen (DON) sorption to mineral soil, Geoderma, 139, 144–153, 2007b.
Vandenbruwane, J.: Dynamics of dissolved organic matter in for-est ecosystems in Flanders, PhD dissertation, Ghent University, 2008.
van Genuchten, M. T.: A closed-form equation for predicting the hydraulic conductivity of unsaturated soils, Soil Sci. Soc. Am. J., 44, 892–898, 1980.