Annales
Geophysicae
Evolutions of various solar indices around sunspot maximum and
sunspot minimum years
R. P. Kane
Instituto Nacional de Pesquisas Espacias, C. P. 515 S˜ao Jos´e dos Campos, 12201-970, SP, Brazil Received: 2 October 2001 – Revised: 5 February 2002 – Accepted: 12 February 2002
Abstract. The smoothed monthly sunspot numbers showed that in many solar cycles, (a) during years around sunspot maxima, there was only one prominent maximum, but in some cycles there was a broad plateau. If the beginning and end of these are termed as first and second maxima (sepa-rated by several months), the first maximum was generally the higher one, and the valley in between was very shallow. Solar indices at or near the photosphere generally showed similar structures with maxima matching with sunspot max-ima within a month or two. Indices originating in the chro-mosphere and above showed two peaks in roughly the same months as sunspots (with some exceptions, notably the Coro-nal green line, and the Total Solar Irradiance). Yet often, the second maximum was larger than the first maximum, and the valley between the two maxima was deeper, as compared to sunspot maxima, and (b) during years around sunspot min-ima, the smoothed sunspot minimum could be sharp and dis-tinct, lasting for a month or two, or could spread over several months. Among the indices originating at or near the photo-sphere, the Ca K line intensity showed good matching with sunspots, but the Ca Plage area, the Sunspot Group Area, and the solar magnetic fields seemed to show minima ear-lier than the sunspots, indicating that these activities died out first. These also showed recoveries from the minima later than sunspots. Most of the other indices originating in the chromosphere and corona attained minima coincident with sunspot minima, but in some cases, minima earlier than sunspots were seen, while in some other cases minima oc-curred after the sunspot minima. Thus, the energy dissipation in the upper part of the solar atmosphere sometimes lagged or led the evolution of sunspots near sunspot minimum. In a few cases, after the minimum, the indices recovered faster than the sunspots. In general, the chromospheric indices seemed to evolve similar to sunspots, but the evolution of coronal indices was not always similar to sunspots, and may differ considerably between themselves.
Key words. Solar physics, astrophysics and astronomy
Correspondence to: R. P. Kane ([email protected])
(Corona and transition region; Magnetic fields; Photosphere and chromosphere)
1 Introduction
For the last hundred years or more, the primary index of so-lar activity has been the Wolf (Z¨urich) sunspot numberRz, available since 1700 and published by Wolf in the various is-sues of Astron. Mitt. (1858–1893) (also in Waldmeir, 1961; McKinnon, 1987) (presently generated by the Solar Index Data Center, Brussels). It has a prominent 11-year cycle, named after Schwabe (1843, 1844), who discovered it with less than 11 years of data. The cycles are numbered since 1750 (cycle 1 = 1755 minimum to 1766 minimum). In re-cent years, many other solar indices were established (no-tably the 2800 MHz, 10.7 cm radio emission flux, denoted as F10, recorded routinely by a radio telescope near Ottawa since 14 February 1947, presently operated by the National Research Council using two fully automated radio telescopes at the Dominion Radio Astrophysical Observatory, Pentic-ton, Canada), and all these show an 11-year cycle, except that during sunspot minimum when sunspot numbers almost reach zero, most of the other indices reach a minimum non-zero level.
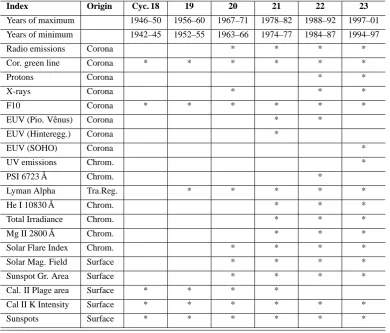
dif-Table 1. List of solar indices used in the present analysis
Index Origin Cyc. 18 19 20 21 22 23
Years of maximum 1946–50 1956–60 1967–71 1978–82 1988–92 1997–01 Years of minimum 1942–45 1952–55 1963–66 1974–77 1984–87 1994–97
Radio emissions Corona * * * *
Cor. green line Corona * * * * * *
Protons Corona * *
X-rays Corona * * *
F10 Corona * * * * * *
EUV (Pio. Vˆenus) Corona * *
EUV (Hinteregg.) Corona *
EUV (SOHO) Corona *
UV emissions Chrom. *
PSI 6723 ˚A Chrom. *
Lyman Alpha Tra.Reg. * * * * *
He I 10830 ˚A Chrom. * * *
Total Irradiance Chrom. * * *
Mg II 2800 ˚A Chrom. * * *
Solar Flare Index Chrom. * * * *
Solar Mag. Field Surface * * * *
Sunspot Gr. Area Surface * * * *
Cal. II Plage area Surface * * * *
Cal II K Intensity Surface * * * * * *
Sunspots Surface * * * * * *
fer considerably from one index to another. Donnelly et al. (1985) showed that the solar UV full-disk flux at 2050 ˚A measured by NIMBUS 7 satellite varied in close agreement with ground-based measurements of the He I absorption line at 10 830 ˚A for:
(i) short-term (13.5 or 27.5 days),
(ii) intermediate-term (several months), and
(iii) long-term solar cycle variations, but the UV variations differed from those of the 10.7 cm solar radio flux F10. The next major attempt to make a comparative study of the variations of different solar indices was by Donnelly et al. (1986), using the AE-E data of 15 wavelength groups (170–1220 ˚A, Hinteregger et al., 1981), the He I line 10 830 ˚A, the F10 flux, and sunspots. Donnelly et al. (1986) showed that the ratio of the amplitudes of the long-term variations to short-term variations was highest (about 2 to 3) for EUV (170–660 ˚A), about 2 for chromospheric UV, EUV and 10 830 ˚A He I, and less than 1.5 for F10, Rz and Ca-K Plage index. Several details about the 13-day and 27-day variations were presented by them. In her re-view, Lean (1987) examined all data, namely AE-E data from Hinteregger et al. (1981), the LASP rocket data from
Rottman (1981), Mount et al. (1980) and Mount and Rottman (1981), the SBUV data from Heath and Schlesinger (1984) and the LASP SME data from Rottman and London (1984) and Rottman (1985), and plotted the observational estimates of the ratio of the maximum to minimum UV irradiance dur-ing solar cycle 21. The plots showed a ratio exceeddur-ing 2.5 for wavelengths 0–500 ˚A, falling thereafter steadily to∼1.2 for 1700 ˚A, and below 1.05 for wavelengths exceeding 2100 ˚A. Recently, Kane et al. (2001) subjected the time series of sev-eral radio emissions (Crakow Observatory, 275–1755 MHz) to spectral analysis and showed that the coronal region where these radiations originate rotates as a block (same angular ve-locity) on a 27-day time scale.
[image:2.595.104.495.86.419.2]21, the smoothed monthly sunspot number reached a maxi-mum value of∼165 in December 1979 and dropped there-after to∼140 by the end of 1980. The smoothed F10 had a maximum value of 200.8 in January 1980 (two months after sunspots), dropped to 195.9 in July 1980, but rose thereafter and reached a maximum value of 204.9 in April 1981, 16 months after the sunspot maximum. According to Rybansky et al. (1998), the green Corona Index also showed similar dis-crepancies and in cycle 21, reached a maximum at the end of 1981. Harvey (1992), Ivanov et al. (1998), Atac¸ and Ozguc¸ (1998) have pointed out similar dissimilarities.
In the present communication, the behaviours of various indices near sunspot maxima and minima are compared for cycles 18–23.
2 Data
In cycle 18, data for very few indices were available. There-after, the number has increased considerably from one cycle to the next. Table 1 lists the indices considered for cycles 18–23, in the order of their approximate altitude of origin in the solar atmosphere, starting from solar radio emissions in solar corona and ending with sunspots at the photosphere.
The short-term variations of solar indices have been stud-ied in detail elsewhere, e.g. in Donnelly et al. (1985, 1986). Here, the emphasis will be on what Donnelly et al. (1985) termed as intermediate-term time scale. Hence, only monthly means are used and further, 12-month moving averages are calculated and used. Most of these data were available in the NOAA website ftp://ftp.ngdc.noaa.gov/STP/SOLAR DATA/, (henceforth referred as NGDC) but some were from other websites mentioned by Helen Coffey and/or by the re-spective authors, and some were obtained privately. Many are in the NOAA Publication Solar Geophysical Data (SGD) Comprehensive Reports.
[image:3.595.314.541.61.614.2]3 Plots of sunspot numbers for cycles 0–23
Figure 1 shows a plot of the smoothed sunspot numberRz for all the cycles 0–22 (cycle 23 partially). Two categories are seen:
(a) cycles with one prominent maximum: cycles 0, 1, 2, 3, 4; 7, 8, 9, 10, 11, 12, 13; 15; 18, 19;
(b) cycles having a broad plateau (the beginning and the end could be considered as two maxima): cycles 5, 6; 14; 16, 17; 20, 21, 22. In this category, the first maximum is generally larger than the second maximum, and the valley in between is very shallow.
Fig. 1. Plot of smoothed monthly sunspot numbers for cycles 0–23.
The full dots indicate maxima.
4 Years around sunspot maxima
4.1 Plots for cycles 18–23
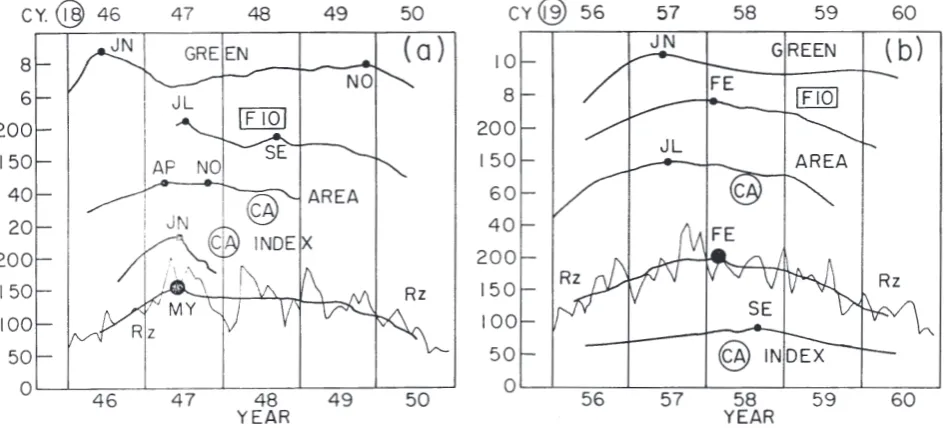
Fig. 2. Plots of various solar indices in years near sunspot maxima of (a) cycle 18, 1946–1950, and (b) cycle 19, 1956–1960. The full dots
indicate maxima.
(i) the sunspots, NGDC,
(ii) Mt. Wilson Observatory Calcium Plage Area, Foukal (1996), NGDC,
(iii) the Calcium K line intensity, McMath, Sacremento Peak, Big Bear Observatories, Swartz and Overbeck (1971), NGDC,
(iv) the 10.7 cm (2800 MHz) flux denoted as F10, NGDC, and
(v) the Coronal green line (Fe XIV, 5303 ˚A) index (Ryban-sky et al., 1998; Ramesh, 1998), NGDC.
In cycle 18, the smoothed sunspotsRzhad a maximum in May 1947. The Ca Plage area had a broad maximum around the same period, but the Ca index had a sharp maximum in June 1947. The F10 had a main maximum in July 1947 and a subsidiary maximum in September 1948. (The maxima are indicated by full dots and months of the various maxima are indicated by two letters as JA, FE, MA, AP, MY, JN, JL, AU, SE, OC, NO, DE). The Coronal green line index (smoothed values) had a prominent maximum in June 1946, almost a year before the sunspot maximum. In addition, the green line had a secondary maximum much later, in November 1949. Thus, in cycle 18, the Coronal green line index had a de-velopment very different from the other indices. In cycle 19 (Fig. 2b), the sunspot maximum occurred in February 1958, the F10 maximum coincided with the same, the Ca Plage area and Coronal green line maxima occurred 6–8 months earlier, and the Ca K line intensity index maximum occurred ∼7 months later, but all indices had only one prominent max-imum. Interestingly, the Ca intensity index had a very differ-ent behaviour in these two cycles. In both, the sunspots had a broad peak, but the Ca index peak was sharp in cycle 18 and
broad in cycle 19. Thus, parallelism between the Ca intensity index and the sunspots is not invariably there. In contrast, the Ca Plage area was broad in both the cycles.
Figure 3 shows a plot of the smoothed values of sunspot numberRzand the Ca Plage area for the previous 3 cycles 15, 16, 17. As can be seen, with slight differences, the two indices run parallel.
Figure 4 shows the plots for cycle 20. Here, additional indices are:
(i) solar magnetic field represented by the Magnetic Plage Strength Index (MPSI) derived from spatially resolved magnetogram observations at the 150-foot solar tower at Mt. Wilson Observatory (MWO) (Parker et al., 1998), full line, website http://www.astro.ucla.edu/∼obs/intro. html,
(ii) monthly counts of grouped solar flares (SGD),
(iii) hard and soft X-rays (SOLORAD, GOES satellites), NGDC, and
(iv) radio emissions at 609, 1415, 2695, 4995, 8800, 15 400 MHz (SGMR, Sagamore Hill; PALE, Palehua, Hawaii; LEAR, Learmonth, Australia; SVTO, San Vito, Italy), NGDC.
Fig. 3. Plots of smoothed sunspot numberRzand the Ca Plage Area, for cycles 15, 16, 17. The full dots indicate maxima.
index (May 1967), almost the same as that of the Ca intensity index (March 1968), but much earlier than the sunspot max-imum (October 1968). The second maxmax-imum was in May 1970 and almost coincided with the small second maximum of sunspots (June 1970). Thus, for cycle 20, the Ca Plage area had a behaviour very different from those of earlier cy-cles. The solar magnetic field index MPSI started late, in the middle of 1970 and only one maximum could be seen, in July 1970. The grouped solar flare count had two max-ima, in August 1967 (several months before the first sunspot maximum of October 1968), and in July 1970 (almost co-incident with the second sunspot maximum in June 1970). The soft (1–8 ˚A) and hard (8–20 ˚A) SOLORAD X-ray data showed a maximum in June 1970. The F10 had two max-ima, in January 1968 and July 1970. The Coronal green line had two maxima, in June 1968 and June 1970, but only the second maximum coincided with the second maximum of sunspots (June 1970), while the first maximum occurred
sev-Fig. 4. Plots of smoothed values of the various solar indices in
years near sunspot maximum of cycle 20, 1967–1971. The full dots indicate maxima.
[image:5.595.51.281.65.459.2]mi-nor maximum, some indices seem to show a prominent imum at or near the second rather than the first sunspot max-imum.
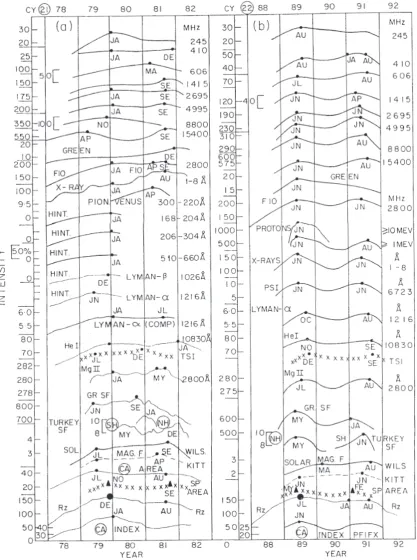
Figure 5 shows the plots for (A) cycle 21 and (B) cy-cle 22. In cycy-cle 21 (Fig. 5a), there are many additional in-dices. In particular, a whole set of 15 UV and EUV emis-sions were available (Hinteregger et al., 1981; Donnelly et al., 1986, NGDC). Some of these had wavelengths very near each other. The percentage deviations of these were plot-ted and those showing similar variations were combined to-gether. Finally, the wavelengths or ranges chosen were: Lyman Alpha (1216 ˚A), Lyman Beta (1026 ˚A), 510–660 ˚A, 206– 304 ˚A, and 168–204 ˚A. Besides these, there were the composite values of:
(i) Mg II (2800 ˚A, Deland and Cebula, 1993), NGDC, (ii) Total Solar Irradiance (Frohlich and Lean, 1998), data
from PMOD/WRC and VIRGO team, NGDC,
(iii) He I absorption line (10 830 ˚A, website ftp://argo.tuc. noao.edu/kpvt/daily/stats/he.dat), and
(iv) Pioneer Venus Orbiter integrated EUV flux (300– 1220 ˚A, Brace et al., 1988; Mahajan et al., 1998, NGDC, updated data sent privately by K. K. Mahajan). Lyman Alpha data were also available as a modelled series since 1947 through 1999 (Woods et al., 2000), but their es-timations are partly based on other indices (Mg II, etc.). In the radio emissions, additional data were available for 245 and 410 MHz., NGDC. In cycle 22 (Fig. 5b), additional data were available for
(i) Solar protons (GOES, NGDC), (ii) X-rays (GOES, NGDC), and
(iii) The Photometric Sunspot Index (PSI, line 6723 ˚A, Chapman et al., 1994, NGDC).
For cycle 21 (Fig. 5a), the sunspots had a major maximum in December 1979 and a minor maximum in August 1981. The Ca index showed only one peak in January 1980. The Ca Plage area had two peaks, one in July 1979 (earlier than the December 1979 peak of sunspots) and another in Septem-ber 1981, very near the August 1981 peak of sunspots. The Sunspot Group Area maxima (full triangles) were in Novem-ber 1979 and SeptemNovem-ber 1981, very near the sunspot max-ima. For the solar magnetic field, besides the Mt. Wil-son observations (full line), Kitt Peak line of sight mag-netic field strength data (dashed line) were available, (web-site ftp://argo.tuc.noaa.edu/kpvt/daily/stats/mag.dat). Both these showed a peak in July 1979, similar to the Ca Plage area (earlier than the sunspot peak), but the second peak for Mt. Wilson was in September 1981, while that of Kitt Peak was in April 1981. (K. Harvey sent us another set of Kitt Peak magnetic data integrated over the Sun by Carrington rotations. The 13-value moving averages of the Harvey data set gave the same maxima, within a month, as the other Kitt
Peak set). This difference may be insignificant but could also reflect different responses of the two magnetic indices (Mt. Wilson and Kitt Peak) to solar energy convection. The grouped solar flare index had two peaks a few months ear-lier than the sunspot peaks. For solar flare index, additional data were available from the Kandilli Observatory, Istanbul, Turkey (Atac¸ and Ozguc, 1998), NGDC), separately for the Northern (NH) and Southern (SH) Hemispheres of the Sun. The data were available only from 1980 onwards, but the two hemispheres show very different results, with the NH having just one peak in January 1981, and SH having two peaks, in May 1980 and December 1982, none of these tallying with any of the sunspot peaks. The Mg II index and He 10 830 had two peaks, the first one coinciding with the first peak of sunspot and the second peak a few months away from the second peak of sunspot. The Total Solar Irradiance (crosses) showed a small peak in July 1979, and a major peak in De-cember 1980, both of these were several months earlier than the sunspot peaks. The modeled Lyman Alpha had a minor peak in January 1980 and a major peak in July 1981, both matching with sunspot peaks. The Hinteregger data were up to the middle of 1980 only. Hence, the moving averages of Lyman Beta and the EUV revealed only one peak in De-cember 1979–January 1980, matching well with the sunspot peak. However, the Lyman Alpha of Hinteregger showed a peak in June 1979, several months earlier than the sunspot peak. The Pioneer-Venus EUV showed just one peak, which was a few months earlier than the second sunspot peak. The F10 had two peaks matching well with sunspots. The Coro-nal green line had only one major peak a few months later than the second sunspot peak. Most of the radio emissions had two peaks matching well with the sunspot peaks, but 15 400 MHz had a peak in April 1979, several months earlier than the sunspot peak. By and large, many indices showed two peaks matching reasonably well with the sunspot peaks. But, whereas the second peak was minor for sunspots, it was a major peak for some indices. Also, some indices showed first peaks earlier than the first sunspot peak (15 400 MHz, Total Solar Irradiance, Solar magnetic field, Ca Plage area), while some indices showed second peaks earlier than the sec-ond sunspot peak (Total Solar irradiance, Grouped solar flare count).
Fig. 5. Plots of smoothed values of the various solar indices in years near sunspot maxima of (a) cycle 21, 1978–1982, and (b) cycle 22,
1988–1992. The full dots indicate maxima.
in June 1989 and another in June 1991, both matching well with sunspots. Again, there seems to be some difference in the responses of the two magnetic field indices (Mt.Wilson and Kitt Peak). The grouped solar flares had peaks matching
peak in June 1991 (almost the same as the sunspot peak near August 1991). The difference in the indices of NH and SH could be a major factor in the evolution of sunspot activity near the solar maximum. By and large, the matching be-tween the various indices and sunspots was better in cycle 22, than in earlier cycles.
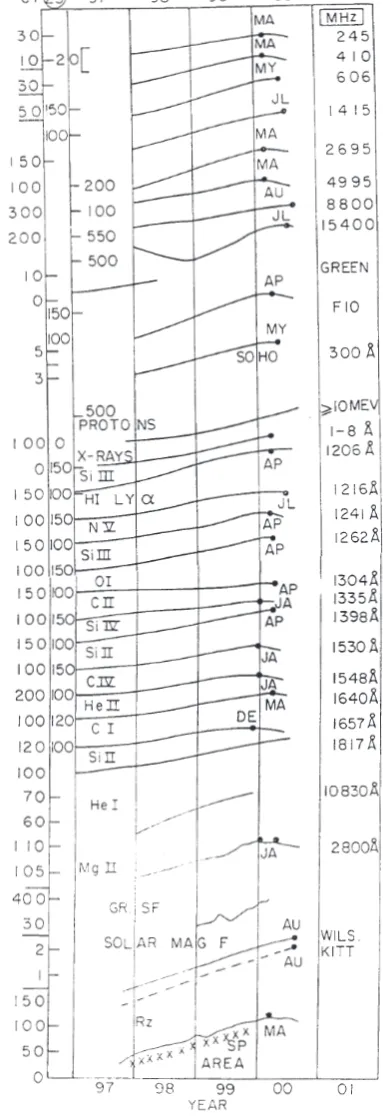
Figure 6 shows the plots for cycle 23. These are incom-plete as data for many indices were not yet available. (SOHO data,∼300 ˚A were on the website http://www.usc.edu/dept/ space science/semdata.htm, courtesy of D. McMullin). On the other hand, a whole set of SOLSTICE chromospheric line data were available (courtesy of T. Woods of LASP, Boulder, Colorado). The sunspots (smoothed values) showed a maxi-mum in March 2000, and many other indices for which data were available up to 2001 also showed a maximum there-about or slightly later. How would the cycle 23 evolve in the future is anybody’s guess. Like cycles 3, 11, 18 (see Fig. 1), a decline may follow. Or, like some other cycles, the present level may be maintained approximately for the next 2–3 years (a plateau), and a decline may follow thereafter. In that case, a second (minor?) sunspot maximum may occur and some of the other indices may show similar features (two maxima) but in different relative proportions.
4.2 Long-term variation of the maxima of some solar in-dices
Rybansky et al. (1998) mention that the Coronal green line index in the maxima of different solar cycles shows a mono-tonic increase since 1939. There are very few indices for which continuous data are available for many cycles. Fig-ure 7 shows some plots of the maxima of smoothed values. The sunspots increased from cycle 15 to cycle 19 and have a decreasing tendency thereafter. The Calcium Plage Area (also the Sunspot Group Area) and the 2800 MHz F10 show similar tendencies. The Ca K line intensity index seems to have a downward tendency since cycle 18, and the Coronal green line index rose monotonically since cycle 18.
The Coronal green line index patterns often seem to devi-ate considerably from the sunspot number patterns (Figs. 2 and 7). The reason for this peculiar behaviour needs fur-ther exploration. Ramesh (1998) made correlative studies of the Coronal green line index with sunspots and reported good correlation on a yearly average basis, which we did not observe invariably. Rybansky et al. (1998) did not find any significant correlation between the Coronal green line index and solar soft X-rays and attributed this to the difference in the size of the coronal regions in which these indices origi-nate (small-scale regions for X-rays, larger regions for green line emission). Incidentally, the Total Solar Irradiance also seems to show considerable dissimilarities with sunspots, as shown here and also in Atac¸ and Ozguc (1998).
[image:8.595.330.522.67.627.2]4.3 Conclusions about years around sunspot maxima From the analysis presented so far, the following conclusions can be drawn:
Fig. 6. Plots of smoothed values of the various solar indices in years
near sunspot maximum of the present cycle 23, 1997 onwards. The full dots indicate maxima.
Fig. 7. Plots of smoothed values of Coronal green line index, F10, Cal-cium K line intensity index, CalCal-cium Plage Area and Sunspot Group Area, and sunspot number, at sunspot maxima of cycles 15–23.
Fig. 8. Plots of the 12-month moving
averages of sunspot numberRzduring years of minima of sunspot cycles 1–17. In the plots for cycles 16 and 17, the dashed line represents 12-month mov-ing averages of the Calcium Plage Area.
(2) In many (11-year) cycles, there is only one prominent sunspot maximum, but in some cycles, there is a broad plateau. If the ends are termed as first and second max-ima, the first maximum is invariably larger. The valley between the two maxima is very shallow. Indices origi-nating at or near the photosphere show similar patterns.
(3) When there are two maxima in sunspots, most of the other indices also show two maxima within a month or two of the sunspot maxima. However, in contrast to sunspots where the second maximum is equal or smaller, the second maximum in the other solar indices is sometimes bigger than the first maximum.
Also, the valley between the two maxima, almost non-existant for sunspots, is significantly deep for the other in-dices, particularly for indices originating in and above the chromosphere (corona). Occasionally, some indices show maxima several months before or after the sunspot maxima, and these can be near the photosphere, as well as in and above the chromosphere (Coronal green line index, Total Solar Ir-radiance, Ca Plage area).
5 Years around sunspot minima
5.1 Plots for cycles 1–17
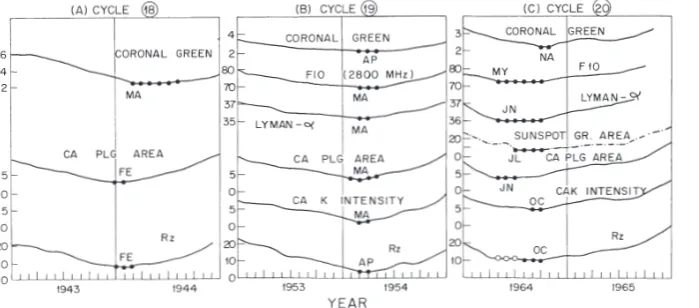
Fig. 9. Plots of the 12-month mov-ing averages of various indices durmov-ing years of sunspot minima of (A) cycle 18, 1943–1944, (B) cycle 19, 1953– 1954, (C) cycle 20, 1964–1965.
5.2 Plots for cycles 18–23
Figure 9 shows plots of the 12-month moving averages of various indices near the sunspot minima for (A) cycle 18, (B) cycle 19, (C) cycle 20. The indices for which data were available are:
(i) the sunspots, NGDC,
(ii) the Calcium K line intensity, McMath, Sacremento Peak, Big Bear Observatories, Swartz and Overbeck (1971), NGDC,
(iii) Mt. Wilson Observatory Calcium Plage Area, Foukal (1996), NGDC, and Rome Astronomical Observatory Sunspot group area, NGDC,
(iv) Lyman-α modelled values (Woods et al. (2000), ftp:// laspftp.colorado.edu/pub/solstice/composite lya.dat), (v) the 10.7 cm (2800 MHz) flux denoted as F10, NGDC,
and
(vi) the Coronal green line (Fe XIV, 5303 ˚A) index (Ryban-sky et al., 1998; Ramesh, 1998), NGDC.
In cycle 18 (Fig. 9a), besides sunspot numberRz, data for only the Ca Plage area and Coronal green line intensity in-dex were available. The sunspot had a fairly sharp minimum around February 1944. (Values within 5% of the minimum are also marked as minima, by full dots.) The evolution of the Plage area seems to coincide very well with that of the sunspots, in both aspects, namely the month of occurrence and the shape before and after the minimum, (similar to cy-cle 17 but unlike cycy-cle 16, see Fig. 8). The Coronal green line index has a minimum at about the same month (March 1944), but the evolution after the minimum is different. WhereasRz and the Plage area recover after March 1944, the Coronal line remains near the minimum for the next 6 months. This type of difference is seen later in many other cases.
In cycle 19 (Fig. 9B), theRzminimum was fairly sharp, in March–April 1954. All indices, including the additional
ones, Ca K line intensity, Lyman-αand F10, show a mini-mum at about the same month, and the shapes of the evo-lutions are also alike. In cycle 20 (Fig. 2C), the Rzhad a diffuse minimum during August–October 1964. The Ca K intensity index and Coronal green line index matched with sunspots. The Plage area had a minimum somewhat earlier (May 1964), but the Sunspot Group Area had minima co-inciding with sunspots. The Lyman-αand F10 had minima earlier thanRz. TheRzvalues for May–July 1964 were also low, though about 7% higher than the minimum. Thus, it may be concluded that Rz, Plage area, Lyman-α and F10 reached almost minimum from May 1964 onwards up to Oc-tober 1964. In that case, the Ca K line intensity and Coronal green line index would be considered as having a minimum with a delay of few months.
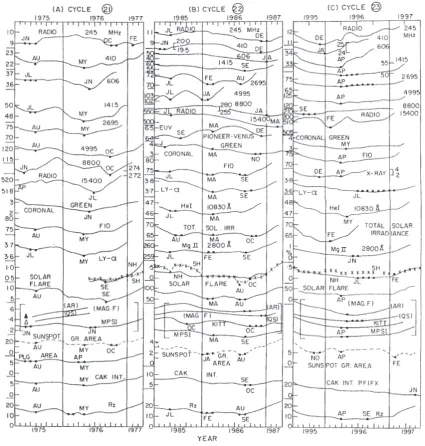
Figure 10 shows the plots for (A) cycle 21, (B) cycle 22, (C) cycle 23. The additional indices available were:
(i) Solar magnetic field represented by the Magnetic Plage Strength Index (MPSI) derived from spatially resolved magnetogram observations at the 150-foot solar tower at Mt. Wilson Observatory (MWO) (Parker et al., 1998), full line, website http://www.astro.ucla.edu/∼obs/intro. html, and Kitt Peak line of sight magnetic field strength data (dashed line), website ftp://argo.tuc.noaa.edu/kpvt/ daily/stats/mag.dat.
(ii) Monthly counts of grouped solar flares (SGD), and the solar flare index data from the Kandilli Observatory, Is-tanbul, Turkey (Atac¸ and Ozguc¸, 1998, NGDC), sepa-rately for the Northern (NH) and Southern (SH) Hemi-spheres of the Sun.
(iii) Mg II (2800 ˚A, Deland and Cebula, 1993), NGDC, (iv) Total Solar Irradiance (Frohlich and Lean, 1998), data
from PMOD/WRC and VIRGO team, NGDC,
(v) He I absorption line (10 830 ˚A, website ftp://argo.tuc. noao.edu/kpvt/daily/stats/he.dat).
Fig. 10. Plots of the 12-month moving averages of various indices during years of sunspot minima of (A) cycle 21, 1975–1977, (B) cycle 22,
1985–1987, (C) cycle 23, 1995–1997.
(vii) Pioneer Venus Orbiter integrated EUV flux (300– 1220 ˚A, Brace et al., 1988; Mahajan et al., 1998, NGDC, updated data sent privately by K. K. Mahajan), and
(viii) Radio emissions at 609, 1415, 2695, 4995, 8800, 15 400 MHz (SGMR, Sagamore Hill; PALE, Palehua, Hawaii; LEAR, Learmonth, Australia; SVTO, San Vito, Italy), NGDC.
Cycle 21
In cycle 21 (Fig. 10A), the sunspot numbers had a minor minimum in August 1975 and a diffuse minimum during February–May 1976. The Calcium K intensity, Plage area
and Sunspot Group Area had a similar evolution, but the Sunspot group area continued to be low until the end of 1976, thoughRzhad recouped considerably by that time. For the solar magnetic field, four different estimates were available:
(i) MPSI is the Magnetic Plage Strength Index from Mt. Wilson Observatory.
(ii) Kitt Peak gives a line of sight magnetic field strength. For the same (Kitt Peak), K. Harvey kindly sent mag-netic flux values on the Sun as this flux is crossing the central meridian, separating the flux into:
In cycle 21, MPSI shows a first minimum in June–July 1975, slightly earlier than the August 1975 minimum ofRz, and a second minimum in June–July 1976, slightly later than the May 1976 minimum of Rz. Thus, the magnetic field lost strength earlier thanRzand recouped it later than Rz. However, the active region (AR) and quiet Sun (QS) values, (12-month moving averages available only from mid-1975), showed a steady rise from 1975 onwards, quite unlike the MPSI values.
The monthly count of grouped solar flares showed a mi-nor minimum in August 1975, tallying with that ofRz, and a major minimum in September 1976, later than theRz min-imum in May 1976. Thus, solar flares disappeared later than the sunspots. The Kandilli observations of solar flare index (12-month moving averages) for the NH (full line) and SH (crosses) solar hemispheres were available only from mid-1976 and both NH and SH showed a minimum in Septem-ber 1976, later than the Rzminimum. Lyman-α and F10 showed minima matching withRz, but Coronal green line in-dex showed only one minimum in June 1976, almost match-ing withRz. Thus, the Coronal green line seems to have a tendency of lagging behindRz.
A whole set of radio emission data were available in cy-cle 21. Almost all the emissions had a minor minimum in June–August 1975, slightly earlier than theRzminimum in August 1975 (except 15 400 MHz which had a minimum in April 1975), and a major minimum in May–July 1976, al-most matching withRzminimum of May 1976. Exceptions were 15 400 MHz, having a minor mimimum in April 1975, and 245, 4995, 8800 MHz, having major minima in Octo-ber 1976, later than the major minimum ofRzin May 1976. Thus, solar radio emissions seem to lag behindRz.
Cycle 22
[image:12.595.310.541.64.578.2]In cycle 22 (Fig. 10B), the sunspotsRzhad two minima, one in January–March 1986 and another in August–September 1986 (besides a small inflection earlier in July 1985). The Ca K line intensity had only one minimum, in September– October 1986, matching with sunspots. There were no Plage area data. The Sunspot Group Area had two minima match-ing with sunspots. In the solar magnetic field indices, MPSI had two minima, matching with sunspots. The Kitt Peak index showed two minima but far away from theRz min-ima, the first one earlier and the second one later. Thus, Kitt Peak field disappeared earlier and revived later thanRz. The Kitt Peak magnetic field indices AR (active region) and QS (quiet Sun) showed similar results. The solar flare in-dices, Mg II, Total Solar Irradiance, Lyman-α, F10, Coronal green line and Pioneer-Venus EUV, all show good matching with sunspots, except that the second minimum is, in some cases, in November–December 1986, rather than in August– September, forRz. The small inflection in July 1985 forRz is displayed prominently in some indices. In radio emissions, the majorRzminimum of January–March 1986 is missing in radio emissions 245, 410, 606, 1415, 8800, 15 400 MHz, and present only in 2695 and 4995 MHz. TheRzminimum
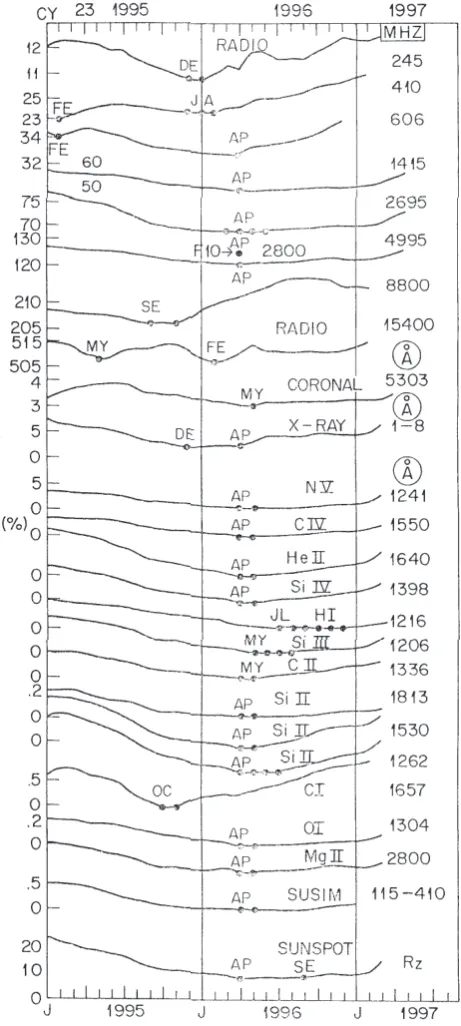
Fig. 11. Plots of the 12-month moving averages of various
chromo-spheric line indices and coronal radio emission indices during years of sunspot minimum of cycle 23, 1995–1997.
Cycle 23
In cycle 23 (Fig. 10C), sunspotsRzhad one prominent min-imum in April 1996, but the values had a flat level un-til September 1996. The April 1996 minimum was re-flected in many indices. Radio emissions 245, 410, 8800 and 15 400 MHz showed minima earlier, during or before January–February 1996. X-rays and Sunspot Group Area also showed similar earlier minima. Thus, these activities disappeared earlier than theRz. In late 1991, a whole set of data of UV spectral lines (daily values of intensities) be-came available from the UARS SOLSTICE observations of eleven lines, namely, Hydrogen I (Lyman-α), 1216 ˚A; He-lium II, 1640 ˚A; Nitrogen V, 1240 ˚A; Oxygen I, 1304 ˚A; Car-bon I, 1657 ˚A, II, 1335 ˚A, IV, 1548 ˚A; Silicon II, 1262 ˚A, II, 1530 ˚A, III, 1206 ˚A, IV, 1398 ˚A, kindly supplied to us by Dr. Thomas Woods of the University of Colorado. These lines originate in various parts of the chromosphere and the tran-sition region and, in conjunction with the radio emissions, cover the whole solar atmosphere. In Fig. 11, the evolution of all these is shown for cycle 23. For the chromospheric spectral lines, the excitation temperatures were determined by Woods et al. (2000), taking the ratio of excitation rates for two doublets of the same super-multiplet (Zirin, 1988). In Fig. 11, the lines are arranged according to a descending order of these temperatures. Thus, N V 1241 ˚A has a temper-ature of∼200 000 K, while Mg II 2800 ˚A has∼6500 K. The top plot of 245 MHz has a temperature above one million de-grees K. As can be seen, almost all indices have a minimum in or near April 1996, the same as for sunspot numberRz (bottom plot), for which there is a broad minimum during April–September. However, there are some glaring excep-tions. In the chromosphere, C I 1657 ˚A has a minimum much earlier, in October–November 1995. The same is true for X-rays and some radio emissions. Thus, some indices weaken much earlier than the sunspots.
[image:13.595.309.542.60.272.2]Regarding sunspot minima, Harvey and White (1999) made an interesting investigation for cycles 22–23. They concluded that cycle minimum is not defined solely on the basis of the occurrence of the minimum in the smoothed sunspot number, but rather by several additional parame-ters, including the monthly (or rotationally) averaged sunspot number, the number of regions (total, new- and old-cycle), and the number of spotless days, and recommended that the minimum between cycles 22 and 23 should be considered as to have occurred in September 1996 and not in May 1996. In Fig. 10C, we have considered the sunspot minimum as starting in April 1996, which seems to match with the min-ima of many other indices. (The discrepancy whether as to the sunspot minimum should be in April or May, 1996 is ap-pearing due to the consideration of centering. We have con-sidered 12-month moving averages as centered on the sixth month, e.g. January to December mean centered at June. Others may consider it as centered at July. The double-smoothed means as given in McKinnon (1987) will be cen-tered at July.) If September 1996 is considered as sunspot minimum, the minima of many indices would have occurred
Fig. 12. Plots of the minima of some solar indices for cycles 16–23.
much earlier than sunspots. The smoothed sunspot numbers had a minimum value of 7.6 in April 1996, but the values continued to be low until September 1996 for which the value was only 8.4, almost the same as for April 1996.
5.3 Long-term variation of the minima of some solar in-dices
Since data for some indices are available for several sunspot cycles, it would be interesting to see if their minima have similar evolutions on a long-term time scale. Figure 12 shows a plot of the minimum values in recent cycles. The minimum of sunspot numberRzshows a rise from cycle 19 to cycle 22 and a fall thereafter for cycle 23. Most of the other indices show a similar pattern, but the Sunspot Group Area seems to have a decline from cycle 21 to cycles 22 and 23.
5.4 Conclusions about years around sunspot minima The results about sunspot minima can be summarised as fol-lows:
(1) The smoothed sunspot minimum can be sharp and dis-tinct, lasting for a month or two, or can spread over sev-eral months.
(2) Among the indices originating at or near the photo-sphere, the Ca K line intensity shows good matching with sunspots, but the Ca Plage area, the Sunspot Group Area, and the solar magnetic fields seem to show min-ima earlier than the sunspots, indicating that these activ-ities die out first. These also show recoveries from the minima later than sunspots.
sunspot minima, but in some cases, minima earlier than sunspots are seen, while in some other cases minima oc-cur after the sunspot minima. Thus, the energy dissipa-tion in the upper part of the solar atmosphere sometimes lags or leads the evolution of sunspots near sunspot min-imum. In a few cases, after the minimum, the indices recover faster than the sunspots.
(4) In general, the chromospheric indices seem to evolve similar to sunspots, but the evolution of coronal indices is not always similar to sunspots, and may differ con-siderably between themselves.
6 General conclusions and discussion
Based on the examination of 12-month moving averages, the general conclusion of this study is that the evolutions of var-ious solar indices around years of sunspot maxima and min-ima are not always similar to that of sunspots. Lags and/or leads of several months are often seen. The observed differ-ences between the chromospheric and coronal indices have important implications for solar dynamics. Harvey (1992) reported that the solar magnetic field relationship with pho-tospheric total irradiance was different from that with chro-mospheric and coronal radiations, though the correlation be-tween magnetic field and F10 was very good. Ivanov et al. (1998) used cross-correlation for short-term (27-day) vari-ations and showed a similar result, namely that the solar global magnetic field had a relationship with photospheric radiation which was different from that with (upper) chro-mospheric and coronal radiations. Atac¸ and Ozguc¸ (1998) showed similar dissimilarities between various indices (no good agreement with Total Solar Irradiance, etc.). Particu-larly interesting were the differences in the behaviour of in-dices of the NH and SH solar hemispheres, where the so-lar fso-lare activity drifted between the two hemispheres every two years from 1988 to 1993. The N-S asymmetry is mani-fested in several features of solar activity (detailed references in Atac¸ and Ozguc¸, 1998). For example, Joshi (1995) had shown the existence of a constant and persistent N-S asym-metry of sunspot groups, H Alpha flares and active promi-nences during the maximum of cycle 22 (1989–1991) (see also Garcia, 1990). Thus, the convection of the solar energy from the solar interior to the photosphere, chromosphere and corona is not similar and is much more complicated than the traditional blocking effect (Ivanov et. al., 1998).
Since all solar indices attain a maxima near sunspot max-imum and minima near sunspot minmax-imum, the long-term correlation between all indices is very high. On a short-term scale, different indices have different time scales (sec-onds, minutes for flares, 1–27 days for sunspot evolution and movements, etc.) and different locations on the photosphere and hence, considerable differences in the evolution patterns are expected and seen, even when whole-disc measurements are considered. For intermediate time scales (moving aver-ages over several months), only the background levels should
be relevant and one would expect that these would be simi-lar for all indices. But it seems that some of the short-term effects spill over in the intermediate-term time scale. Dif-ferences in hemispheric evolutions probably play a major role, even though full-disc values are considered. Donnelly et al. (1986) and Atac¸ and Ozguc¸ (1998) have illustrated the spill-overs for averages over a few months. Dissimilarities even in 12-month moving averages are surprising.
During sunspot minima, the dissimilarity of the behaviour of the Ca Plage (or sunspot) areas on one side and the CA K line intensity and sunspots on the other indicates that the ar-eas have a partially independent evolution pattern (intense spots not necessarily bigger in size). Also, the magnetic fields die out earlier and recover later, indicating that the conditions to produce and sustain the magnetic structures are more demanding than those needed for producing sunspots. Once the energy from the interior of the Sun emerges and reaches higher altitudes, its evolution and dissipation there seems to be affected considerably by solar atmospheric dy-namics, and similarity with surface activity is diminished. The intriguing aspect is that the dissimilarity is not similar for all radio emissions, nor is there any clear-cut dependence on solar altitudes, though there is a slight indication that the upper corona may show larger dissimilarities.
Acknowledgements. Thanks are due to H. Coffey and E. Erwin
for guiding through the NOAA website and indicating websites for other data (including the NSO/Kitt Peak data used here which are produced cooperatively by NSF/NOAO, NASA/GSFC, and NOAA/SEL)., to T. Woods at the University of Colorado (Boul-der, Colorado, USA) for providing the solar UV irradiances from the UARS SOLSTICE observations and for useful discussions and suggestions, to K. K. Mahajan for supplying updated Pioneer Venus Eipe data privately, to R. K. Ulrich (MPSI data) and D. McMullin (CELIAS/SEM, SOHO data) for giving access to their websites, and to the other innumerable workers who are responsible for produc-ing the scientific data used in this analysis. This work was partially supported by FNDCT, Brazil under contract FINEP-537/CT.
Topical Editor E. Antonacci thanks I. Jocelyn and G. Godoli for their help in evaluating this paper.
References
Atac¸, T. and Ozguc¸, A.: Flare index of solar cycle 22, Solar Phys. 180, 397–407, 1998.
Brace, L. H., Hoegy, W. R., and Theis, R. F.: Solar EUV measure-ments at Venus based on photoelectron emission from the Pio-neer Venus Langmuir probe, J. Geophys. Res. 93, 7282–7296, 1988.
Chapman, G. A., Cookson, A. M., and Dobias, J. J.: Observations of changes in the bolometric contrast of sunspots, Astrophys. J., 432, 403–408, 1994.
Chapman, G. A., Cookson, A. M., and Dobias, J. J.: Variations in total solar irradiance during solar cycle 22, J. Geophys. Res. 101, 13 541–13 548, 1996.
Donnelly, R. F., Harvey, J. W., Sheath, D. F., and Repoff, T. P.: Temporal characteristics of the solar UV flux and HE I line at 1083 nm, J. Geophys. Res., 90, 6267–6273, 1985.
Donnelly, R. F., Hinteregger, H. E., and Sheath, D. F.: Temporal variations of solar EUV, UV, and 10 830 ˚A radiations, J. Geo-phys. Res., 91, 5567–5578, 1986.
Foukal, P.: The Behavior of Solar Magnetic Plages Measured from Mt. Wilson Observations between 1915–1984, Geophys. Res. Lett., 23, 2169–2172, 1996.
Frohlich, C. and Lean, J.: The Sun’s total irradiance: Cycles, trends and related climate change uncertainties since 1976, Geophys. Res. Lett., 25, 4377–4380, 1998.
Garcia, H. A.: Evidence of solar-cycle evolution of North-South flare asymmetry during cycles 21 and 22, Solar Phys., 127, 185– 197, 1990.
Harvey, K. L.: Measurements of Solar Magnetic Fields as an Indica-tor of Solar Activity Evolution, in: Proceedings of SOLERS22: Proceedings of the Workshop on the Solar Electromagnetic Ra-diation Study for Solar Cycle 22, (Ed) Donnelly, R. F., U. S. Department of Commerce, SEL NOAA ERL, 113–129, 1992. Harvey, K. L. and White, O. R.: What is solar cycle minimum?, J.
Geophys. Res., 104, 19 759–19 764, 1999.
Heath, D. F. and Schlesinger, B. M.: Temporal variability of UV solar irradiance from 160–400 nm over periods of the evolution and rotation regions from maximum to minimum phases of the sunspot cycle, in: IRS 84: Current problems in Atmospheric Ra-diation, Proceedings of the International Radiation Symposium, Perugia, Italy, (Ed) Fiocco, G., 315–319, A. Deepak, Hampton, Va., 1984.
Hinteregger, H. E., Fukui, K., and Gilson, B. G.: Observational, reference, and model data on solar EUV, from measurements on AE-E, Geophys. Res. Lett., 8, 1147–1150, 1981.
Ivanov, E. V., Obridko, V. N., and Ananyev, I. V.: Variations of solar irradiance, 10.7 cm radio flux, He I 10 830 ˚A equivalent width, and global magnetic field intensity and their relation to large-scale solar magnetic field structure, Solar Phys., 177, 217–228, 1998.
Joshi, A.: Asymmetries during the maximum phase of solar cycle 22, Solar Phys., 157, 315–324, 1995.
Kane R. P., Hari Om Vats, and Sawant, H. S.: Short-term periodic-ities in the time series of solar radio emissions at different solar altitudes, Solar Phys., 201, 181–190, 2001.
Lean, J.: Solar ultraviolet irradiance variations: A review, J. Geo-phys. Res., 92, 839–868, 1987.
Mahajan, K. K., Hari Om Upadhyay, Sethi, N. K., Hoegy, W. R.,
Pesnell, W. D., and Brace, L. H.: Pioneer Venus Orbiter mea-surements of solar EUV flux during solar cycles 21 and 22, Solar Phys., 177, 203–216, 1998.
McKinnon, J. A.: Sunspot numbers 1610–1985, UAG Report 95, pp 112, NOAA Boulder, Colorado, USA, 1987.
Mount, G. and Rottman, G.: The solar spectral irradiance 1200– 3184 ˚A near solar maximum: 15 July 1980, J. Geophys. Res., 86, 9193–9198, 1981.
Mount, G. H., Rottman, G. J., and Timothy, J. G.: The solar spectral irradiance 1200–2550 ˚A at solar maximum, J. Geophys. Res., 85, 4271–4274, 1980.
Parker D. G., Ulrich, R. K., and Pap, J. M.: Modeling solar UV variations using Mount Wilson Observatory indices, Solar Phys., 177, 229–241, 1998.
Ramesh, K. B.: A correlative study of green coronal intensity with other solar indices, Solar Phys., 177, 311–319, 1998.
Rottman, G. J.: Rocket measurements of the solar spectral irradi-ance during solar minimum, J. Geophys. Res., 86, 6697–6705, 1981.
Rottman, G. J.: Solar cycle variation of ultraviolet, 120–200 nm irradiance measured by the solar mesosphere explorer, 1982 through 1985, Eos Trans. AGU, 66, 1009, 1985.
Rottman, G. J. and London, J.: Solar UV irradiance observations of 27-day variations and evidence for solar cycle variations, in: IRS 84: Current problems in Atmospheric Radiation, Proceed-ings of the International Radiation Symposium, Perugia, Italy, (Ed) Fiocco, G., pp. 320–324, A. Deepak, Hampton, Va., 1984. Rybansky, M., Rusin, V., and Minarovjech, M.: The green coronal
index and soft X-ray flux, Solar Phys., 177, 305–310, 1998. Schwabe, S. H.: Die Sonne, Astronomische Nachrichten 20, 473,
283–288, 1843.
Schwabe, S. H.: Sonnen-Beobachtung im Jahr 1843, Astronomis-che Nachrichten 21, 495, 234–235, 1844.
Swartz, W. E. and Overbeck, R.: The Solar Ca II Plage Index, Pennsylvania State University Ionosphere Research Laboratory Report 373(E), 8 October, 1971.
Waldmeier, M.: The sunspot activity in the years 1610–1960, Schulthess & Company AG, Z¨urich, 1961.
Woods, T. N., Tobiska, W. K., Rottman, G. J., and Worden, J. R.: Improved solar Lyman alpha irradiance modeling from 1947 through 1999 based on UARS observations, J. Geophys. Res., 105, 27 195–27 215, 2000.