Modelling selected parameters of granular elements in the mixing process
Dominika MatuszekDepartment of Biosystems Engineering, Opole University of Technology, Mikołajczyka 5, 45-271 Opole, Poland
Received February 4, 2013; accepted May 14, 2013
*Corresponding author e-mail: [email protected]
A b s t r a c t. This paper presents the effects of mixing non-homogeneous bicomponent granular structures by the flow method with the use of an inverted cone insert as a supporting element. The analysis of homogeneity of mixtures after 10 con-secutive flows was carried out based on computer image analysis. Based on these tests, the use of a nonlinear regression for the mo-delling of two selected parameters of the process was proposed. Spatial dependence was described by the relation between the va-riance of the tracer distribution (dependent variable) and density ratio of the mixed components, and the diameter of the cone insert used (independent variables). The mathematical description was made with the use of a ‘nonlinear regression’ module. The results obtained in these tests proved that the use of supporting insert improves the degree of mixability of granular materials. The two-dimensional model in the form of a quadratic function may be a for-mula for describing the influence of selected parameters on the homogeneity of a granulate mixture before the beginning of the mixing process.
K e y w o r d s: granular mixture, inverted cone insert, funnel flow
INTRODUCTION
The mixing process of granular elements determines the quality of products in many industrial branches such as the chemical industry, pharmaceutical industry, building industry, and the agricultural and food industry (Radl et al.,
2010; Roberts, 2006).
The correct understanding of the behaviour of granular materials is one of the most important things for a variety of industrial processes (Boss, 2004; Marashdeh et al., 2008). The characterisation of a granular mixture containing pro-ducts of different particulate solids, characterized by their different size class distribution, different morphology, and
different chemical-physical attributes is always difficult (Bonifazi et al., 2008). The most important factor that af-fects of the quality of a granular mixture and the mixing pro-cess is particle size. The majority of the work focused on this problem is associated with studying the segregation phenomena (Alexander et al., 2003; Obregón et al., 2010; Ottino and Khakhar, 2000; Yang 2006).
The manner in which material flows out of a silo can be characterized as either mass flow or funnel flow. A de-scription of each of these flow types from silos has been presented in many scientific studies (Barnum et al., 2004; Błasiński et al., 2001; Spencer and Hill, 2001) as well as in earlier publications by this author (Matuszek and Tukiendorf, 2007a). Segregation of mixed materials can also occur in storage because of differences between the densities and dimensions of the mixed materials. A fre-quent solution for controlling the flow type and reducing particle segregation is to install a cone-shaped insert within the flow channel (Tukiendorf, 2002).
Computer image analysis is being applied more and more extensively in the agricultural and food industries, among others, to determine the degree of mixability of gra-nular materials (Matuszek and Tukiendorf, 2007a), to eva-luate the quality of food products (Szwedziak and Sobkowicz, 2006) or plant tissue (Gancarz et al., 2007) and also to iden-tify soil macropores and to quaniden-tify their size and shape (Czachor and Lipiec 2004). Doucet and others (Doucet et al., 2008) present other non-intrusive methods for assessing the mixing parameters of the V-blender using radioactive particle tracking.
The purpose of this work was to evaluate the effect of an inverted cone on the flow of material in a process of mixing non-homogeneous bicomponent granular structures by the flow method. The nonlinear regression to describe changes in the homogeneity of the granular mixture depends on two parameters: the proportion of density of the components mixed and the diameter of the cone insert.
MATERIALS AND METHODS
The mixing of the granular components was carried out with the use of a laboratory flow mixer. The appropri-ate construction of silos provided funnel flow. The mixing process (funnel flow) was carried through cycles of filling – discharge (flows) of a silo with three conical inserts. The experimental system used in this study consists of three identical silos. The third silo consists of ten sections which can be weighed independently of each other as well as sep-arated from the whole structure to study the particle size distribution. The silos had identical dimensions: height of the cylindrical part - 500 mm, height of the part with coni-cal section - 90 mm, internal diameter - 300 mm, diameter of the outlet - 30 mm. A detailed description of the experi-mental silo system was presented in a previous work by the authors (Matuszek and Tukiendorf, 2007b).
Granular elements were selected so that it could be pos-sible to make bicomponent non-homogeneous structures (6 mixtures). The structures consisted of a mixture of two different materials (Group A and Group B) which differed in density but had particles whose particle sizes (particles which passed through a sieve diameters) were constant. The basic characteristics of the granular elements used in this research are presented in Table 1. The structures consisted of a key element (tracer) and a dissipative component. The key element was 10% of the mixture while the dissipative component was 90% of the mixture by volume. The key element for granular structures in group A had a smaller sieve diameter than the dissipative component, while in group B it was the opposite (Table 2). The volume ratio of the components amounted to 1:9 (bigger to smaller parti-cles in group A and the opposite in group B).
The flow mixer was equipped with auxiliary elements in the form of inverted cone inserts. The elements were installed in the upper part of each silo. Three inserts with an identical cone angle α = 110° and different bottom dimen-sions (diameter): d1 = 150 mm, d2 = 120 mm, and d3 = 180 mm were used. The number of flows was from 1 to 10. After each flow an analysis of homogeneity was performed.
In order to evaluate the concentration of the key ele-ment, a computer analysis of the image was generated. For every 10 cross-sections of analytical silo, the share of the tracer was analysed (amount of the 10% participation adopted for the experiment). To measure its distribution, the value of variance was taken, assuming that the change of concentration shares of the tracer in subsequent sections would have an effect on the change of value of variance causing its growth from the value ‘0’ (appropriate for an ideal homogeneity). Subsequent steps for computer pro-cessing of images (Fig. 1), which were presented in detail in other works by the authors (Matuszek and Tukiendorf, 2007a,b), allowed for a quick analysis of the mixing results (homogeneity) and because of that, it was possible to im-prove the methodology of research.
At the same time the content of the granular material in each ring of the analytical silo (removable structure con-sists of 10 cross-sections) was weighted using an analytical scale. The mass of the key element was converted into a per-centage share.
T a b e l a 1. Basic physical parameters of granular materials
Physical parameter Vetch Alumina Lupin Agalite Rape
Sieve diameter of grains (mm) 4.00 3.00 6.50 2.50 1.80
4.80 6.50
Bulk density (kg m-3) 1150 1550 1100 2410 1060
Angle of repose (˚) 25 29 24 22 30
T a b l e 2. Properties of mixed granular structures in groups A and B
Group Granular structure
Proportion of the grains sieve
diameters d1/d2
density ρ1/ρ2
A Vetch-LupinAgalite-Vetch
Rape-Alumina 1.60
1.00 2.10 0.70
B Lupin-VetchAgalite-Vetch
Vetch-Alumina 1.60
Based on this study, the authors proposed to model the mixing process with the use of a two-dimensional function where the dependent variable was the variance of the tracer distribution and the independent variables were the density proportion of the mixed components and the diameter of the inverted cone insert. The modelling was carried out on the basis of the average variance value for 10 flows. The cal-culations were made with the use of Statistica version 9.1 module: non-linear regression (Aczel, 2005, StatSoft, 2010). In order to describe the changes, a formula in the form of a quadratic function Eq. (1) was proposed.
f y e y d y x c x b x a
z= 2+ + + 2+ +
where: z – variance of the tracer distribution, a, b, c, d, e, f – coefficients of quadratic regression, x – proportion of the density of the granular elements, y – diameter of the inverted cone insert.
RESULTS AND DISCUSSION
The change in variance of the tracer distribution as well as its percentage share in consecutive stages of mixing (flows 1 to 10) are presented in graphical form on diagrams (Figs 2-5).
A graphical interpretation of the changes of variance of the tracer distribution in the consecutive steps of mixing for structures from groups A and B clearly show the division of the process into two stages of changes:
- violent: in the initial steps of mixing (1 to 6 flows), con-siderable changes of variance were observed;
- gentle: considerable stabilization of variance in the last steps of mixing (7 to 10 flows).
The same stages of the mixing process was observed in a previous research carried out by the authors and presented in the publication (Matuszek and Tukiendorf, 2007b). (1)
a b c
Fig. 1. Image of a selected cross-section of the analytical silo in the subsequent stages of computer image analysis: a – digital image, b – image after pixelisation of cells 50x50, c – binary image.
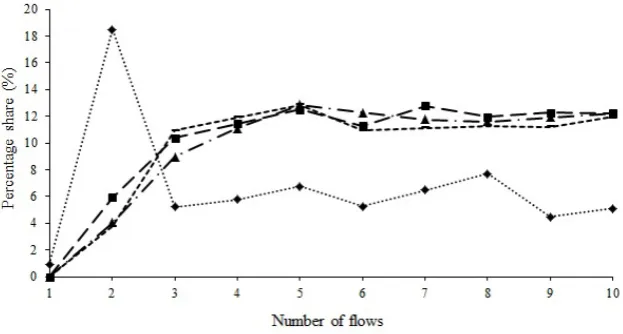
Fig. 3. Change of percentage share of the tracer during the mixing of structure Ia (vetch-lupine) in the selected cross-section of the analytical silo. Explanations as in Fig. 2.
Fig. 4. Change of variance of the tracer distribution during the mixing of structure Ib (lupine-vetch) in the selected cross-section of the analytical silo. Explanations as in Fig. 2.
The course of changes of the percentage share of the key element during mixing confirms the above mentioned phenomenon.
A sense of repeatability, which indicates a stabilization of the process, was observed in the curves after the 6th-7th flow. The homogeneity of the mixture does not appear to change significantly in the last few stages of mixing, so shortening of the mixing time from 10 to 7 flows seems to be reasonable and advantageous based on economic reasons.
The use of an inverted cone element improved the results of mixing, which is shown by a smaller variance of the tracer distribution. It was noticed that the diameter of the insert used had a significant impact on the effect of mixing. For the granular structures where the key element
had a smaller diameter, the use of a cone insert measuring 120 mm (mixture vetch – lupine, agalite – vetch) resulted in obtaining a mixture with the most uniform distribution of tracer (best homogeneity). In the second case, when the tracer was the larger component, better effects were obtained using an insert with a diameter of 150 mm (mix-ture agalite – vetch) and 180 mm (mix(mix-ture lupine-vetch, vetch – aluminium oxide).
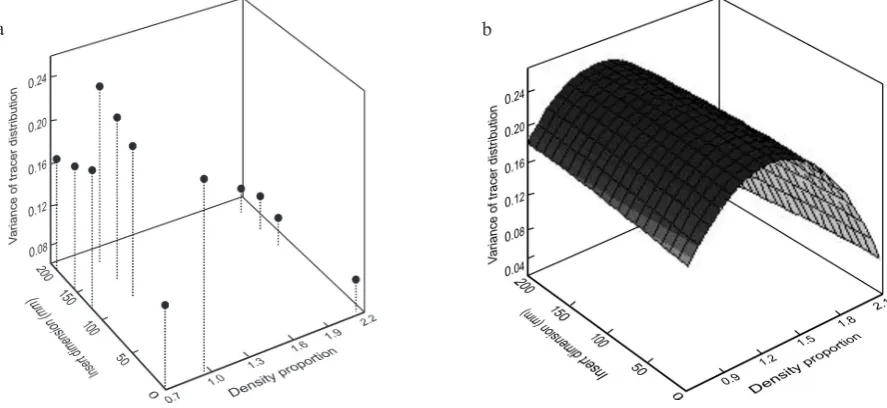
A graphical interpretation of the dependence of the vari-ance of tracer distribution on the density proportion and the insert dimension for empirical values is presented in Figs 6a and 7a.
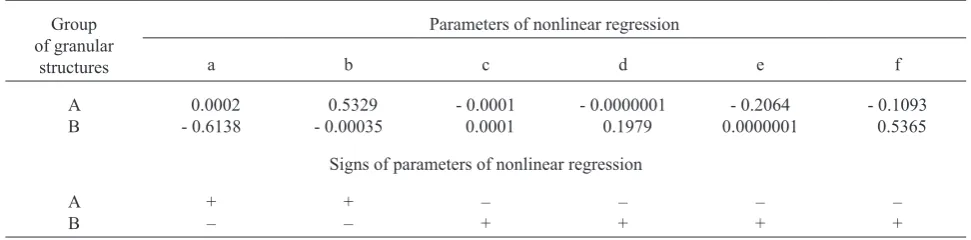
Based on these tests a statistical analysis was carried out: regression coefficient values for the proposed quad-ratic model were determined (Table 3). The correcting
Fig. 6. Spatial dependence distribution y=f(x,y) for structures from group A (a), and theoretical model (b).
Fig. 7. Spatial dependence distribution y=f(x,y) for structures from group B (a), and theoretical model (b). a
a
b
quantity in the form of a coefficient of determination R2 as well as expected values and remainders for each case were obtained.
As a result of the estimated and observed values, the dependence of each parameter, determined in Table 2, on mixing was obtained. This analysis was used for the pre-diction of changes in the quality of a structure depending on the proportion of the density of the mixed material and the diameter of an inverted cone insert. On the basis of the knowledge concerning regression parameters of quadratic functions, diagrams were elaborated (Figs 6b and 7b).
The obtained model is highly reliable. Coefficients of determination for groups A and B amounted to 94.78 and 95.34%, respectively, which proves a very good fitting of the model to the empirical data. Using the quadratic func-tion the impact which an inverted cone insert has on the degree of mixing can be estimated. Nevertheless, structures where the key element has a smaller or larger diameter than the dissipative component have to be treated separately. In Table 3, the signs on each term in the quadratic function were opposite of each other (plus or minus) for materials in group A versus those in group B. The spatial dependence of these materials is shown graphically in Figs 6a,b and 7a,b. These graphs demonstrate that the spatial dependence of group A on group B is completely reversed. It was observed that structures with the same proportions of den-sity and a larger sieve diameter of the tracer mix better than structures where the tracer has a smaller sieve diameter.
CONCLUSIONS
1. The inverted cone insert caused an improvement of the homogeneity of the mixture by getting a lower variance of the tracer distribution.
2. The analysis describes the characteristics of the mixing process of granular materials within a funnel-flow system. Two different stages of the process were observed a stage of: violent changes in the initial steps of mixing and a gentle changes in the final steps of mixing.
3. The proposed two-dimensional model in the form of a quadratic function legitimized the use of using inserts for the mixing process by the flow method.
REFERENCES
Aczel A.D., 2005. Statistics in management (in Polish). Wydawnictwo Naukowe PWN, Warsaw, Poland.
Alexander A., Muzzio F., J., and Shinbrot T., 2003. Segregation patterns in V-blenders. Chem. Eng. Sci., 58(2), 487-496.
Barnum R.A., Bengston E., and Clement S.A., 2004. Avoiding common solids handling pitfalls in food processes. Powder Handling Processing, 16, 120-124.
Błasiński H., Pyć K.W., and Rzyski E., 2001. Machines and technological apparatus of the food industry (in Polish). Łódź University of Technology Publisher, Poland.
Bonifazi G., Massacci P., and Serranti S., 2008. Micro-tomographic techniques applied to particulate solids based products characterization. Granular Matter, 10, 315-321.
Boss J., 2004. Contemporary problems of mixing granular mate-rials (in Polish). Inżynieria i Aparatura Chemiczna, 4, 31-34.
Czachor H. and Lipiec J., 2004. Quantification of soil macropo-rosity with image analysis. Int. Agrophysics, 18, 217-223.
Doucet J., Bertrand F., and Chaouki J., 2008. Experimental characterization of the chaotic dynamics of cohesionless particles: application to a V-blender. Granular Matter, 10, 133-138.
Gancarz M., Konstankiewicz K., Pawlak K., and Zdunek A., 2007. Analysis of plant tissue images obtained by confocal tandem scanning reflected light microscope. Int. Agro-physics, 21, 49-53.
Marashdeh Q., Warsito W., Fan L.-S., and Teixeira F., 2008.
Dual imaging modality of granular flow based on ECT sen-sors. Granular Matter, 10, 75-80.
Matuszek D. and Tukiendorf M., 2007a. Computer analysis of the image in the estimation of mixing the granular systems (funnel flow system) (in Polish). Inżynieria Rolnicza, 2(90), 183-188.
Matuszek D. and Tukiendorf M., 2007b. Influence of seeds dimensions on the process of mixing in the flow agitator with applying additional elements (in Polish). Inżynieria Rolnicza, 8(96), 171-177.
Obregón L., Realpe A., and Velázquez C., 2010. Mixing of gra-nular materials, part II: effect of particle size under periodic shear. Powder Technol., 201, 193-200.
Ottino J.M. and Khakhar D.V., 2000. Mixing and segregation of granular materials. Annual Review of Fluid Mechanics, 32, 55-91.
Radl S., Kalvoda E., Glasser B.J., and Khinast J.G., 2010.
Mixing characteristics of wet granular matter in a bladed mixer. Powder Technol., 200, 171-189.
T a b l e 3. Parameters of nonlinear regression and corresponding signs
Group of granular
structures
Parameters of nonlinear regression
a b c d e f
A
B - 0.6138 0.0002 - 0.00035 0.5329 - 0.0001 0.0001 - 0.0000001 0.1979 0.0000001- 0.2064 - 0.1093 0.5365 Signs of parameters of nonlinear regression
A
Roberts A.W., 2006. Bulk solids handling an historical overview and current developments. Bulk Solids Handling, 26, 392-414.
Spencer A.J.M. and Hill J.M., 2001. Non-dilatant double-shear-ing theory applied to granular funnel-flow in hoppers. J. Eng. Mathematics, 4, 55-73.
StatSoft, Inc., 2010. STATISTICA (data analysis software system) version 9.1. www.statsoft.com.
Szwedziak K. and Sobkowicz J., 2006. Describing the pollutants
in flour with the help of computer analysis of the image (in Polish). Postęp Techniki Przetwórstwa Spożywczego, 2, 24-25.
Tukiendorf M., 2002. The use of roof shaped system inserts in mixing nonhomogenous mixtures (in Polish). Inżynieria Rolnicza, 4(37), 337-343.