Integrated Scheduling of Electric Vehicles and Demand
Response Programs in a Smart Microgrid
A. Zakariazadeh* and S. Jadid*(C.A.)
Abstract: Microgrids (MGs) usually consist of several types of Distributed Energy Resources (DERs) like renewable and conventional generation units, energy storages and responsive loads. In order to operate the MG with minimum cost and maximum reliably, an integrated scheduling model of DERs should be implemented. In this paper, an operational planning model of a MG which considers Demand Response (DR) and Electric Vehicles (EVs) charge/discharge programs are proposed. The proposed methodology investigates the potential role of EVs and DR in providing reserve capacity for a MG with a high contribution from variable generation such as wind and solar power. The novelty of this paper is the demand side participation in energy and reserve scheduling, simultaneously. The proposed model was tested on a typical MG system in connected mode and the results show that integrated scheduling of EVs and DR programs will reduce total operation cost of MG and cause more efficient use of resources.
Keywords: Demand Response, Electric Vehicle, Microgrids, Renewable Generation, Reserve.
1 Introduction1
The Microgrids (MGs) are the systems that integrate Distributed Generation (DG) units, energy storage systems and controllable loads on a low voltage network which can operate in either grid-connected mode or stand-alone mode [1, 2]. A renewable-based MG can be understood as a particular case of a more general concept called a ‘smart grid’. Smart grids are understood to be the key enabling technology for renewable energy development, electric vehicle (EVs) adoption and energy efficiency improvements [3]. Moreover, Energy Management System (EMS) is essential supervisory control tool used to optimally operate and schedule MGs.
On the other hand, with increasing concerns about oil sustainability and the negative environmental impact of petroleum-based transportation worldwide, EVs have often been suggested as an effective technology to reduce gasoline consumption and emissions. The electrification of the transportation sector brings more challenges and offers new opportunities to the power system planning and operation [4, 5].
Iranian Journal of Electrical & Electronic Engineering, 2014. Paper first received 26 May 2013 and in revised form 10 Sep. 2013. * The Authors are with the Center of Excellence for Power Systems Automation and Operation, Iran University of Science & Technology (IUST), Tehran, Iran.
E-mails: [email protected] and [email protected].
In [6], a distributed demand response algorithm for EVs charging using the concept of congesting principle in the internet traffic control has been proposed. In [7], a heuristic method has been implemented to minimize the EV charging cost in response to time-of-use price in a regulated market demonstrating that peak demand can be reduced.
EV owners may also make money by using the stored energy in their vehicles; the battery of EV can discharge as well as charge according to the owner convenience. Moreover, Vehicle-to-Grid (V2G) capability provides some valuable power system services such as regulation, spinning reserve, and peaking capacity [8].
An analysis on the six-bus meshed network based on dynamic programming for finding out the optimal size, site has been presented in [9]. The paper also determined the optimal mix of DERs among microturbines (MTs), photovoltaic (PV), and battery storage to meet the electrical and thermal loads. It used minimization of cost as the objective function that the cost included deployment cost, heat compensation cost, and fuel cost. The paper also imposed a reliability constraint on the analysis.
The authors in [10] described a centralized control system for a MG. The controller has been used to optimize the operation of the MG during interconnected operation, i.e., the production of local generators and energy exchanges with the distribution network were
maximized. Two market policies were assumed to offer options for controllable loads, and this demand-side bidding was incorporated into the centralized control system. However, this work did not considered renewable generation uncertainty and did not allocate reserve in its model. The authors in [11] using particle swarm optimization, reduced the costs of MGs with controllable loads and battery storage by selling stored energy at high prices and shave peak loads of the larger system.
Another investigated concept in this paper deals with demand response (DR). It is used by electric utilities to manage customer electricity consumption in response to supply conditions. Utilities encourage customers to reduce their consumption at critical periods or in response to market prices. Currently, generation and transmission system facilities are oversized to cover peak demand plus a margin for forecasting error and unforeseen events. Smoothing such peak demand could lead to cost and size reduction of the plant. Some systems, such as DR, may encourage energy storage to arbitrage within periods of low and high demand (or low and high prices). In the literature, there are several studies investigating DR concept in MGs for different applications, for instance: demand shifting and peak shaving [12–15], DR exchange in which DR is treated as a public good to be exchanged between buyers and sellers [16], load and generation profiles control [17, 18], incentive based DR regulation considering penalties for customers in case of no load reduction response [19], emergency demand response for real-time voltage control in smart distribution systems [20], and the combination of distributed interruptible load shedding and dispatched micro-sources to manage the network by distribution system operators [21]. A dynamic modeling and control strategy for a sustainable MG primarily powered by wind and solar energy has been presented in [22]. This study has considered both wind energy and solar irradiance changes in combination with load power variations.
In this paper, the MG is operated by a Microgrid Energy Management System (MEMS) that manages the technical features of generation and consumption as well as economical aspect of operation. The MEMS is responsible for optimal scheduling of MG generation units as well as making possible demand side participation in energy and reserve scheduling.
The main focus of this paper is on proposing an integrated scheduling method in a MG and considering demand side participation, renewable generation uncertainty and EVs in energy and reserve operational planning.
The rest of this paper is organized as following. In section 2 the concept of the proposed model is described. The model formulation is detailed in Section 3. Simulation results are given in Section 4 and the paper is concluded in Section 5.
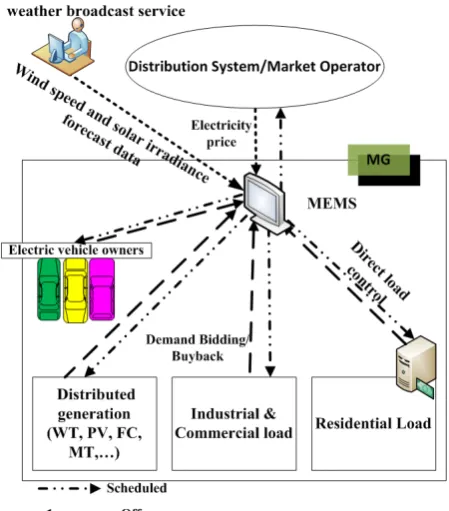
Fig. 1 MG operational scheduling data flow.
2 Microgrid Energy Management System (MEMS) The MEMS manages and schedules all distributed energy resources such as DGs, EVs and DR in its grid in order to optimally operate the MG with minimum cost. The MG operational planning data flow is shown in Fig. 1. The assumptions used in proposed model are elaborated next.
Assumptions
• The MEMS is allowed to access day-ahead electricity prices of the open market for following 24-hour scheduling.
• The wind speed and solar radiation forecasts and their forecast errors are received form nearest weather broadcast service. The forecast error is considered as a percentage of wind and PV predicted output power.
• Electric vehicle owners submit their parked time period and required stored energy for departure time for next 24-hour to MEMS by cell phone or internet portal.
In the proposed model, the load can participate in both of energy and reserve scheduling and earn benefit from reducing or shifting their consumption [23]. In real world, it is hard to expect every residential load to take part in demand response programs, and have interaction with power market and system operator. In the daytime, people may not be at home or all the residents are not familiar with energy management procedures. So, it is logical to use an automatic system to help residential consumers in order to participate in energy management programs. While it is usually difficult and confusing for
the residential consumers to manually respond to prices that are changing every hour, MEMS can help them to manage their consumption with objectives of cutting expenses and increasing welfare. In the proposed model, every load type such as industrial, commercial and residential loads can participate in demand response programs.
In this paper, an incentive payment oriented demand response scheme is presented for MG operational planning. Incentive-based demand response programs provide a more active tool for load-serving entities, electric utilities, or grid operators to manage their costs and maintain reliability. Incentive payment oriented demand resources can be used as reserves in the day-ahead scheduling and dispatch, or as capacity resources in system planning. In this paper, three types of incentive-based demand response programs are considered for load management program that are listed below [24, 25]:
• Demand bidding/buyback programs • Ancillary services market programs • Direct load control
3 Model Formulation
The DERs scheduling program is run for 24-hour day-ahead scheduling to calculate the hourly energy requirement form the main grid for the next 24 hours. Also, this scheduling will determine the generation output of DGs and demand side participation as well as EVs charge/discharge program. Moreover, it is determined that which resources should provide the reserve requirement for each hour.
The proposed model aims at minimizing the total operation cost of MG. The objective cost function of this model ( ) is sum of overall hourly operation cost of MG which is given by (1):
(1)
,
, ,
, ,
, ,
,
where , is the bid form th DG at th period that covers all fuel and maintenance costs as well as capital cost. , is start-up cost of DG, and are the purchased energy cost and sold energy revenue from/to the main grid, respectively; is the total
number of EVs; , and , are power discharge and discharge price of EV in period ; In this study, the period duration is considered 1 hour. As a result, the charge/discharge scheduling period length is same as one in generation scheduling. , and
, are the energy reduction amount in and price offer in $/ by th industrial or commercial loads, respectively. The residential (home) energy reduction by th home is indicated with , , the incentive payment for reduction is shown by , and the reserve commitment cost is indicated by .
The bid function of each DG should contain the fuel and maintenance cost ( ) as well as a percentage of investment cost ( ). The cost function of DG is given by Eq. (2):
, . , (2)
where , is the active power output of th DG at th period of scheduling.
The MG in interconnected mode can exchange power with the main grid. The cost and revenue of purchasing and buying power from the upstream network is calculated as follows:
(3)
(4) where and are the purchased electricity tariff and imported power from the main grid at th period, respectively. On the other hand,
and are the sold electricity tariff and exported power to the main grid at th period, respectively. The electricity tariffs which are used for power exchange cost calculation are equal to hourly electricity price of the main grid.
The reserve cost in the objective function is calculated by Eq. (5):
, ,
, Ψ
,
,
(5)
where , and , are the reserve amount and offer from th load, respectively; , and
Ψ represent, respectively, the reserve provided by EV in period and the price for reserve; , and are the residential load amount and price offer for participation in reserve scheduling, respectively. The other source of offering reserves is
DGs with , and that indicate reserve amount and bid.
The start up cost of DG units is calculated as follows:
, , , 1 (6)
, 0 (7)
where is the start up cost of th DG, and , is a binary variable that shows the on-off state of DGs.
The constraints of the proposed model are: • power balance equation
(8)
, ,
,
, ,
where is the predicted demand of whole MG at th period; , and , are, respectively, power discharge and charge of vehicle in period ; Power balance equation is the most important constraint in operation planning. If the total generation be less than consumption, system frequency drop occurs which is undesirable.
• EVs constraints
In each period of scheduling, the EV charge and discharge are not simultaneous:
, , 1 1, … , ;
1, … , ; , 0,1 (9)
where , and , are, respectively, the binary variables of EV related to power discharge and charge states in period .
The battery energy balance for each vehicle should be considered. The state of charge variable ( , ) represents the stored energy in the battery of vehicle at the end of period . The energy consumption for traveling in period ( , ) has to be considered jointly with the energy remained from the previous period and the charge/discharge in the period [26].
, , 1 , ,
1
,
1, … , ; 1, … ,
(10)
where and represent, respectively, the grid-to-vehicle charging and grid-to-vehicle-to-grid discharging efficiency coefficients of EV .
The discharge and charge limit for each EV considering the battery discharge rate is given as follows [27]:
, , , ,
1, … , ; 1, … , (11)
, , ,
1, … , ; 1, … ,
(12)
where , and , are the maximum power discharge and charge of EV .
Depletion of EV battery up to a certain minimum level ( ) and charging up to a maximum level ( ) are ensured by Eqs. (13) and (14) to prevent loss of battery life [28].
, 1, … , ;
1, … , (13)
, 1, … , ;
1, … ,
(14)
where and is defined based on the battery capacity limit for each EV that are calculated as follows:
, 1, … , (15)
, 1, … , (16)
where , represents the maximum capacity of battery of EV ; and are, respectively, the maximum and minimum percentage of battery capacity considering battery life.
The vehicle battery discharge and charge limits considering, respectively, the battery state of charge and the battery capacity and the previous period stored energy are given as follows [29]:
1
, ,
, 1
1, … , ; 1, … ,
(17)
, , 1
1, … , ; 1, … , (18)
• DG unit output constraint
(19)
, . ,
(20)
, , . ,
where and are the minimum and maximum limitation of th DG output and , shows the on/off state of DG. The spinning reserve provided by th DG is shown by , . The conventional DG like micro turbine, diesel generator and fuel cell may prepare spinning reserve, and WT and PV do not offer reserve.
• Reserve requirement
The reserve requirement is determined based on renewable generation forecast error as given by Eq. (21):
(21)
, , ,
,
where is the minimum reserve requirement at period that is calculated by (22):
(22)
. , . ,
where , and , are output power from wind turbine and photovoltaic unit , and are the forecast error coefficients which are used to determine the uncertainty of output power of wind and solar units which may unexpectedly increase or decrease from their predicted values. These coefficients are calculated based on historical data and the geographical condition of MG.
• Load constraint
The load reduction should be constrained to maximum amount of their offers. Also the scheduling program should consider demands energy and reserve participation, simultaneously. Constraints in Eqs. (23) and (24) show that sum of energy reduction and reserve commitment of each individual load at every hour should be lower or equal to maximum amount of their offers.
, , (23)
, , (24)
where and are the maximum amount of reduction that are offered by industrial and residential loads at period , respectively.
The shiftable loads constraint which shows the time limitation of their performance is given as follows:
, , (25)
, , , , . , (26)
where indices and show the home number and shiftable appliance, respectively. For shiftable load scheduling, we define a binary variable , , that indicate on/off state of some home appliances that can set their on/off time. and are the allowable start and end time of these shiftable appliances working period, and is the required time that they need to perform their applications. , , is the power consumption of shiftable appliances at home that turn on at time ( ) where the nominal power of these appliances is shown by , .
4 Case Study
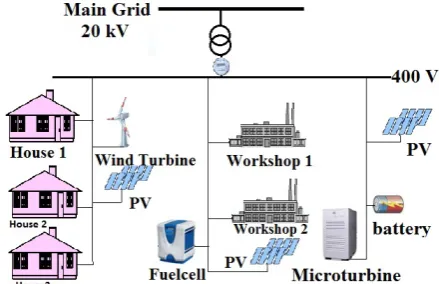
The proposed operational planning model was tested on a typical MG in low voltage distribution network. This test system is depicted in Fig. 2. Two types of loads are considered in MG: three residential and two
medium industrial workshops loads. A variety of DERs, such as a proton-exchange membrane Fuelcell (FC), a Microturbine (MT), a directly coupled wind turbine (WT), and five Photovoltaic (PV) arrays are installed in MG. It is assumed that all DGs produce active power at a unity power factor. The technical aspects of MT and FC are obtained from [30-31] and their cost function calculation are described in [10].
The minimum and maximum operating limits of DERs as well as their cost function coefficients are presented in Table 1. Data of actual wind and PV production are taken from [10]. Table 2 provides the hourly energy price of a real electricity market [10]. The total hourly load demand of the MG on a weekday is presented in Table 3. The industrial loads price and amount offers for load reduction is presented in Table 4. The residential loads reduction offers for each house can be found in Table 5. The WT and PV generation forecast errors are taken as 20% of their hourly forecasted outputs.
The case study considers 50 EVs, for which the technical information has been obtained from vehicle manufacturers. A Typical 10 kWh battery capacity for most of EVs is selected [32]. Also, two other vehicle types that are used in this case study are Nissan Leaf with a battery capacity of 24 kWh and Citroen C-Zero with a battery with 16 kWh [33, 34]. Typical battery charge and discharge efficiency are assumed 90% and 95%, respectively [35]. In order to optimize EV battery life, depletion of EV battery up to 85% of the rated battery capacity is assumed.
A standard single-phase 220 V, 15 A socket is assumed for charging point in home or work place. For this analysis, a fixed charging power of 4 kW is selected because this is commonly available in most single-phase residential households without having to reinforce wiring [32, 36].
The above formulation has been implemented in GAMS [37] using Mixed-Integer Linear Programming (MILP) solver CPLEX on a VAIO computer with a 2.27 GHz core i5 processor and 4 GB of RAM. The computation time for the proposed multi-objective method is 3 sec.
Fig. 2 Typical MG test system.
Table 1 The technical and economical features of DERs.
units Min power (kW)
Max power (kW)
Start-Up cost (Ect)
(Ect/kWh) (Ect/h)
MT 1.5 100 0.14 4.37 85.06
FC 10 100 0.24 2.84 255.18
WT 0 30 - - -
PV1 0 5 - - -
PV2 0 5 - - -
PV3 0 5 - - -
PV4 0 5 - - -
PV5 0 5 - - -
Table 2 Hourly price of open market.
1 2 3 4 5 6
$/ 22.6 19 13.9 12 11.5 19.9 7 8 9 10 11 12
$/ 23 38.3 149.8 400 400 400 13 14 15 16 17 18
$/ 149 400 201 194.9 60 41.3 19 20 21 22 23 24
$/ 35.1 43.9 117.1 54 30 25.5
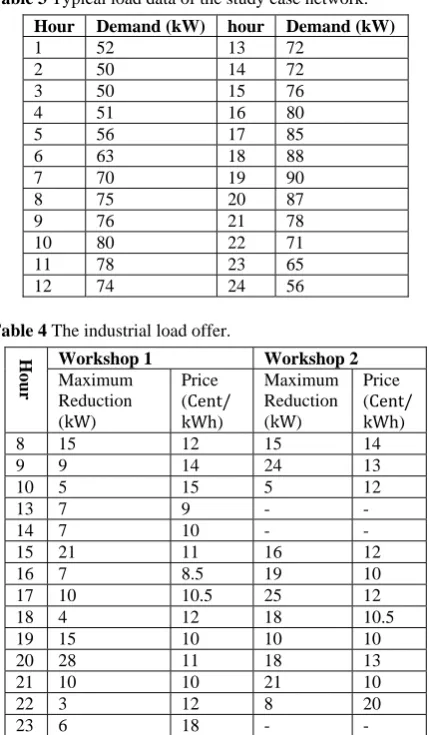
Table 3 Typical load data of the study case network.
Hour Demand (kW) hour Demand (kW)
1 52 13 72 2 50 14 72 3 50 15 76 4 51 16 80 5 56 17 85 6 63 18 88 7 70 19 90 8 75 20 87 9 76 21 78 10 80 22 71 11 78 23 65 12 74 24 56
Table 4 The industrial load offer.
Hour Workshop 1 Workshop 2
Maximum Reduction (kW)
Price (Cent/
kWh)
Maximum Reduction (kW)
Price (Cent/
kWh) 8 15 12 15 14 9 9 14 24 13 10 5 15 5 12 13 7 9 - - 14 7 10 - - 15 21 11 16 12 16 7 8.5 19 10 17 10 10.5 25 12 18 4 12 18 10.5 19 15 10 10 10 20 28 11 18 13 21 10 10 21 10 22 3 12 8 20 23 6 18 - -
Table 5 Residential load reduction offers (W).
Hour House 1 House 2 House 3
7 300 200 -
8 500 0 200
9 500 200 200 10 500 0 300 11 1000 1000 0 12 200 200 150 13 200 200 200 14 1000 0 1200 15 900 850 - 16 200 200 200 17 1000 900 850 18 1000 750 1000 19 200 150 200 20 1000 950 0 21 1000 750 800 22 950 - - 23 1000 500 1000 24 200 200 150
In order two evaluate the robustness of the proposed method, the case study has been carried on in two cases: • Case 1: Energy and reserve scheduling without considering DR and EV charge/discharge programs
• Case 2: Energy and reserve scheduling with considering DR and EV charge/discharge programs
In the first case, all reserve requirements should be provided by MT and FC. Also, The EVs are considered as load that should be charged enough in order to be ready for scheduled driving pattern. The result of energy resources scheduling in the first case has been shown in Fig. 3. Also, the scheduled reserve capacity has been illustrated in Fig. 4. In this case, all required reserves have been provided by MT. So, a part of the MT capacity should be kept for covering renewable generation uncertainty. Also, for arranging spinning reserve during hours 1-8, 23 and 24, the MT is forced to be turned on in its minimum power output to be ready (stand-by) to deliver spinning reserve.
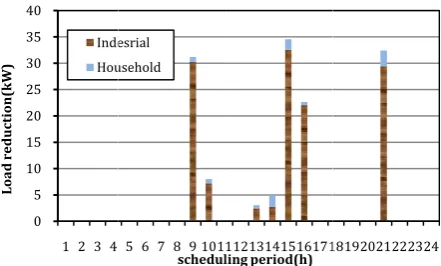
The results of energy and reserve scheduling in the second case has been shown in Figs. 5-8. As shown in Fig. 5, due to high electricity prices, the imported power from the main gird has been reduced during hours 9-16. As shown in Figs. 6 and 7, during hours 9-16 load reductions and EVs discharging have been scheduled in order to reduce the imported power from the main grid. EVs have been scheduled to be charged during hours 2-7, 18-20, 23 and 24 in which the electricity prices are relatively low. The scheduled reserve capacity in the second case has been illustrated in Fig. 8. Comparing with Fig. 4, the MT capacity has been released to provide energy instead of reserve. Also, EVs and loads have provided the most reserve capacity in the second case.
Moreover response dur higher than d the MEMS i the hourly e the electricit MEMS prefe energy.
Fig. 3 Schedul
Fig. 4 schedul
Fig. 5 Schedul
0 20 40 60 80 100 120 140 160 180
0 1 2
po we r generation (kW) 0 0.5 1 1.5 2 2.5 3 3.5 4 4.5 5
1 2 3
spinning reserve(kW) FC 0 20 40 60 80 100 120 140 160 180 200
0 1 2
po we r generation (kW)
r, the results ring the hour during low en intends to pu lectricity pric ty prices are ers to use all c
led energy in ca
led reserve in ca
led energy in ca
2 3 4 5 6 7 8 9 Sch Main gri MT FC WT PV
3 4 5 6 7 8 9 1 sched
C MT
2 3 4 5 6 7 8 9 Sch
s emphasize t rs with high nergy price ho rchase load c ce is high; in higher than D capacity of DG
ase 1. ase 1. ase 2. 10111213141516 heduling period ( d 101112131415161 duling period (h) 9 1011121314151 heduling period (h Main grid MT FC WT PV
that the dem energy price ours. That me curtailment w some hours t DGs offer pr Gs for deliver
617181920212223 (h) 17181920212223 161718192021222 h) mand e is eans when that rice, ring Fig Fig Fig cas cha par tot 24 24 2324 Load reduction(kW ) ‐ ‐ Pow er (kW ) Reser ve( kW)
g. 6 Scheduled l
g. 7 Charge/disc
g. 8 Scheduled r
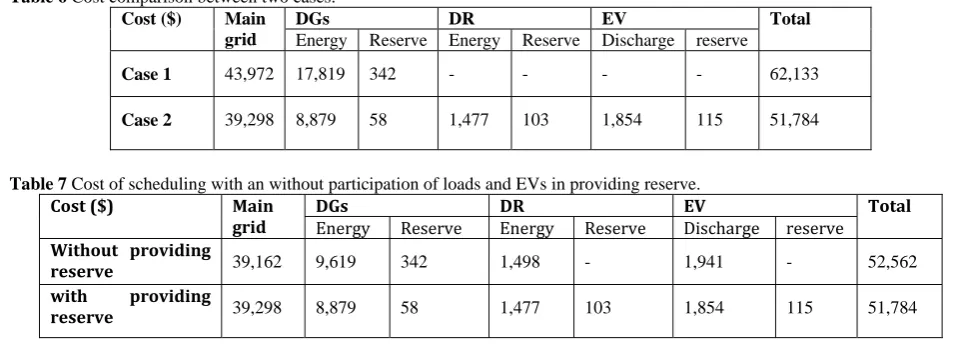
Table 6 com ses 1 and arge/discharge rticipation in e al operation c
0 5 10 15 20 25 30 35 40
1 2 3 4
Load reduction(kW ) Inde Hou 120 100 ‐80 ‐60 ‐40 ‐20 0 20 40 60 80 100 120
1 2 3 4
() 0 1 2 3 4 5 6 7
1 2 3 4
ese ve( W) MT Ind ho EV
load reduction i
charge program
reserve in case
mpares the ope 2. The resu e program a energy and re cost of MG.
5 6 7 8 9 101 schedul esrial
usehold
5 6 7 8 9 10111
schedu positive: Disch
5 6 7 8 9 1011 scheduli T
dustrial ousehold V
in case 2.
m of EVs in case
2.
erational cost ult evidence as well as eserve has bee 11213141516171 ling period(h)
12131415161718
uling period (h) harge, Negative: Ch
11213141516171 ing period (h)
e 2.
of MG in the ed that EVs demand side en reduced the 18192021222324 8192021222324 harge 18192021222324 e s e e
Table 6 Cost comparison between two cases.
Cost ($) Main grid
DGs DR EV Total
Energy Reserve Energy Reserve Discharge reserve
Case 1 43,972 17,819 342 - - - - 62,133
Case 2 39,298 8,879 58 1,477 103 1,854 115 51,784
Table 7 Cost of scheduling with an without participation of loads and EVs in providing reserve.
Cost ($) Main
grid DGsEnergy Reserve DREnergy Reserve EVDischarge reserve Total Without providing
reserve 39,162 9,619 342 1,498 - 1,941 - 52,562
with providing
reserve 39,298 8,879 58 1,477 103 1,854 115 51,784
In order to evaluate the effect of loads and EVs participation in providing the reserve capacity, the energy and reserve scheduling has been carried out with and without considering DR and EVs participation in reserve scheduling. The result of the comparison has been shown in Table 7. As shown in Table 7, while the loads and EVs have not been allowed to participate in reserve scheduling, all reserve requirement have been provided by DGs. In this case, a part of DGs capacity should be allocated to reserve and, as a result, they lose the opportunity to provide energy in during the hours when the electricity prices are high. Moreover, due to providing reserve capacity, the MT should be keep turn-on in all hours in order to be in stand-by to provide reserve. It has also increased the total operation cost. The results evidenced that the participation of demand side and EVs in providing reserve reduced the total operation cost of MG. On the other hand, while the EVs and loads are taken into account in reserve scheduling, the DGs capacity will be released in order to provide energy. So, the total operation cost reduced.
5 Conclusion
A novel integrated DERs scheduling approach for a MG was proposed in this paper. This approach allows responsive loads and EVs owners to participate in both energy and reserve operational scheduling. Demand bidding/buyback programs, ancillary service market program and direct load control are considered as demand response programs. The results evidenced that participating of loads and EVs in energy and reserve operational planning reduced total operational cost of MG. In addition, the renewable uncertainty will also be covered by reserve scheduling through the operational planning program.
References
[1] F. Katiraei, R. Iravani, N. Hatziargyriou, and A. Dimeas, “Microgrids management”, IEEE Power Energy Magazine, Vol. 6, No. 3, pp. 54-65, May 2008.
[2] A. Hajizadeh, “Robust Power Control of Microgrid Based on Hybrid Renewable Power Generation Systems”, Iranian Journal of Electrical & Electronic Engineering, Vol. 9, No. 1, pp. 44-57, Mar. 2013.
[3] Office of Electricity Delivery and Energy Reliability, U.S. Department of Energy, “The smart grid: An introduction”, 2010 [Online]. Available: http://www.oe.energy.gov/1165.htm. [4] K. Clement-Nyns, E. Haesen and J. Driesen, “The
impact of charging plug-in hybrid electric vehicles on a residential distribution grid”, IEEE Transaction on Power System, Vol. 25, No. 1, pp. 371-380, Feb. 2010.
[5] A. Zakariazadeh, S. Jadid and P. Siano, “Multi-objective scheduling of electric vehicles in smart distribution system”, Energy Conversion and Management, Vol. 79, pp. 43-53, Mar. 2014. [6] Z. Fan, “A distributed demand response algorithm
and its application to PHEV charging in smart grids”, IEEE Trans. Smart Grid, Vol. 3, No. 3, pp. 1280-1290, Sep. 2012.
[7] C. Yijia, T. Shengwei, L. Canbing, Z. Peng, T. Yi, Z. Zhikun and L. Junxiong, “An optimized EV charging model considering TOU price and SOC curve”, IEEE Transaction on Smart Grid, Vol. 3, No. 1, pp. 388-393, Mar. 2012.
[8] W. Kempton and J. Tomic, “Vehicle-to-grid power fundamentals: Calculating capacity and net revenue”, Journal of Power Sources, Vol. 144, No. 1, pp. 268-279,June 2005.
[9] J. Mitra, M. R. Vallem and S. B. Patra, “A probabilistic search method for optimal resource deployment in a microgrid”, presented at the 9th Int. Conf. Probabilistic Methods Applied to Power Systems, KTH, Stockholm, Sweden, pp. 11-15, Jun. 2006.
[10] A. Tsikalakis and N. Hatziargyriou, “Centralized control for optimizing microgrids operation”, IEEE Trans Energy Convers, Vol. 23, No. 1, pp. 241-248, Mar. 2008.
[11] E. Sortomme and M. A. El-Sharkawi, “Optimal power flow for a system of microgrids with controllable loads and battery storage”, 2009 IEEE/PES Power Systems Conf. and Exposition, pp. 1-5, 2009.
[12] R. Aazami, K. Aflaki and M. R. Haghifam, “A demand response based solution for LMP management in power markets”, International Journal Electric Power Energy System, Vol. 33, pp. 1125-1132, 2011.
[13] E. K. Hart and M. Z. Jacobson, “A Montecarlo approach to generator portfolio planning and carbon emissions assessments of systems with large penetrations of variable renewable”, Renew Energy, Vol. 36, No. 8, pp. 2278-2286, 2011. [14] F. Javed, N. Arshad, F. Wallin, I. Vassileva and
F. Dahlquist, “Forecasting for demand response in smart grids: an analysis on use of anthropologic and structural data and short term multiple loads forecasting”, Applied Energy, Vol. 96, pp. 150-160, 2012.
[15] J. Rojas, C. Monteiro, R. López and J. Agustín, “Optimum residential load management strategy for real time pricing (RTP) demand response programs”, Energy Policy, Vol. 45, pp. 671-679, 2012.
[16] M. Rastegar, M. Firuzabad and F. Aminifar, “Load commitment in a smart home”, Applied Energy, Vol. 96, pp. 45-54, 2012.
[17] H. Arasteh, M. Moghaddam, M. Sheikh-El-Eslami and A. Abdollahi, “Integrating commercial demand response resources with unit commitment”, International Journal Electric Power Energy System, Vol. 5, pp. 153-61, 2013. [18] P. Sreedharan, D. Miller, S. Price and C. Woo,
“Avoided cost estimation and cost effectiveness of permanent load shifting in California”, Applied Energy, Vol. 96, pp. 115-21, 2012.
[19] P. Cappers, A. Mills, C. Goldman, R. Wiser and JH. Eto, “An assessment of the role mass market demand response could play in contributing to the management of variable generation integration issues”, Energy Policy, Vol.48, pp. 420-9, 2012. [20] A. Zakariazadeh, O. Homaee, S. Jadid and P.
Siano, “A new approach for real time voltage control using demand response in an automated distribution system,” Applied Energy, Vol. 114 157-166, Mar. 2014.
[21] D. Choi and V. Thomas, “An electricity generation planning model incorporating demand response”, Energy Policy, Vol. 42, pp.429-441, 2012.
[22] S. Bae and A. Kwasinski, “Dynamic modeling and operation strategy for a microgrid with wind and photovoltaic resources”, IEEE Trans Smart Grid, Vol. 3, pp. 1867-1876, 2012.
[23] S. H. Falsafi, A. Zakariazadeh and S. Jadid, “The role of demand response in single and
multi-objective wind-thermal generation scheduling: A stochastic programming”, Energy, Vol. 64, pp. 853-867, Jan. 2014.
[24] Assessment of demand response and advanced metering, FERC, Staff Report, Docket No. AD06-2, August 7, 2006.
[25] A. Zakariazadeh, S. Jadidand P. Siano, “Economic-environmental energy and reserve scheduling of smart distribution system: A multiobjective mathematical programming approach,” Energy Conversion and Management, Vol. 78, pp. 151-164, Feb. 2014.
[26] P. Soares, H. Morais, T. Sousa, Z. A. Vale and P. Faria, “Day-Ahead resource scheduling including demand response for electric vehicles”, IEEE Transaction on Smart Grid, Vol. 4, pp. 596-605, 2013.
[27] T. Sousa, H. Morais, Z. Vale, P. Fariaand J. Soares, “Intelligent energy resource management considering vehicle-to-Grid: A simulated annealing approach”, IEEE Transaction on Smart Grid, Vol. 3 pp. 535-542, 2012.
[28] A. Y. Saber and G. K. Venayagamoorthy, “Resource scheduling under uncertainty in a smart grid with renewable and plug-in vehicles”, IEEE System Journal, Vol. 6, pp. 103-109, 2012. [29] G. K. Venayagamoorthy, “Dynamic, stochastic,
computational and scalable technologies for smart grids”, IEEE Computation Intelligent Magazine, Vol. 6, pp. 22-35, 2011.
[30] R. J. Yinger, “Behavior of Capstone and Honeywell micro turbine generators during load changes”, Southern California Edison, Tech. Rep. LBNL-49095, Jul. 2001.
[31] J. E. Larmine and A. Dicks, Fuel Cell Systems Explained. 2nd ed. New York, USA: Wiley, 2003.
[32] S. Deilami, A.S. Masoum, P. S. Moses and M. A. S. Masoum, “Real-Time coordination of plug-in electric vehicle charging in smart grids to minimize power losses and improve voltage profile”, IEEE Transaction on Smart Grid, Vol. 2, pp. 456-467, 2011.
[33] Nissan LEAF Electric Car 2010 [Online]. Available: http://www.nissanusa.com/electric-cars/leaf/.
[34] Citroen C-ZERO Electric Vehicles. [Online]. Available: http://www.citroen.com/
.
[35] M. Duvall, E. Knippingand M. Alexander, “Environmental assessment of plug-in hybrid electric vehicles”, EPRI: Nationwide Greenhouse Gas Emissions, Vol. 1, 2007.
[36] J. Dong, M. Xie, L. Zhao and D. Shang, “A framework for electric vehicle charging-point network optimization”, IBM Journal of Research and Development, Vol. 57, pp. 15, 2013.
[37] R. E. Rosenthal, GAMS A User’s Guide, Washington DC., GAMS Development Corporation, 2008.
Alireza Zakariazadeh was born in 1985 in Tehran, Iran. He received the B.Sc. (Honors.) degree in electrical engineering from Babol Noshirvani University of Technology, Babol, in 2007 and M.Sc. (Honors.) degree from Iran University of Science and Technology, Tehran in 2010. Currently, he is pursuing the Ph.D. degree in Iran University of Science and Technology. Since 2012, he has been as an expert in advanced metering infrastructure systems with the Iran Energy Efficiency Organization (IEEO-SABA), Tehran, Iran. His research interests include smart grid, demand response, power system operation, stochastic optimization, and renewable energy.
Shahram Jadid received the Ph.D. degree in 1991 from the Indian Institute of Technology, Bombay, India. He is a Professor in the Department of Electrical Engineering, Iran University of Science and Technology, Tehran, where he is also currently Head of the Green Research Center. His main research interests are power system operation and restructuring, smart grid, load and energy management, and knowledge-based systems.