VOLUME NO.6(2016),ISSUE NO.03(MARCH) ISSN 2231-5756
A Monthly Double-Blind Peer Reviewed (Refereed/Juried) Open Access International e-Journal - Included in the International Serial Directories Indexed & Listed at:
VOLUME NO.6(2016),ISSUE NO.03(MARCH) ISSN 2231-5756
CONTENTS
Sr.
No.
TITLE & NAME OF THE AUTHOR (S)
Page
No.
1
.
IMPACT OF FACEBOOK USAGE ON STUDENT ACADEMIC PERFORMANCE: THE CASE OF WOLLEGE
UNIVERSITY
V.P.S. ARORA & SARFARAZ KARIM
1
2
.
A STUDY ON THE IMPACT OF EMOTIONAL INTELLIGENCE ON QUALITY OF WORK LIFE AMONG WOMEN
EMPLOYEES OF ITES COMPANIES WITH SPECIAL REFERENCE TO SELECTED COMPANIES IN COIMBATORE
DISTRICT
DR. S. GANESAN & SUKANYA.L
7
3
.
IMPACT OF VILLAGE INFRASTRUCTURE INITIATED BY KORBA COALFIELDS OF CHHATTISGARH (INDIA) ON
VILLAGERS’ WAY OF LIVING
A S BABU & SUKANTA CHANDRA SWAIN
11
4
.
REVENUE MANAGEMENT: A CASE STUDY OF BHARAT SANCHAR NIGAM LIMITED
DR. U. PADMAVATHI
18
5
.
DIGITAL MARKETING – WAY TO SIGNIFICANCE
SEMILA FERNANDES & VIDYASAGAR A.
22
6
.
PERFORMANCE MANAGEMENT IN SUGAR INDUSTRIES
M. SARADADEVI & K. YASODA
28
7
.
FOREIGN DIRECT INVESTMENT INFLOWS, TECHNOLOGICAL INNOVATION, SUSTAINABLE DEVELOPMENT
AND SKILLED HUMAN BEHAVIOR: A MULTIVARIATE GRANGER CAUSALITY STUDY – EVIDENCE FROM
FRANCE
DR. BHUMIKA GUPTA & DR. JASMEET KAUR
32
8
.
CONSTRUCTION OF INTER QUARTILE RANGE (IQR) CONTROL CHART USING PROCESS CAPABILITY FOR
STANDARD DEVIATION
DR. C. NANTHAKUMAR & S.VIJAYALAKSHMI
35
9
.
EQUITY SHARE PERFORMANCE OF AUTO MOBILE INDUSTRY IN BSE
M. NIRMALA & P. PAVITHRA
39
10
.
TURN OF THE MONTH EFFECT IN INDIAN METAL SECTOR WITH SPECIAL REFERENCE TO BSE METAL INDEX
J. SUDARVEL & DR. R. VELMURUGAN
43
11
.
ROLE OF MAHILA SAHKARI BANK IN WOMEN EMPOWERMENT
DR. R. P. AGRAWAL & AJITA SAJITH
46
12
.
STRESS AMONG IT SECTOR EMPLOYEES
SABARI GHOSH
49
13
.
MOBILE BANKING IN INDIA: A COMPARATIVE STUDY ON HDFC BANK AND AXIS BANK
N. NEERAJA
54
14
.
LEADERSHIP REQUIREMENTS TO MANAGE GLOBAL BUSINESS
DEEPA NATHWANI
58
15
.
A STUDY ON EMOTIONAL INTELLIGENCE AMONG TEACHERS IN PRIVATE SCHOOLS OF DINDIGUL DISTRICT
DR. R. RADHIKA DEVI & SOUNDARYA.N.
63
16
.
A STUDY ON CONSUMERS OPINION TOWARDS ECO-FRIENDLY PRODUCTS WITH SPECIAL REFERENCE TO
COIMBATORE CITY
NITHYA M & T. RAHUL PRASATH
67
17
.
AN EVALUATION OF SERVICES BY DOCTORS PROVIDED BY PHARMACEUTICAL COMPANIES
MENKA TRIPATHI & DR. PRATIBHA JAIN
74
18
.
OPPORTUNITIES AND CHALLENGES TO TOURISM INDUSTRY: A CASE STUDY OF JAMMU AND KASHMIR
MUNEER A KHAN, SHAHNEYAZ A BHAT, SUHAIL A BHAT & MUDASIR AHMAD WAR
79
19
.
PERCEPTION OF STUDENT TOWARDS FATE AND LOCUS OF CONTROL AT HIGHER SECONDARY LEVEL: A
STUDY IN PERCEPTION
P. THANGARAJU
83
20
.
SOCIO ECONOMIC CONDITIONS OF HANDLOOM WEAVERS: A STUDY OF KARIMNAGAR DISTRICT
ANKAM SREENIVAS & KALAKOTLA SUMAN
85
VOLUME NO.6(2016),ISSUE NO.03(MARCH) ISSN 2231-5756
CHIEF PATRON
PROF. K. K. AGGARWAL
Chairman, Malaviya National Institute of Technology, Jaipur
(An institute of National Importance & fully funded by Ministry of Human Resource Development, Government of India)
Chancellor, K. R. Mangalam University, Gurgaon
Chancellor, Lingaya’s University, Faridabad
Founder Vice-Chancellor (1998-2008), Guru Gobind Singh Indraprastha University, Delhi
Ex. Pro Vice-Chancellor, Guru Jambheshwar University, Hisar
FOUNDER PATRON
LATE SH. RAM BHAJAN AGGARWAL
Former State Minister for Home & Tourism, Government of Haryana
Former Vice-President, Dadri Education Society, Charkhi Dadri
Former President, Chinar Syntex Ltd. (Textile Mills), Bhiwani
FORMER CO-ORDINATOR
DR. S. GARG
Faculty, Shree Ram Institute of Business & Management, Urjani
ADVISORS
PROF. M. S. SENAM RAJU
Director A. C. D., School of Management Studies, I.G.N.O.U., New Delhi
PROF. M. N. SHARMA
Chairman, M.B.A., Haryana College of Technology & Management, Kaithal
PROF. S. L. MAHANDRU
Principal (Retd.), Maharaja Agrasen College, Jagadhri
EDITOR
PROF. R. K. SHARMA
Professor, Bharti Vidyapeeth University Institute of Management & Research, New Delhi
CO-EDITOR
DR. BHAVET
Faculty, Shree Ram Institute of Engineering & Technology, Urjani
EDITORIAL ADVISORY BOARD
DR. RAJESH MODI
Faculty, Yanbu Industrial College, Kingdom of Saudi Arabia
PROF. SANJIV MITTAL
University School of Management Studies, Guru Gobind Singh I. P. University, Delhi
PROF. ANIL K. SAINI
Chairperson (CRC), Guru Gobind Singh I. P. University, Delhi
DR. SAMBHAVNA
VOLUME NO.6(2016),ISSUE NO.03(MARCH) ISSN 2231-5756
DR. MOHENDER KUMAR GUPTA
Associate Professor, P. J. L. N. Government College, Faridabad
DR. SHIVAKUMAR DEENE
Asst. Professor, Dept. of Commerce, School of Business Studies, Central University of Karnataka, Gulbarga
ASSOCIATE EDITORS
PROF. NAWAB ALI KHAN
Department of Commerce, Aligarh Muslim University, Aligarh, U.P.
PROF. ABHAY BANSAL
Head, Department of I.T., Amity School of Engineering & Technology, Amity University, Noida
PROF. A. SURYANARAYANA
Department of Business Management, Osmania University, Hyderabad
PROF. V. SELVAM
SSL, VIT University, Vellore
DR. PARDEEP AHLAWAT
Associate Professor, Institute of Management Studies & Research, Maharshi Dayanand University, Rohtak
DR. S. TABASSUM SULTANA
Associate Professor, Department of Business Management, Matrusri Institute of P.G. Studies, Hyderabad
SURJEET SINGH
Asst. Professor, Department of Computer Science, G. M. N. (P.G.) College, Ambala Cantt.
FORMER TECHNICAL ADVISOR
AMITA
Faculty, Government M. S., Mohali
FINANCIAL ADVISORS
DICKIN GOYAL
Advocate & Tax Adviser, Panchkula
NEENA
Investment Consultant, Chambaghat, Solan, Himachal Pradesh
LEGAL ADVISORS
JITENDER S. CHAHAL
Advocate, Punjab & Haryana High Court, Chandigarh U.T.
CHANDER BHUSHAN SHARMA
Advocate & Consultant, District Courts, Yamunanagar at Jagadhri
VOLUME NO.6(2016),ISSUE NO.03(MARCH) ISSN 2231-5756
CALL FOR MANUSCRIPTS
We invite unpublished novel, original, empirical and high quality research work pertaining to recent developments & practices in the areas of Computer Science & Applications; Commerce; Business; Finance; Marketing; Human Resource Management; General Management; Banking; Economics; Tourism Administration & Management; Education; Law; Library & Information Science; Defence & Strategic Studies; Electronic Science; Corporate Governance; Industrial Relations; and emerging paradigms in allied subjects like Accounting; Accounting Information Systems; Accounting Theory & Practice; Auditing; Behavioral Accounting; Behavioral Economics; Corporate Finance; Cost Accounting; Econometrics; Economic Development; Economic History; Financial Institutions & Markets; Financial Services; Fiscal Policy; Government & Non Profit Accounting; Industrial Organization; International Economics & Trade; International Finance; Macro Economics; Micro Economics; Rural Economics; Co-operation; Demography: Development Planning; Development Studies; Applied Economics; Development Economics; Business Economics; Monetary Policy; Public Policy Economics; Real Estate; Regional Economics; Political Science; Continuing Education; Labour Welfare; Philosophy; Psychology; Sociology; Tax Accounting; Advertising & Promotion Management; Management Information Systems (MIS); Business Law; Public Responsibility & Ethics; Communication; Direct Marketing; E-Commerce; Global Business; Health Care Administration; Labour Relations & Human Resource Management; Marketing Research; Marketing Theory & Applications; Non-Profit Organizations; Office Administration/Management; Operations Research/Statistics; Organizational Behavior & Theory; Organizational Development; Production/Operations; International Relations; Human Rights & Duties; Public Administration; Population Studies; Purchasing/Materials Management; Retailing; Sales/Selling; Services; Small Business Entrepreneurship; Strategic Management Policy; Technology/Innovation; Tourism & Hospitality; Transportation Distribution; Algorithms; Artificial Intelligence; Compilers & Translation; Computer Aided Design (CAD); Computer Aided Manufacturing; Computer Graphics; Computer Organization & Architecture; Database Structures & Systems; Discrete Structures; Internet; Management Information Systems; Modeling & Simulation; Neural Systems/Neural Networks; Numerical Analysis/Scientific Computing; Object Oriented Programming; Operating Systems; Programming Languages; Robotics; Symbolic & Formal Logic; Web Design and emerging paradigms in allied subjects.
Anybody can submit the soft copy of unpublished novel; original; empirical and high quality research work/manuscriptanytime in M.S. Word format
after preparing the same as per our GUIDELINES FOR SUBMISSION; at our email address i.e. [email protected] or online by clicking the link online submission as given on our website (FOR ONLINE SUBMISSION, CLICK HERE).
GUIDELINES FOR SUBMISSION OF MANUSCRIPT
1. COVERING LETTER FOR SUBMISSION:
DATED: _____________
THE EDITOR
IJRCM
Subject: SUBMISSION OF MANUSCRIPT IN THE AREA OF .
(e.g. Finance/Mkt./HRM/General Mgt./Engineering/Economics/Computer/IT/ Education/Psychology/Law/Math/other, please specify)
DEAR SIR/MADAM
Please find my submission of manuscript entitled ‘___________________________________________’ for possible publication in one of your journals.
I hereby affirm that the contents of this manuscript are original. Furthermore, it has neither been published elsewhere in any language fully or partly, nor is it under review for publication elsewhere.
I affirm that all the co-authors of this manuscript have seen the submitted version of the manuscript and have agreed to their inclusion of names as co-authors.
Also, if my/our manuscript is accepted, I agree to comply with the formalities as given on the website of the journal. The Journal has discretion to publish our contribution in any of its journals.
NAME OF CORRESPONDING AUTHOR :
Designation :
Institution/College/University with full address & Pin Code :
Residential address with Pin Code :
Mobile Number (s) with country ISD code :
Is WhatsApp or Viber active on your above noted Mobile Number (Yes/No) :
Landline Number (s) with country ISD code :
E-mail Address :
Alternate E-mail Address :
VOLUME NO.6(2016),ISSUE NO.03(MARCH) ISSN 2231-5756
NOTES:
a) The whole manuscript has to be in ONE MS WORD FILE only, which will start from the covering letter, inside the manuscript. pdf. version is liable to be rejected without any consideration.
b) The sender is required to mention the following in the SUBJECT COLUMNof the mail:
New Manuscript for Review in the area of (e.g. Finance/Marketing/HRM/General Mgt./Engineering/Economics/Computer/IT/ Education/Psychology/Law/Math/other, please specify)
c) There is no need to give any text in the body of mail, except the cases where the author wishes to give any specific message w.r.t. to the manuscript.
d) The total size of the file containing the manuscript is expected to be below 1000 KB.
e) Abstract alone will not be considered for review and the author is required to submit the complete manuscript in the first instance.
f) The journal gives acknowledgement w.r.t. the receipt of every email within twenty four hours and in case of non-receipt of acknowledgment from the journal, w.r.t. the submission of manuscript, within two days of submission, the corresponding author is required to demand for the same by sending a separate mail to the journal.
g) The author (s) name or details should not appear anywhere on the body of the manuscript, except the covering letter and the cover page of the manuscript, in the manner as mentioned in the guidelines.
2. MANUSCRIPT TITLE: The title of the paper should be bold typed, centeredand fully capitalised.
3. AUTHOR NAME (S) & AFFILIATIONS: Author (s) name, designation, affiliation (s), address, mobile/landline number (s), and
email/alternate email address should be given underneath the title.
4. ACKNOWLEDGMENTS: Acknowledgements can be given to reviewers, guides, funding institutions, etc., if any.
5. ABSTRACT: Abstract should be in fully italicized text, ranging between 150 to 300 words. The abstract must be informative and explain the background, aims, methods, results & conclusion in a SINGLE PARA. Abbreviations must be mentioned in full.
6. KEYWORDS: Abstract must be followed by a list of keywords, subject to the maximum of five. These should be arranged in alphabetic order separated by commas and full stop at the end. All words of the keywords, including the first one should be in small letters, except special words e.g. name of the Countries, abbreviations.
7. JEL CODE: Provide the appropriate Journal of Economic Literature Classification System code (s). JEL codes are available at www.aeaweb.org/econlit/jelCodes.php, however, mentioning JEL Code is not mandatory.
8. MANUSCRIPT: Manuscript must be in BRITISH ENGLISH prepared on a standard A4 size PORTRAIT SETTING PAPER. It should be free from any errors i.e. grammatical, spelling or punctuation. It must be thoroughly edited at your end.
9. HEADINGS: All the headings must be bold-faced, aligned left and fully capitalised. Leave a blank line before each heading. 10. SUB-HEADINGS: All the sub-headings must be bold-faced, aligned left and fully capitalised.
11. MAIN TEXT:
THE MAIN TEXT SHOULD FOLLOW THE FOLLOWING SEQUENCE:
INTRODUCTION
REVIEW OF LITERATURE
NEED/IMPORTANCE OF THE STUDY
STATEMENT OF THE PROBLEM
OBJECTIVES
HYPOTHESIS (ES)
RESEARCH METHODOLOGY
RESULTS & DISCUSSION
FINDINGS
RECOMMENDATIONS/SUGGESTIONS
CONCLUSIONS
LIMITATIONS
SCOPE FOR FURTHER RESEARCH
REFERENCES
APPENDIX/ANNEXURE
VOLUME NO.6(2016),ISSUE NO.03(MARCH) ISSN 2231-5756
12. FIGURES & TABLES: These should be simple, crystal CLEAR, centered, separately numbered & self explained, and titles must be above the table/figure. Sources of data should be mentioned below the table/figure. It should be ensured that the tables/figures are referred to from the main text.
13. EQUATIONS/FORMULAE: These should be consecutively numbered in parenthesis, horizontally centered with equation/formulae number placed at the right. The equation editor provided with standard versions of Microsoft Word should be utilised. If any other equation editor is utilised, author must confirm that these equations may be viewed and edited in versions of Microsoft Office that does not have the editor.
14. ACRONYMS: These should not be used in the abstract. The use of acronyms is elsewhere is acceptable. Acronyms should be defined on its first use in each section: Reserve Bank of India (RBI). Acronyms should be redefined on first use in subsequent sections.
15. REFERENCES: The list of all references should be alphabetically arranged. The author (s) should mention only the actually utilised references in the preparation of manuscript and they are supposed to follow Harvard Style of Referencing. Also check to make sure that everything that you are including in the reference section is duly cited in the paper. The author (s) are supposed to follow the references as per the following:
• All works cited in the text (including sources for tables and figures) should be listed alphabetically.
• Use (ed.) for one editor, and (ed.s) for multiple editors.
• When listing two or more works by one author, use --- (20xx), such as after Kohl (1997), use --- (2001), etc, in chronologically ascending order.
• Indicate (opening and closing) page numbers for articles in journals and for chapters in books.
• The title of books and journals should be in italics. Double quotation marks are used for titles of journal articles, book chapters, dissertations, reports, working papers, unpublished material, etc.
• For titles in a language other than English, provide an English translation in parenthesis.
• Headers, footers, endnotes and footnotes should not be used in the document. However, you can mention short notes to elucidate some specific point, which may be placed in number orders after the references.
PLEASE USE THE FOLLOWING FOR STYLE AND PUNCTUATION IN REFERENCES:
BOOKS
• Bowersox, Donald J., Closs, David J., (1996), "Logistical Management." Tata McGraw, Hill, New Delhi.
• Hunker, H.L. and A.J. Wright (1963), "Factors of Industrial Location in Ohio" Ohio State University, Nigeria.
CONTRIBUTIONS TO BOOKS
• Sharma T., Kwatra, G. (2008) Effectiveness of Social Advertising: A Study of Selected Campaigns, Corporate Social Responsibility, Edited by David Crowther & Nicholas Capaldi, Ashgate Research Companion to Corporate Social Responsibility, Chapter 15, pp 287-303.
JOURNAL AND OTHER ARTICLES
• Schemenner, R.W., Huber, J.C. and Cook, R.L. (1987), "Geographic Differences and the Location of New Manufacturing Facilities," Journal of Urban Economics, Vol. 21, No. 1, pp. 83-104.
CONFERENCE PAPERS
• Garg, Sambhav (2011): "Business Ethics" Paper presented at the Annual International Conference for the All India Management Association, New Delhi, India, 19–23
UNPUBLISHED DISSERTATIONS
• Kumar S. (2011): "Customer Value: A Comparative Study of Rural and Urban Customers," Thesis, Kurukshetra University, Kurukshetra.
ONLINE RESOURCES
• Always indicate the date that the source was accessed, as online resources are frequently updated or removed.
WEBSITES
VOLUME NO.6(2016),ISSUE NO.03(MARCH) ISSN 2231-5756
CONSTRUCTION OF INTER QUARTILE RANGE (IQR) CONTROL CHART USING PROCESS CAPABILITY FOR
STANDARD DEVIATION
DR. C. NANTHAKUMAR
ASSOCIATE PROFESSOR
DEPARTMENT OF STATISTICS
SALEM SOWDESWARI COLLEGE
SALEM
S. VIJAYALAKSHMI
HEAD
DEPARTMENT OF MATHEMATICS & STATISTICS
AVS ARTS & SCIENCE COLLEGE
SALEM
ABSTRACT
Any course of action examine by control charts is a quite popular practice in statistical process control. In this research article a new control chart based on robust IQR using process capability for standard deviation is proposed instead of Shewhart chart for standard deviation when the underlying normality assumption is not met and it enables easier detection of outliers. Furthermore, the performances of these charts compared based on numerical examples under the assumptions of normal and exponential distributions. The proposed robust control chart using IQR shows to a better performance than the Shewhart control chart for standard deviation with moderate sample sizes.
KEYWORDS
control chart, control limit interval, interquartile range and process capability.
I. INTRODUCTION
tatistical process control has been used to great effect in the manufacturing industry to increase productivity in processes by specifically identifying and reducing variation (Deming, 1982). In such a way that the variation fluctuates in a natural or expected manner, a stable pattern of many chance causes of variation develops. Chance causes of variation are inevitable. When an assignable cause of variation is present, the variation will be excessive, and the process is classified as out of control or beyond the expected natural variation. Determination of the common or assignable causes of variation in control chart is possible with the use of control limits. Shewhart (1931) control chart which is one of the most widely used statistical process control technique developed under the normality to monitor the process in order to control the process variability. In this research article a new control chart based on robust IQR using process capability for standard deviation is proposed instead of Shewhart (1931) chart for standard deviation when the underlying normality assumption is not met and shows to a better performance than the Shewhart control chart for mean using range.
A. Robust methods
This is one of the most commonly used statistical methods when the underlying normality assumption is violated. These methods offer useful and viable alternative to the traditional statistical methods and can provide more accurate results, often yielding greater statistical power and increased sensitivity and yet still be efficient if the normal assumption is correct (Moustafa Omar Ahmed Abu-Shawiesh, 2008). The standard deviation measures spread about the mean. Therefore, it is not practical to calculate the standard deviation when using the median as the measure of central tendency. Other statistics may be more useful when calculating the spread about the median. One statistic that is often used to measure the spread is to calculate the range. The range is found by subtracting the smallest value in the sample, y1, from the largest value, yn. The problem with the range is that it shares the worst properties of the mean and the median. Like the
mean, it is not resistant. Any outlier in any direction will significantly influence the value of the range. Like the median, it ignores the numerical values of most of the data. That is not to say that the range does not provide any useful information and it is a relatively easy statistic to compute. In order to avoid the problem of dealing with the outliers, however, we can calculate a different measure of dispersion called the interquartile range (IQR). The interquartile range can be found by subtracting the first quartile value (q1) from the third quartile value (q3). For a sample of observations, we define q1 to be the order statistic below which 25% of
the data lies. Similarly, q3 is defined to be the order statistic, below which 75% of the data lies.
The population IQR for a continuous distribution is defined to be IQR=Q3-Q1, where Q3 and Q1 are found by solving the following integrals 0.75 =
f x dx and 0.25 = f x dx . The function f(x) is continuous over the support of X that satisfies the two properties, (i) f x ≥ 0 and f x dx = 1.
B. Terms and concepts a. Upper specification limit (USL)
It is the greatest amount specified by the producer for a process or product to have the acceptable performance.
b. Lower specification limit (LSL)
It is the smallest amount specified by the producer for a process or product to have the acceptable performance.
c. Tolerance level (TL)
It is a statistical interval within which, with some confidence level, a specified proportion of a sampled population falls. It is the difference between USL and LSL, TL = USL-LSL
d. Process capability (CP)
Process capability compares the output of an in-control process to the specification limits by using capability indices. The comparison is made by forming the ratio of the spread between the process specifications to the spread of the process values, as measured by 6 process standard deviation units.i. e. C =
σ= σ .
e. Interquartile range (IQR)
The interquartile range (IQR) is a measure of variability, based on dividing a data set into quartiles. These quartiles divide a rank-ordered data set into four equal parts. The values that divide each part are called the first, second, and third quartiles; and they are denoted by Q1, Q2, and Q3, respectively.
• Q1 is the "middle" value in the first half of the rank-ordered data set
• Q2 is the median value in the set
• Q3 is the "middle" value in the second half of the rank-ordered data set
The interquartile range is equal to Q3 minus Q1.
VOLUME NO.6(2016),ISSUE NO.03(MARCH) ISSN 2231-5756
f. Robust quality control constant
The quality control constant σ !"introduced in this research article to determine the robust control limits based on IQR using process capability for standard deviation chart.
II. CONSTRUCTION OF IQR CONTROL CHART USING PROCESS CAPABILITY FOR STANDARD DEVIATION
In this division a method to build an IQR control chart using process capability for standard deviation and suitable Table – A (APPENDIX I) is also obtained and presented for the companies to take quick decisions. Fix the tolerance level (TL) and process capability (C) to find out the process standard deviationσ
!".
Apply the value of σ !" in the control limits c$σ "!± &'3)1 − c$+,σ "!-, to get the robust control limits using process capability for standard deviation (Radhakrishnan et al., 2011), where σ !" is replaced instead of σ from the Shewhart 3-Sigma.
The quality control constant σ !" is coined by the control limits of Inter quartile range (IQR) in the course of “z-score” that corresponds to the areas under the normal curve of 0.25 and 0.75 respectively. Thus we have Q3=0.6745+µ and Q1=-0.6745+µ implies that IQRnorm≈1.3490σ because of the central limit theorem
motivates the use of the normal distribution f x =σ.
√+01 23 4 5
σ 6
+
, −∞ < : < ∞.
III. ASSUMPTIONS FOR THE STUDY
• Production managers involved in the study will be willing and able to learn the principles of evaluating control charts
• Production managers involved in the study will have adequate knowledge and experience to make adjustments to an activity to improve the productivity of a process based on the data conveyed in the control charts
• The activities to be studied will feature crews comprised of the same labourers and operators during the pre-intervention and intervention periods
IV. CONDITIONS FOR APPLICATION
• Robust control limits will be used if the data is found to be non-normal
• Companies adopt the concept of IQR using process capability in its processes
V. DETERMINATION OF CONTROL CHARTS
The example provided by Acheson J. Duncan (1958, Page No. 303) is considered here. The following data are measurements of inside diameters. The measurements are taken in sample groups of 5 each.
TABLE 1: MEASUREMENTS OF INSIDE DIAMETERS Sample x1 x2 x3 x4 x5 S ;<=>?
1 15 11 8 15 6 4.06 5.19 2 14 16 11 14 7 3.51 2.22 3 13 6 9 5 10 3.21 2.97 4 15 15 9 15 7 3.90 4.45 5 9 12 9 8 8 1.64 0.74 6 11 14 11 12 5 3.36 0.74 7 13 12 9 6 10 2.74 2.22 8 10 15 12 4 6 4.45 4.45 9 8 12 14 9 10 2.41 2.22 10 10 10 9 14 14 2.41 2.97 11 13 16 12 15 18 2.39 2.22 12 7 10 9 11 16 3.36 1.48 13 11 7 16 10 14 3.51 2.97 14 11 7 10 10 7 1.87 2.22 15 13 9 12 13 17 2.86 0.74 16 17 10 11 9 8 3.54 1.48 17 4 14 5 11 11 4.30 4.45 18 8 9 6 13 9 2.55 0.74 19 9 10 7 10 13 2.17 0.74 20 15 10 12 12 16 2.45 2.22
SA = 3.03 IQRAAAAAAA = 2.37EF
A. Shewhart control chart for standard deviation
The 3σ control limits suggested by Shewhart (1931) are SA ± &'3)1 − c$+, 3A
GH
6-UCL = SA + &'3)1 − c$+,3GAH6-= 3.03+ &'3)1 − 0.94+,3N.ONO.P$6- = 6.33
CL = SA = 3.03
LCL = SA − RS3T1 − c$+U VcSA
$WX = 3.03 − Y'3)1 − 0.94
+,Z3.03
0.94[\ = −0.27
However, the control limit interval hereafter refers to as CLI, is the difference between the control limits value. Therefore, for the IQR control chart for standard deviation, the control limit interval will be determined using the expression:
CLI]= S6T1 − c$+UVcSA
$W = '6)1 − 0.94
+, 3.03/0.94 = 6.60
From the result, it is clear that the process is in control, since the entire sample numbers lie inside the control limits and the control limit interval is 6.60 for n=5.
B. Inter quartile range (IQR) control chart for standard deviation
The 3σ control limits based on IQR are c$IQRAAAAAAA ± &'3)1 − cEF $+, _IQRAAAAAAA`-EF
UCL. ab= c$IQRAAAAAAA + RS3T1 − cEF $+U_IQRAAAAAAA`X = 0.94 × 2.37 + &'3)1 − 0.94EF + , 2.37 - = 4.65
CL. ab= c$IQRAAAAAAA = 0.94 × 2.37 = 2.23EF
VOLUME NO.6(2016),ISSUE NO.03(MARCH) ISSN 2231-5756
However, the control limit interval hereafter refers to as CLI, is the difference between the control limits value. Therefore, the IQR control chart for standard deviation, the control limit interval will be determined using the expression:
CLI. ab= S6T1 − c$+U _IQRAAAAAAA` = '6)1 − 0.94EF +, 2.37 = 4.85
From the result, it is clear that the process is in control, since the entire sample numbers lie inside the control limits and the control limit interval is 4.85 for n=5.
C. Proposed inter quartile range (IQR) control chart using process capability for standard deviation
Difference between upper specification and lower specification limits is 4.45 (USL - LSL = 5.19 – 0.74), which termed as tolerance level (TL) and choose the process capability (Cp) is 2.0, it is found from the Table - A (APPENDIX I) that the value of σ !" is 0.37. The control limits of inter quartile range (IQR) using process capability for standard deviation, a specified tolerance level with the control limitsc$σ "!± &'3)1 − c$+,σ "!
-UCL. !"= c$σ "!+ RS3T1 − c$+Uσ "!X = 0.94 × 0.37 + &'3)1 − 0.94+, × 0.37- = 0.73
CL. !"= c$σ "!= 0.94 × 0.37 = 0.35
LCL. !"= c$σ "!− RS3T1 − c$+Uσ "!X = 0.94 × 0.37 − &'3)1 − 0.94+, × 0.37- = −0.03
However, the control limit interval hereafter refers to as CLI, is the difference between the control limits value. Therefore, the IQR control chart using process capability for standard deviation, the control limit interval will be determined using the expression:
CLI. !"= S6T1 − c$+Uσ "!= '6)1 − 0.94+, × 0.37 = 0.76
From the result, it is clear that the process is out of control, since the entire sample numbers lie outside the control limits and the control limit interval is 0.76 for n=5.
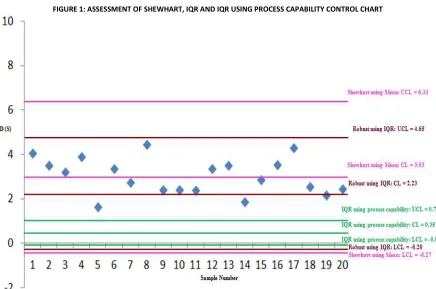
TABLE 2: ASSESSMENT OF SHEWHART, IQR AND IQR USING PROCESS CAPABILITY CONTROL CHARTS Control limits Shewhart control chart IQR IQR using process capability
LCL -0.27 -0.20 -0.03 CL 3.03 2.23 0.35 UCL 6.33 4.65 0.73 CLIs 6.60 4.85 0.76
FIGURE 1: ASSESSMENT OF SHEWHART, IQR AND IQR USING PROCESS CAPABILITY CONTROL CHART
It is found from the Figures 1 that the process is in control when the control limits of Shewhart 3 – Sigma and IQR are adopted and also the process is out of control when the control limits of IQR using process capability are used. The control limits interval of IQR using process capability is smaller than the control limits interval of Shewhart and IQR. It is clear that the product/service is not in good quality as expected, accordingly a modification and improvement is needed in the process/system.
VI. CONCLUSION
VOLUME NO.6(2016),ISSUE NO.03(MARCH) ISSN 2231-5756
REFERENCES
1. Acheson j. Duncan, ‘Quality Control and Industrial Statistics’, Richard D. Irwin, Inc. Homewood, Illinois (sixth printing), pp. 280-282. 1958.
2. B.C. Michael Khoo and S.Y. Sim, “A Robust Exponentially Weighted Moving Average Control Chart for the Process Mean”, Journal of Modern Applied Statistical Methods, Vol. 5, No. 2, 2006, pp.464-474.
3. Deming, W. Edwards, “Quality, Productivity, and Competitive Position”, MIT Center for Advanced Engineering Study (CAES), Cambridge, Mass, 1982. 4. Dewey L. Whaley III, “The Interquartile Range: Theory and Estimation”, School of graduate studies, East Tennessee State University, United states, 2005. 5. Moustafa Omar Ahmed Abu-Shawiesh, “A Simple Robust Control Chart Based on MAD”, Journal of Mathematics and Statistics 4 (2): 2008, pp.102- 107. 6. Nuri Celik, “Control Charts Based on Robust Scale Estimators”, American Research Journal of Mathematics, Volume 1, Issue 1, 2015.
7. R. Radhakrishnan and P. Balamurugan, “Construction of control charts based on six sigma Initiatives for Fraction Defectives with varying sample size”, Journal of Statistics & Management Systems (JSMS), Volume 15, Issue 4-5, 2012, pp. 405-413.
8. W.A. Shewhart, “Economic Control of Quality of Manufactured Product”, Van Nostrand, New York, 1931.
WEBSITE
9. http://www.mathwave.com/
APPENDIX
TABLE- A: σ=efVALUES FOR A SPECIFIED Cp AND TL TL
Cp 0.0001 0.0002 …. 0.001 0.002 …. 1 2 …. 50 100 200 1 0 0 …. 0.0002 0.0003 …. 0.17 0.33 …. 8.33 16.67 33.33
1.1 0 0 …. 0.0002 0.0003 …. 0.15 0.30 …. 7.58 15.15 30.30
1.2 0 0 …. 0.0001 0.0003 …. 0.14 0.28 …. 6.94 13.89 27.78
1.3 0 0 …. 0.0001 0.0003 …. 0.13 0.27 …. 6.41 12.82 25.64
1.4 0 0 …. 0.0001 0.0002 …. 0.12 0.24 …. 5.95 11.90 23.81
1.5 0 0 …. 0.0001 0.0002 …. 0.11 0.22 …. 5.56 11.11 22.22
1.6 0 0 …. 0.0001 0.0002 …. 0.10 0.21 …. 5.21 10.42 20.83
1.7 0 0 …. 0.0001 0.0002 …. 0.10 0.20 …. 4.90 9.80 19.61
1.8 0 0 …. 0 0.0002 …. 0.09 0.19 …. 4.63 9.26 18.52
1.9 0 0 …. 0 0.0002 …. 0.09 0.18 …. 4.39 8.77 17.54
2 0 0 …. 0 0.0002 …. 0.08 0.17 …. 4.17 8.33 16.67
2.1 0 0 …. 0 0.0002 …. 0.08 0.16 …. 3.97 7.94 15.87
2.2 0 0 …. 0 0.0002 …. 0.08 0.15 …. 3.79 7.58 15.15
2.3 0 0 …. 0 0.0001 …. 0.07 0.14 …. 3.62 7.25 14.49
2.4 0 0 …. 0 0.0001 …. 0.07 0.14 …. 3.47 6.94 13.89
VOLUME NO.6(2016),ISSUE NO.03(MARCH) ISSN 2231-5756
REQUEST FOR FEEDBACK
Dear Readers
At the very outset, International Journal of Research in Commerce, IT & Management (IJRCM) acknowledges
& appreciates your efforts in showing interest in our present issue under your kind perusal.
I would like to request you to supply your critical comments and suggestions about the material published
in this issue, as well as on the journal as a whole, on our e-mail
for further
improvements in the interest of research.
If you have any queries, please feel free to contact us on our e-mail
.
I am sure that your feedback and deliberations would make future issues better – a result of our joint effort.
Looking forward to an appropriate consideration.
With sincere regards
Thanking you profoundly
Academically yours
Sd/-
Co-ordinator
DISCLAIMER