Modeling the Frequency Response Movements in Power
Transformers for Predicting Purposes
A.R. Moniri* and S. Farshad*
Abstract: Power transformers are key components in electrical power supplies and their failure could cause severe consequences on continuity of service and also generates substantial costs. Identifying problems at an early stage, before catastrophic failure occurs, is a great benefit for reliable operation of power transformers.
Frequency Response Analysis (FRA) is a new, well-known and powerful diagnostic test technique for transformers which could find mechanical as well as electrical faults such as detection and positioning of winding short circuit, winding movement, loss of clamping pressure, aging of insulation, etc. Yet there are several practical limitations to affect the accuracy and ease using this test as a regular condition monitoring technique in the field that many of them originated from noise and measuring errors.
This paper purposes a transformer automated self diagnosis system can be installed on every power supply as a part of SCADA to extract FRA graphs from transformers and offers high repeatability which is a great benefit for FRA test.
This is the first time that KALMAN Filter will be use in order to eliminate narrow-band and wide-band noises from FRA graphs that ends up not only smoothed measurement but also rate of changes that is so valuable in decision making and scheduling for transformers maintenance. So we will have an intelligent system which is able to predict the future of transformer using experience of not only own self but also all the transformers in an integrated network.
Keywords: Power Transformers, Condition Monitoring, Frequency Response Analysis (FRA), Kalman Filter Theory.
1 Introduction 3
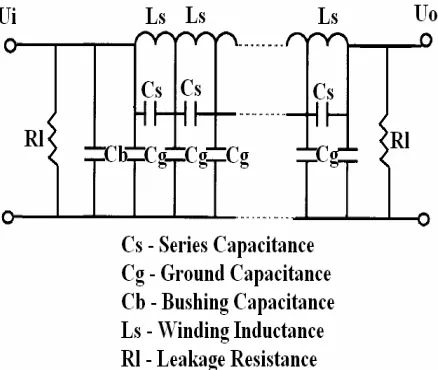
As power transformer age, their internal condition degrades, increases the risk of failure. Forces on the winding during short circuits on the transformer can cause winding distortion, and a reduction or loss of winding clamping can cause winding movement. This can lead to a transformer failure that will cause damage of the transformer and may result in an explosion. Frequency Response Analysis (FRA) is a powerful diagnostic test technique to detect mechanical as well as electrical faults such as detection and positioning of winding short circuit, winding movement, loss of clamping pressure, aging of insulation, etc [1]. The principle of FRA is that [2]: According to the theory of electrotechnics, a transformer winding is equivalent to a linear, bilateral passive network. A simple equivalent circuit using cascaded π sections is shown in Fig. 1. It
Iranian Journal of Electrical & Electronic Engineering, 2006. Paper first received 6th March 2006 and in revised form 22nd November 2006.
* The Authors are with the Department of Railway Engineering, Iran
consists of inductance Ls, Resistance Rl, and capacitance Cs, Cg and Cb. The resistance is usually ignored. The characteristic of this network can be described by transfer function H as following:
o i
H( jw)=20log(U ( jw) / U ( jw)) (1)
Due to winding deformation, aging of insulation, disk deformation, local breakdown, short circuits, disk movements, buckling, moisture ingress, loss of clamping pressure etcetera, transformers inductance and capacitance will change as well as transfer function. In this measurement, the transformer is isolated from the system, whereas great number of endeavors have been taken to implement this method on-load operation [3], and a wide bandwidth signal is applied to one winding terminal; response is measured at another terminal. The magnitude of the admittance of the transformer is calculated as a function of frequency (up to 10 MHz) to give a fingerprint of the transformer. The test is repeated over time, and differences between
FRA may be used as part of a routine condition assessment program that may be use in order to obtain valuable information for decision making when it is necessary. The comparison of results is usually made by plotting a graph of the modulus (or gain) of the impedance against frequency for both sets of measurement. An experienced observer then examines the two curves for any significant differences.
Significant differences usually are:
• Changes to the overall shape of the curve
• The creation of new resonant frequencies or the elimination of existing resonant frequencies
• Large Shifts in existing resonant frequencies It is important from the maintenance point of view that the FRA signature are able to provide some indication of fault types in the transformer rather than merely indicating that some changes have taken place affecting the integrity of the transformer.
Table 1 shows the effect of any change in transformers model parameters as showed in Fig. 1 related to the FRA graph and resultant fault for that change.
Inasmuch as elimination of human, who is comparing the obtained FRA responses and extract fault type from them, is an advantage of an automated system, several solutions in order to use new algorithms which need no human presence to solve, such as usage of neural networks [4] or fuzzy logic in our previous paper [5], have been proposed.
Although FRA is a powerful tool to study the health of power transformer, but there are several reasons which limit usage of this test in the field. Due to the Measuring noise test results may change from time to time and place to place. Also there are several problems for noisy environment of power substations and system constraints as mentioned in [6]. Hence solving these problems make FRA an expensive test and it's not possible to use it in all the substations.
Fig. 1 Simple equivalent circuit of transformer winding.
Did we have been able to design an automation solution which could show when transformer faced to failure and what kind of problems might occur in transformers, we would have had the opportunity to mange time and resources for transformer maintenance and this will guaranty the reliability and security of power network. Here we are offering a FRA system which can install on-site forever and gives us high quality FRA data at required times. This system is proper especially for traction power supplies of the country which currently are under construction and install this set-up for each transformer has which no extra charges [7].
Moreover we have offered a stochastic model of the transformer and applied the system and measuring noises into this model to estimate real changes in FRA results on the grounds of Kalman filter theory lead to estimating current real values and also for the future values. Therefore we can install a simple and cheap intelligent system to acquire data of transformer and then smooth obtained data and classify them in an integrated system without necessity of human at this system hence it is capable to join SCADA.
2 System proposal
Figure 2 shows that how this system can be integrated from automation modules. All components are put in a shield box which will install above the transformer. Data will transfer to main computer via Field-Bus. Then update coefficients will be extracted and sent to central computer via network. Other transformers will use these coefficients as experience of system updating their own filter parameters.
This system designed as simple as possible and its modular structure make it economical to always install on each transformers and perform test in defined period of time.
Each test will take about 12 minutes for the resolution of 5 Hz in the range of 0 to 10 MHz. The Input signal is generated by Direct Digital Synthesis - DDS. The output signal is filtered of field noises by mixer and LPF to extract special frequency on each stage. Also the phase shift of signal can be measured by an Automatic Gain Control -AGC- where sin(∆φ) could calculated via output of low pass filter. Then dc values converted to digital format and are sent to PC based controller. PC based controller calculate vo/vi for all frequencies.
Whenever measurement has been completed, controller begins to send obtained data to computer of corresponded substation.
These diagrams is saved in this computer and Kalman filter algorithms is applied to estimate real diagram excluding noises. Some filter parameters are updated to central computer which is connected to all the power stations to share experience of each to others.
Table 1 Parameter Changes and Their Relationships to Fault [1][2][12]
Type of Fault Effects to FRA Cause
Bushing problems
Significant changes in FRA signature for frequencies less than 1KHz
Changes in Shunt Insulation Resistance
Disc movement, Buckling due
to large mechanical
forces, Moisture
ingress
Creation of new resonant peaks between
1 and 20 KHz and shifting of
dominant peaks
Changes in Shunt Capacitances
Loss of clamping
pressure
Shifting in all frequencies
Changes in Shunt Capacitances
Disc deformation,
Local breakdown
Changes the dominant
resonant frequencies and alters the magnitude of the voltage
transfer function
Changes in Series Inductances
Winding short circuits
Shifts and damps the resonant peaks
Changes in Series Inductances
Aging of Insulation
Resonant frequency movement
Changes in Series capacitances
3 FRA Model of Transformer
There are several models for transformers [8]. In spite of their complete details the parameters are exposed to change by any environmental changes, during time and system failures. In fact these changes make FRA able to diagnose the health status of transformers.
Since exact modeling of transformers is too complicated and really unpractical, we can study FRA by modeling just changes and rate of changes of obtained graphs. In other words differences between FRA graph and transformer fingerprint will be stored and rate of change
for these data and they own selves play rule of state variable. So it is enough to simulate this process as a first order equation which its state variables are value and speed of changes versus frequency.
If we eliminate rapid changes in transformers such as replacing aged oil in order to simplify the problem and leave them for further studies at this field, we can consider that changes are continuous and smooth process in that transformer has soft nature. Owning to this fact, it will be wisely to expect what behavior transformer will be had in future from current information obtained by this test during time.
The simplest solution to simulate this problem is first order Marcov process. In this case we can take rate of changes as a colored noise with bandwidth of β and variance of 2
z
σ that both are frequency dependent. The correlation function of this colored noise between two different times can be considered as:
f f
2 z
E{z(t)z(t+ τ = σ)} e−β τ (2)
In fact βf is capability of FRA curve to change at
specific frequency of f Both βf and σ2f have initial value
and also change during time according to the system experience.
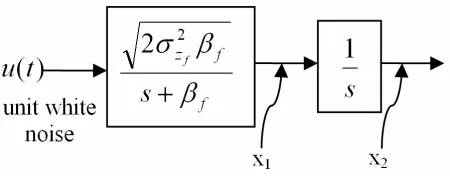
Discussed process have been showed on Fig 2 that :
2 0
x =u(f , t)−u(f , t ) (3)
dt dx
x 2
1= (4)
where f is between 0 to 10 MHz and t0 is time for initial
FRAs curve called its fingerprint. Period for t could be 4 months or more and x2 is measured in dB. x1 is rate of
x2 changes in time.
In other words we can consider this process such that white noise (n(t)) with correlation function of:
2 f f
E{n(t)n(t+ τ = β σ δ − τ)} 2 (t ) (5)
Fig. 3 FRA graph change model.
has been passed from 1 s+ βfilter to produce colored noise with variance of 2f
z
σ . Therefore the discussed model is as follows:
1 1
2
2 2 f f
0
x 0 1 x
u(t)
x 0 x 2
= +
−β σ β
(6)
[
]
12 x
y 1 0 v(t)
x
= ⋅ +
(7)
Where y is our observations, v is measuring noise that is white Gaussian noise and u represent system noise.
4 Estimation of State Variables via Kalman Filter Suppose that a linear discrete system has following equations:
x(n 1)+ = Φ(n)x(n)+G(n)W(n) (8)
z(n)=H(n)x(n)+V(n) (9)
Where x(n)is state vector, z(n)is observation vector and X(0), W, Vare independent white process with zero mean value. W with covariance matrix Q is system noise and V with covariance matrix R is measuring noise and n stands for discrete time. ˆx(n | n )1 2 is the best
estimation for x(n )1 using observed values
2
z(1), z(2),..., z(n ). For Bayesian models p(n | n )1 2 is
covariance matrix for estimation errorx(n )1 −x(n | n )1 2 .
We can consider three states for estimation of state:
1 2
1 2
1 2
n n (filtering) n n (prediction) 1 n n (smoothing)
= 〉 ≤ 〈
As shown in [9] the general Kalman filtered equations can be written for filtering as follows:
T
T 1
T T
T 1 1 1
ˆ ˆ
x(n 1 | n 1) (n)x(n | n) K(n 1){z(n 1) ˆ
H(n 1) (n)x(n | n)}
K(n 1) p(n 1 | n)H (n 1)[R(n 1)
H(n 1)p(n 1 | n)H (n 1)]
p(n 1| n) (n)p(n | n) (n) G(n)Q(n)G (n) p(n 1| n 1)
[H (n 1)R (n 1) p (n 1| n)] p(n 1| n) K
−
− − −
+ + = Φ + + +
− + Φ
+ = + + +
+ + + +
+ = Φ Φ +
+ + =
+ + + + =
+ − (n 1)H(n 1)p(n 1| n) ˆ
p(0 | 0) , x(0,0) 0
+ + +
= ψ =
(10)
And for prediction as follows:
T
T 1
T T
ˆ ˆ
x(n 1 | n) (n)x(n | n 1) ˆ
K(n){z(n) H(n)x(n | n 1)}
K(n) (n)p(n | n 1)H (n)
[R(n) H(n)p(n | n 1)H (n)]
p(n 1| n) [ (n) K(n)H(n)]p(n | n 1) (n)
G(n)Q(n)G (n)
−
+ = Φ − +
− −
= Φ − ⋅
+ −
+ = Φ − − Φ
+
(11)
In regard with our system equations to restate (6) and (7) in (8) and (9) we will have:
X((k 1) t)+ ∆ = Φ ∆(k t)X(k t)∆ +W(k t)∆ (12)
WhereΦis state transition matrix and ∆t is sampling
period of FRA test e.g. every 4 months. Therefore to reach Φ ∆(k t),Q(k t),H(k t)∆ ∆ we will consider:
2
f f f
0
0 1
A , G
0 2
= =
−β σ β
(13)
So we will have :
f f 1 1 t t 1 f 1 1 f f t f t
(k t) ( t) [L [(sI A) ]]
1 1
s s(s )
s 1
L L
0 s 1
0 s
1
1 (1 e )
0 e − − =∆ − − − −β ∆ −β ∆
Φ ∆ = Φ ∆ = −
+ β
− = = + β + β −
β
=
(14)
To obtain Q(k t)∆ if we assume ∆ =t tk 1+ −tkwe will
have equation 15.
k 1 k 1
k k
k 1 k 1
k k
k 1k 1
k k
T
t t
T
k 1 k 1
t t
t t
T T T
k 1 k 1
t t t t
T T k 1
t t
Q(k t) E{W(k t)W (k t)} E (t , )G( )u( )d (t , )G( )u( )d
(t , )G( )E u( )u ( ) G ( ) (t , )d d
(t )G ( )G
+ + + + + + + + + + +
∆ = ∆ ∆ = Φ ξ ξ ξ ξ Φ η η η η
= Φ ξ ξ ξ η η Φ η ξ η =
Φ − ξ δ ξ − η Φ
∫
∫
∫ ∫
∫ ∫
(
)
(
)
(
)
(
)
k 1 kf k 1 k 1
f k 1 f k 1
k
f k 1
f f f
t
T T
k 1 k 1 k 1
t 2
( t ) f
t 2
( t ) 2 (t )
f
f f f
f
t 2 ( t )
f f
t t
f f f f
2 f
(t )d d (t )GG (t )d
2
1 e 2
1 e 2 e d
2 e
2 2 1 1
t 1 e 1 e 2 1 e
+ + + + + + + + + −β −η
−β −η −β −η
−β −η
−β ∆ −β ∆ −β
− η ξ η = Φ − η Φ − η η =
σ
−
σ
β ⋅ − σ β η =
β σ β ∆ − − + − −
β β β β
σ
∫
∫
(
)
(
)
(
)
(
)
(
)
ff f f
t 3 t
f
t 2 t t
f f
1 1 e 2
1 1
2 1 e 1 e 1 e
2
∆ − β ∆
−β ∆ − β ∆ −β ∆
− −
β
− − − −
β β
(15)
H(k)will save its continuous form:
[
]
H(k)= 1 0 (16)
and matrix R will have constant values as measuring noise that can be used as below offer.
T 2
R
R(k)=E V(k) V(k) = σ ∗log(f /100000) (17)
Although these equations are complicated and maybe time consuming for all frequencies from 0 to 10 MHz yet since our test are offline and we have no time constraint, therefore there would be no problem to calculate these equations in computer and yielding results.
5 Simulation Results
Discussion has been simulated in MATLAB and in order to claim efficiency of our plan the frequency model of transformer has been used and during change of a parameter in model at specific rate our algorithm should be able to smooth resultant graphs and also reaching rate of changes.
As discussed in [8] it is possible to express transformers transfer function at middle frequencies by:
If we let value of Lh to face %150 mutation that could
be stand for winding movement and break this change as a linear movement in 100 pieces with proper initial values the curves will be have moving shown on Fig. 4. To simulate available noises in field we have added white Gaussian noise with variance of 0.2 dB to each period of measurement from introduced 100 ones. To reduce simulation time we divide band-width to 200 cells. As obtained from figure 4 the most movements have been occurred in cell #16 to cell #20 which are moving place of resonance peak. For instance we have put amplitude and also speed curves of cell #16 and cell #20 to Figs. 5-8.
In spite of heavy noises added to true curve Figs. 5 and 6 demonstrate acceptable filtering capabilities of system. Sensitivity can be changed via changing in β curve that should be optimized to catch best results. Experience of system will determine optimal β values. Moreover the filter can determine rate of changes in curve during mutation. Figures 7 and 8 show these rates. For example in Fig. 8 after a short while -about 30 periods- speed will be converged at around -0.02 dB/Period which means at this cell after next 10 periods we will have 0.2 dB change in FRA graph. This can help us to schedule maintenance of transformers in an IT based framework.
o S
3 2
I
S h S S h h s S h
1 S.
V C .L
R 1 1 R 1 R
V S S ( ) S.( )
L C .R C .L C .R .L L .C C .L .L
ω
ω ω
ω ω ω ω
=
ω
+ + + + + + (18)
Fig. 4 Initial and final curve of transformer by changing parameter.
Fig. 5 Reduction of amplitude at frequency cell #16.
Fig. 6 Increasing of amplitude at frequency cell #20.
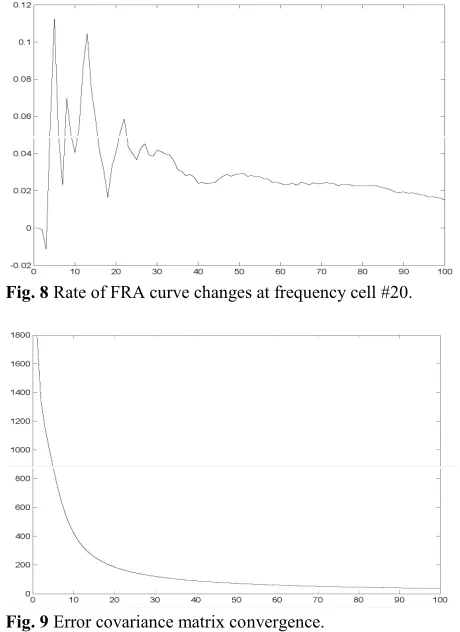
Fig. 7 Rate of FRA curve changes at frequency cell #16.
Fig. 8 Rate of FRA curve changes at frequency cell #20.
Fig. 9 Error covariance matrix convergence.
Figure 9 shows the error covariance of this problem and just after 30 period error falls down to near zero. This proves fast convergency and good application of KALMAN filter for our problem.
6 Experimental Results
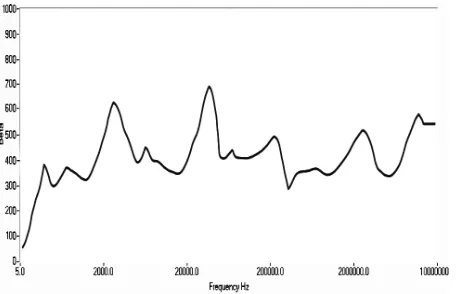
Figure 10 shows measured and estimated FRA curves of a three phase 2.5 MVA power transformer with voltage level 33/11 kV from one test. Six sets of graphs have been performed and the obtained data has entered the equation as observed values (two for each year). In the year 2003, the algorithm predicted that by year 2005 at middle frequencies changes exceed from set threshold that demonstrates large movements in transformer winding [10] which may result in transformer warming and may end up explosion. Figure 11 is the prediction of transformer status and also the estimated curve at the same time. The close results between the predicted and the estimated graphs is considerable. It means two years before any critical circumstances the central computer can alert us and automatically schedule for inspecting transformers, emergency ranked, and give us the opportunity to have a reliable power network which probability of failure at this field may decrease to zero. Figure 12 shows the value of β versus frequency applied to this test.
7 Conclusions
In the view of the author, FRA is the only transformer examination tool that could be integrated to SCADA as
a fully automated diagnosis solution. The environmental noises could cause problems for measuring graphs that will be solved by the presented solution. Although no industrial and economical aspects of this plan has been considered in this paper but we believe that with more investigations it will be the number-one solution to have reliable power transformers based on modern automation systems. The next step for more research in this field is presenting an algorithm to update value of βf and σfz2 of which are constant at this stage but we offer to implement dynamic changes in order to emerge experience of system to others as a way to achieve accurate results.
Fig. 10 Measured and estimated graphs in June 2002.
Fig. 11 Predicted graph in June 2003 for June 2005 and measured graph at June 2005.
Fig.12 Value of β versus frequency.
References
[1] S. M. Islam, "Detection of shorted turns and winding movements in large power transformers using Frequency Response Analysis", Power Engineering Society Winter Meeting, 2000, Vol.3, pp.2233-2238.
[2] L. Xiaowei, S.Qiang, "Test research on power transformer winding deformation by FRA method",
Electrical Insulating Materials, Himeji, Japan, 2001, pp.837-840.
[3] N. Pinhas and S. M. Islam and J. Hullet, "On the development of transfer function method for fault identification in large power transformers on load"
IEEE conference on electrical and dielectric phenomena, 2000, pp.747-751.
[4] D. K. Xu, C. Z. Fu, Y. M. Li, "Application of artificial neural network to the detection of the transformer winding deformation", IEE Symposium on High Voltage Engineering, Aug 1999.
[5] A. R. Moniri, "EFRA", 7th Iranian Student Conference on Electrical Engineering, Khaje Nasir University, Tehran, Iran, September 2004.
[6] M. Wang and A. J. Vandermaar and K. D. Srivastava, "Transformer winding movement monitoring in service-key factors affecting FRA measurement" IEEE insulation magazine, vol.20, No.5, Sep/Oct 2004.
[7] A. R. Moniri, S. Farshad, "Database for power transformers fingerprint, a way to improve reliability in modern railways", COMPRAIL2006, Czech Republic.
[8] S. M. Islam and M. Coates and G. Ledwich, "Identification of high frequency transformer equivalent circuit using Matlab from frequency domain data", IEEE Industry Application Conference, 1997, Vol.1, pp.357-364.
[9] A. Borrie, Stochastic systems for engineers, modeling, estimation, Prentice-Hall, 1986.
[10]M. A. Abdul Rahman, H. Hashim, P. S. Ghosh, "Frequency Response Analysis of a power transformer", Australasian Universities Power Engineering Conference, Christchurch, New Zealand, 2003.
[11]E. P. Dick and C. C. Even, “Transformer Diagnostic Testing by Frequency Response Analysis”, IEEE Transaction on Power Apparatus and Systems, PAS-97, No.6, Nov/Dec 1978.
Alireza Moniri was born in Tehran, Iran, in 1982. He received the B.S. degree in electrical engineering from Azad University, South Tehran branch in 2004 and his M.S. degree on railway engineering at Iran University of Science and Technology-IUST, Tehran, Iran in 2006. His main field of interests is industrial system integration. Now he is power supply head engineer of Tehran metro line #7.
Siamak Farshad received the M.S. degree in electrical power engineering from Iran University of Science & Technology (IUST), Iran, in 1989, and the PhD. degree in electrical engineering (Electrification and Automation of Railway) from the Beijing Jiao tong university, China, in 2000., he was working as a Faculty Member in IUST electrical Eng. Department, since 1989 . He joined the school of railway Engineering of IUST in 2000. His teaching and research interests are design, analysis and modeling of Electric locomotives and electric railway supply systems.
![Table 1 Parameter Changes and Their Relationships to Fault [1][2][12]](https://thumb-us.123doks.com/thumbv2/123dok_us/219937.2016498/3.595.57.276.81.452/table-parameter-changes-relationships-fault.webp)