A b s t r a c t. Physical properties of food materials like grains are important in the design or improvement of harvesting and processing machines. This study was aimed at assessment of some physical properties of red bean grains as a function of moisture content. Based on the results obtained, with increasing moisture content, grain dimensions as well as thousand grain mass in-creased. In the moisture content range of 10 to 20% w.b., the surface area, true density, and porosity values increased by 10.6-19.7, 4.76-6.24, and 17.91-21%, respectively. This increase in moisture content caused a decrease in bulk density values by 8.35 and 9.70% for the varieties of Goli and Akhtar, respectively. Coefficient of static friction (Goli and Akhtar) increased against surfaces of rubber (27.3 and 27%), galvanized iron (50 and 28.5%), and plywood (32 and 21.4%) as the moisture content increased. Mechanical properties were determined in terms of average rupture force, deformation at rupture point, and rupture energy. Defor-mation and rupture energy of red bean grains generally increased in magnitude with an increase in moisture content, while rupture force decreased.
K e y w o r d s: bean, moisture content, physical properties INTRODUCTION
In Iran, red bean has been widely cultivated as a legume crop for a long time. A present, the cultivated area is about 116×103ha, with yield of 1 610 kg ha-1(FAO, 2006). Red bean is a good alternative to expensive animal protein. High shelf life, ease of transportation, and low cost are attractive points for farmers. Recently scientists have made great efforts in evaluating basic physical properties of agricultural materials and have pointed out their practical utility in machine and structural design and in control engineering (Aminet al., 2004). Recent scientific developments have improved the handling and processing of bio-materials through thermal, electrical, optical and other techniques, but little is known about the basic physical characteristics of
biomaterials. Such basic information is important not only to engineers but also to food scientists, processors, plant breeders and other scientists who may find new uses (Mohsenin, 1978). Dimensions are important in the design of cleaning, sizing and grading machines. Bulk density and porosity are major considerations in designing drying and aeration and storage systems, as these properties affect the resistance to air flow of the mass (Aminet al.,2004; Dursun and Dursun, 2005). Awareness of the coefficient of friction is crucial in designing equipment for solid flow and storage structures. The coefficient of friction between grains and wall is an important parameter in the prediction of grain pressure on walls (Amin et al., 2004; Ghasemi Varnam-khastiet al.,2008a). The mechanical properties of red bean grains are important for the design of equipment for harvest-ing and post-harvestharvest-ing technology, transportharvest-ing, storage, packaging and processing it into different foods (Khanaliet al.,2007; Ghasemi Varnamkhastiet al.,2008b).
In recent years, physical properties have been studied for various crops, such as white speckled and red kidney bean grains (Isik and Unal, 2007), hemp seed (Saciliket al., 2003), groundnut kernel (Olajide and Igbeka, 2003), almond nut and kernel (Aydin, 2003), lentil seed (Aminet al., 2004), edible squash seed (Paksoy and Aydin, 2004) and faba bean (Altuntas and Yildiz, 2007). The objective of this study was to investigate some moisturedependent physical properties of two red bean grain varieties (Goli and Akhtar), namely size, dimensions, sphericity, thousand grain mass, bulk den-sity, true denden-sity, poroden-sity, surface area and the coefficients of static friction on various surfaces in the moisture content ranging from 10 to 20% w.b. In addition, the effects of moisture content on rupture force, deformation at rupture point, and rupture energy were studied.
Moisture dependent physical properties of red bean (
Phaseolus vulgaris
L.) grains
M. Kiani Deh Kiani
1*, S. Minaei
1, H. Maghsoudi
1, and M. Ghasemi Varnamkhasti
21Department of Agricultural Machinery Engineering, Faculty of Agriculture, Tarbiat Modares University, Tehran, Iran 2
Department of Agricultural Machinery Engineering, Faculty of Biosystems Engineering, University of Tehran, Karaj, Iran Received December 19, 2007; accepted April 28, 2008
© 2008 Institute of Agrophysics, Polish Academy of Sciences *Corresponding author’s e-mail: mostafa_kyani@yahoo.com
A
A
MATERIALS AND METHODS
The red bean varieties (Goli and Akhtar)used for this study were obtained from the seed and seedling research institute located in Tehran, the capital of Iran. The samples were manually cleaned to remove foreign matter, dust, dirt, broken and immature grains. Initial moisture content of the samples was determined by oven drying at 105 ± 1ºC for 24 h (Suthar and Das, 1996). Samples at the desired moisture levels were prepared by adding calculated amounts of distil-led water, thorough mixing, and then sealing in separate sea-led glass jars. The quantity of distilsea-led water was calculated from the following equation:
W W M M
M
2 1 1 2
1 100
=
-é ëê
ù
ûú, (1)
where: W1, W2 are designated as sample weight (g) and distilled water weight (g), respectively;M1,M2are final and initial moisture content (w.b.%), respectively.
The samples were kept at 5°C in a refrigerator for 7 days to allow the moisture to distribute uniformly throughout the sample. Before starting the test, the required quantities of the samples were taken out of the refrigerator and allowed to warm up to room temperature (Deshpande et al., 1993; Visvanathanet al., 1996). All the physical properties of red bean grains were measured at moisture levels of 10, 12.5, 15, 17.5 and 20% w.b. Ten replications of each test were made at each moisture level. For each moisture content, the length (L), width (W), thickness (T) and mass of red bean grains were measured in randomly selected 100 red bean grains. The length, width and thickness of grains were measured using a digital caliper (CD-6”CS, Mitutoyo, Japan) to an accuracy of 0.01 mm. The geometric mean diameter (Dg) and sphericity (f) of red bean grains were calculated using the following relationships (Mohsenin, 1978):
Dg =(LWT)13 , (2)
f=D
L g
100 . (3)
Thousand grain mass was measured by an electronic balance (GF-600, A&D, Japan) to an accuracy of 0.001 g. To evaluate thousand grain mass, 100 randomly selected grains from the bulk were averaged. The true density (rt) of grain is defined as the ratio of the mass of a sample of a grain to the solid volume occupied by the sample (Deshpandeet al., 1993). The grain volume and its density, as a function of moisture content, were determined using the liquid displacement me-thod. Toluene (C7H8) was used rather than water because it is absorbed by grains to a lesser extent. Also, its surface ten-sion is low, so that it fills even shallow depresten-sions in a grain and its dissolution power is low (Mohsenin, 1978; Sitkei, 1986). The bulk density (rb) is the ratio of the mass of a sample of a grain to its total volume (Deshpandeet al., 1993; Suthar and Das, 1996). The porosity (e) was determined using the following equation (Mohsenin, 1978; Sharifiet al., 2007):
e r r
r
= t- b
t
100 . (4)
The surface area (S) of red bean grain was found by analogy with a sphere of same geometric mean diameter, using the expression cited by Saciliket al. (2003):
S= pDg2. (5)
The coefficient of static friction for red bean grains was determined against surfaces of galvanized iron, plywood and rubber at different moisture levels. An aluminium box of 150 mm length, 100 mm width and 40 mm height, without base and lid, was filled with the sample and placed on an adjustable tilting plate, faced with the test surface. The sample container was raised slightly (5-10 mm) so as not to touch the surface. The inclination of the test surface was increased gradually with a screw device until the box just started to slide down, at which time the angle of tilt was read from a graduated scale. For each replication, the sample in the container was emptied and refilled with a new sample (Joshiet al.,1993; Olajide and Ade-Omowage, 1999). Coef-ficient of static friction (m) was determined using the fol-lowing relationship (Mohsenin, 1978):
m=tana, (6)
whereais angle of tilt (deg).
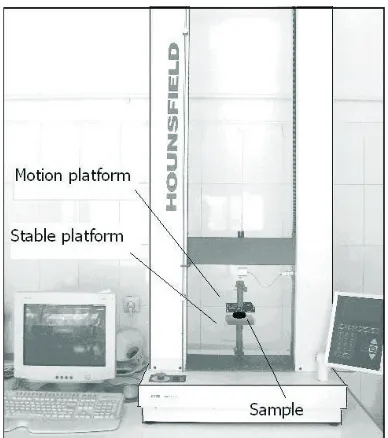
To determine the rupture strength of the red bean grain, a material testing machine (H50 K-S, Hounsfield, England) for biological material was used. This device has three main components which are a fixed base plate and a moving para-llel plate, a driving unit, and a data acquisition system com-posed of a dynamometer, amplifier and XY plotter (Fig. 1). The sample was placed on the base plate and pressed by the moving parallel plate until rupture occurred (Aydin and Ozcan, 2001). Force-deformation curves were recorded in order to examine the rupture force and deformation at rupture point; the tests were carried out at deformation rate of 3 mm min-1(ASAE, 2005) for all moisture levels. The sample pressed, along with the thickness and energy ab-sorbed by the sample, was determined by calculating the area under the force-deformation curve from the following equation (Bragaet al., 1999):
E=éëêFDùûú
2 , (7)
where:E, F, Dare defined as rupture energy (mJ), rupture force (N), and deformation (mm), respectively.
RESULTS AND DISCUSSION
The mean values and standard deviation of the axial dimensions of red bean grains at different moisture contents are presented in Table 1. As can be seen, the three axial dimensions increased with an increase in moisture content from 10 to 20% w.b. The geometric mean diameter is also presented in Table 1. This also increased with increasing moisture content. Differences among the values were found to be statistically significant at the 5% level.
The one thousand grain mass of the red bean varieties increased linearly as the moisture content increased, as illu-strated in Fig. 2. This trend was significant (P< 0.05) so that an increase of 12.3 and 15.2% in the one thousand grain mass values was observed for Goli and Akhatr, respecti-vely. The linear equations for one thousand grain mass (M1000) can be developed as follows:
M1000=3.72MC+271.8 R2= 0.99 Goli, (7) M1000=5.84MC+365 R2= 0.96 Akhtar. (8) A linear increase in the one thousand grain mass as the grain moisture content increases has been reported by Deshpandeet al.(1993) for soybean, Tekinet al. (2006) for Bombay bean, Altuntas and Yildiz (2007) for faba bean, and by Cetin (2007) for barbunia.
Variation of grain surface area with moisture content is plotted in Fig. 3. There were marked differences among the values (P<0.05). The figure indicates that the surface area increased linearly with increasing grain moisture content. The surface area of red bean grains increased from 175.9 to 194.67 mm2for Goli and from 218.77 to 261.98 mm2for Akhtar. The relationships between moisture content and surface area values can be expressed mathematically as:
S=1.7148MC+159.08 R2= 0.96 Goli , (9) S=3.969MC+179.58 R2= 0.96 Akhtar, (10) whereMCis moisture content.
Fig. 1.Biological material testing apparatus.
Varieties Moisture content(%w.b.) Length(mm) Width(mm) Thickness(mm) Geometric meandiameter (mm)
Goli
10 11.30±1.11 7.08±0.77 5.27±0.43 7.48±0.81
12.5 11.45±0.92 7.16±0.68 5.38±0.67 7.61±0.74
15 11.50±1.23 7.24±0.52 5.41±0.82 7.66±0.86
17.5 11.57±1.17 7.27±0.90 5.46±0.71 7.72±0.68
20 11.76±1.21 7.35±0.81 5.61±0.93 7.87±0.53
Akhtar
10 13.97±1.14 7.65±0.78 5.51±0.35 8.36±0.78
12.5 14.39±1.22 7.70±0.55 5.73±0.55 8.59±0.69
15 14.50±1.11 7.81±0.80 5.82±0.72 8.70±0.72
17.5 14.65±1.28 7.97±0.68 5.91±0.81 8.83±0.83
20 15.09±1.09 8.22±0.82 6.10±0.63 9.12±0.61
T a b l e 1.Mean values and standard deviations of the grain dimensions at different moisture content
200 300 400 500
5 10 15 20 25
Moistu re content (%w .b.)
th
ous
a
nd
gr
a
in
m
as
s
(g)
Fig. 2.Effect of moisture content on one thousand grain mass
Similar trends have been reported by Deshpandeet al. (1993) for soybean and by Tekinet al. (2006) for Bombay bean.
Sphericity of red bean grains increased slightly, from 66.2 to 66.9% for Goli, and from 59.6 to 60.5% for Akhtar, with increasing moisture content (Fig. 4). The values were statistically significant (P<0.05). The relationship between sphericity and moisture content within 10-20% w.b. can be considered by the following equations:
f=0.068MC+65.54 R2= 0.99 Goli, (11)
f=0.096MC+58.58 R2= 0.98 Akhtar. (12) Although decreasing trends have been reported by Tekinet al. (2006) for Bombay bean, similar trends were observed in the works of Altuntas and Yildiz (2007) for faba bean and Cetin (2007) for barbunia.
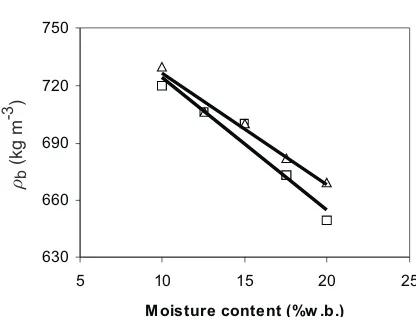
The values of bulk density for different moisture levels showed a pronounced decrease ranging from 730 to 669 kg m-3for Goli and from 720 to 650 kg m-3for Akhtar, as presented in Fig. 5. Differences among bulk density values were statistically significant at the 5% probability level. The following relationships were found, correlating bulk density values and moisture content:
rb=-5.84MC+785 R2=0.97 Goli , (13)
rb=-6.92MC+793 6. R2=0.95 Akhtar. (14) A similar decreasing trend in bulk density was found by Tekinet al. (2006) for Bombay bean, Altuntas and Yildiz (2007) for faba bean, and by Cetin (2007) for barbunia.
The true density values increased sharply from 1240 to 1299 kg m-3for Goli and from 1217 to 1293 kg m-3for Akhtar, and these values were significant at the 5% level of probability (Fig. 6). The true density and the moisture content of grain can be correlated as follows:
rt=-5.64MC+1184 4. R2= 0.99 Goli, (15)
rt=-7.32MC+1146 8. R2=0.99 Akhtar. (16)
Although the results were similar to those reported by Yalcin and Ozarslan (2004) for vetch seed, Aviaraet al. (2005) for Balanites aegypticiaca nuts, Tekinet al. (2006) for Bombay bean and Altuntas and Yildiz (2007) for faba bean, a different trend was reported by Cetin (2007) for barbunia.
The porosity of red bean grains increased from 41.13 to 48.50% for Goli and from 40.84 to 49.73% for Akhtar (P<0.05), as can be seen in Fig. 7. The relationship between porosity and moisture content can be given as below:
e=0.7068MC+34 394. R2= 0.99 Goli, (17)
e=0.84MC+32 29. R2= 0.97 Akhtar. 18)
100 140 180 220 260 300
5 10 15 20 25
M oist ure content (%w .b.)
S
u
rf
a
ce
a
re
a
(mm2
)
Fig. 3.Variation of grain surface area (S) with moisture content of
red beans:DGoli,Akhtar.
57 60 63 66 69
5 10 15 20 25
Moisture content (%w .b.)
S
p
h
er
is
ity
(%
)
Fig. 4.Effect of moisture content on sphericity (f)of red beans:
DGoli,Akhtar.
630 660 690 720 750
5 10 15 20 25
Moisture content (%w .b.)
B
u
lk
d
e
n
s
it
y
(k
g
/m
3
)
Fig. 5.Effect of moisture content on bulk density (rb)of red bean
grains:DGoli,Akhtar.
S
(mm
2 )
f
(%)
rb
(kg
m
Altuntas and Yildiz (2007), Aviara et al. (2005), Coskunet al.(2006), Cetin (2007), Nimkaret al. (2005) and Tekinet al.(2006) reported similar trends in the case of faba bean,B. aegyptiacanuts, sweet corn seed, okra seed, bar-bunia, moth gram and Bombay bean, respectively.
Values of the coefficient of static friction of red bean grains on three surfaces (rubber, plywood and galvanized iron) against moisture content in the range of 10-20% w.b. are presented in Table 2. It was observed that the coefficient of static friction increased with increasing moisture content for all of the surfaces. This is due to the increased adhesion between the grain and the material surfaces at higher moisture values.
The coefficient of static friction of Goli variety in-creased by 27.3, 32, and 33% in the case of rubber, plywood and galvanized iron, respectively (P<0.05), and the corres-ponding values for Akhtar variety increased by 26.4, 21.4,
and 28.5% in the case of rubber, plywood and galvanized iron, respectively (P<0.05), as the moisture content increa-sed from 10 to 20% w.b. At all moisture contents, the lowest values of coefficient of static friction were observed on galvanized iron. This may be owing to smoother and more polished surface of the galvanized iron sheet than the other materials used. The relationships between coefficients of static friction and moisture content on all surfaces are given in Table 3. Similar results were found and reported by Coskunet al. (2006), Cetin (2007), Nimkaret al. (2005) and Tekinet al. (2006) for sweet corn, barbunia, moth gram and Bombay bean, respectively.
With increasing moisture content, as shown in Fig. 8, rupture force of red bean grains was found to decrease for Goli from 93.26 to 63.67 N and for Akhtar from 78.49 to 51.34 N (statistically significant at the 5 % level). The small rupture force at higher moisture content might have resulted from the fact that the grain became more sensitive to 1200
1240 1280 1320
5 10 15 20 25
Moisture content (%w .b.)
T
rue
de
ns
it
y
(k
g
/m
3
)
Fig. 6.True density (rt) of red bean grains as affected by moisture
content:DGoli,Akhtar. rt
(kg
m
-3 )
37 40 43 46 49 52
5 10 15 20 25
Moisture content (%w .b.)
Po
ro
si
ty
(%
)
Fig. 7.Influence of moisture content on porosity (
e
) of red beangrains:DGoli,Akhtar.
e
(%)
Varieties Moisture content (%w.b.)
Static friction coefficient
Galvanized iron Plywood Rubber
Goli
10 0.18±0.010 0.25±0.014 0.33±0.021
12.5 0.19±0.008 0.27±0.017 0.36±0.019
15 0.21±0.013 0.28±0.013 0.37±0.018
17.5 0.22±0.012 0.30±0.016 0.39±0.023
20 0.24±0.009 0.33±0.018 0.42±0.025
Akar
10 0.21±0.015 0.28±0.020 0.37±0.022
12.5 0.23±0.012 0.30±0.018 0.39±0.018
15 0.24±0.014 0.31±0.016 0.40±0.025
17.5 0.26±0.018 0.33±0.014 0.44±0.023
20 0.27±0.016 0.34±0.022 0.47±0.021
cracking at high moisture. Variation in the rupture force of red beans with moisture content can be represented by the following equations:
F=2.92MC+119 6. R2= 0.97 Goli, (19) F=2.72MC+104 2. R2= 0.99 Akhtar. (20) Konaket al.(2002); Ozarslan (2002) Tekinet al. (2006) and Saiediradet al.(2008) also reported a decrease in rupture force when the moisture content increased for chick pea grains, cotton, Bombay bean and cumin seed, respectively. Deformation of grain at the rupture point as a function of moisture content is presented in Fig. 9. Deformation of grain at rupture point increased sharply as the moisture content increased. With increasing moisture content from 10 to 20% w.b. deformation increased from 0.45 to 0.73 mm and from 0.36 to 0.67 mm for Goli and Akhtar, respectively. Corres-ponding values had a significant difference at the 5% level. The relationship between moisture content and deformation at rupture point can be formulated by the following linear equations:
D=0.0276MC+0172. R2= 0.99 Goli , (21) D=0.0296MC+0 056. R2= 0.98 Akhtar. (22)
A similar trend was observed by Paulsen (1978) for soybean and by Guneret al. (2003) for hazelnut.
As presented in Fig. 10, rupture energy generally increased from 20.92 to 22.99 Nmm, for Goli and from 14.04 to 17.08 Nmm, for Akhtar as moisture content increased for loading along the thickness. Differences between values were statistically significant at the 5% probability level. The results are similar to those reported by Oloso and Clarke (1993) and Guner et al., (2003). The relationship between the rupture energy and moisture content of the red bean grains can be represented by the following correlations:
E=0.2072MC+18.6 R2= 0.92 Goli, (23) E=0.2576MC+11.5 R2= 0.86 Akhtar. (24)
CONCLUSIONS
The following conclusions are drawn from the investi-gation on physical properties of two varieties of red bean grains for five moisture content ranging from 10 to 20% w.b.:
1. Average length, width and thickness of grains ranged from 11.30 to 11.84, 7.08 to 7.35, 5.27 to 5.61 mm for Goli and from 13.96 to 15.20, 7.56 to 8.22, 5.51 to 6.10 mm for Akhtar.
Material
Goli Akhtar
Equations R2 Equations R2
Galvanized iron m =0.0096MC+0.076 0.96 m =0.0064MC+0.144 0.98
Plywood m =0.0076MC+0.172 0.97 m =0.0060MC+0.222 0.99
Rubber m =0.0084MC+0.248 0.97 m =0.0100MC+0.264 0.96
T a b l e 3.Relationships between coefficient of static friction (m) of red bean grain and moisture content (MC)
0.3 0.4 0.5 0.6 0.7 0.8
5 10 15 20 25
Moistur e cont ent (%w .b.)
De
fo
rm
a
ti
o
n
(m
m
)
Fig. 9.Deformation (D) at rupture point of red beans as affected by
moisture content::DGoli,Akhtar.
D
(mm)
12 15 18 21 24
5 10 15 20 25
Moisture content (%w.b.)
E
n
e
rgy
(N
.mm)
Fig. 10.Rupture energy (N) of red bean grains at different moisture
levels:DGoli,Akhtar.
E
(N
2. Bulk density decreased by 8.35 and 9.70%, whereas the true density increased by 4.76 and 6.24% for Goli and Akhtar, respectively.
3. Static coefficient of friction increased for Goli and Akhtar grains against all three surfaces, namely, rubber – by 27.3 and 26.4%, galvanized iron – by 33 and 28.5% and plywood – by 32 and 21.4%, respectively.
4. Rupture force decreased as the moisture content increased by 32.2 and 34.6% for Goli and Akhtar, respectively.
5. The results obtained could be considered and used for designing post-harvest equipment and other tasks related to agricultural machinery development.
REFERENCES
Altuntas E. and Yildiz M., 2007.Effect of moisture content on
some physical and mechanical properties of faba bean (Vicia fabaL.) grains. J. Food Eng., 78, 174-183.
Amin M.N., Hossain M.A., and Roy K.C., 2004. Effects of
moisture content on some physical properties of lentil grains. J. Food Eng., 65, 83-87.
ASAE Standards, 2005. Compression test of food materials of convex shape. S352.2, 580-587.
Aviara NA., Mamman E., and Umar B., 2005.Some physical
properties ofBalanites aegyptiacanuts. Biosystems Eng., 92(3), 325-334.
Aydin C., 2003.Physical properties of almond nut. J. Food Eng.,
60, 315-320.
Aydin C. and Ozcan M., 2002.Some physico-mechanic
pro-perties of terebinth fruits. J. Food Eng., 53, 97-101. Braga G.C., Couto S.M., Hara T., and Neto J.T.P.A., 1999.
Mechanical behaviour of macadamia nut under compression loading. J. Agric. Eng. Res., 72, 239-245.
Coskun M.B., Yalcin I., and Ozarslan C., 2006. Physical
properties of sweet corn seed (Zea mays saccharataSturt.). J. Food Eng., 74, 523-528.
Cetin M., 2007.Physical properties of barbunia bean (Phaseolus
vulgarisL. cv. ‘Barbuniz’) seed. J. Food Eng., 80, 353.
Deshpande S.D., Bal S., and Ojha T. P., 1993. Physical
properties of soybean grains. J. Agric. Eng. Res., 56, 89-92.
Dursun E. and Dursun I., 2005.Some physical properties of
caper seed. Biosystems Eng., 92, 237-245.
FAO,2004.Available from http://faostat.fao.org/faostat.
Ghasemi Varnamkhasti M., Mobli H., Jafari A., Keyhani A.R., Heidari Soltanabadi M., Rafiee S., and Kheiralipour K.,
2008a. Some physical properties of rough rice (Oryza
Sativa) grain. J. Cereal Sci., 47, 496-501.
Ghasemi Varnamkhasti M., Mobli H., Jafari A., Soltanabadi
M., Keyhani A., and Rafiee S., 2008b.Processing quality
of milled rice in modified blade type milling machine considering variety type, rotor speed, and output flow rate. American-Eurasian J. Agric. Environ. Sci., 3, 70-78.
Guner M., Dursun E., and Dursun I.G., 2003. Mechanical
behaviour of hazelnut under compression loading. Bio-systems Eng., 85, 485-491.
Isik E. and Unal H., 2007. Moisture-dependent physical
pro-perties of white speckled red kidney bean grains, J. Food Eng., 82, 209-216.
Joshi D.C., Das S.K., and Mukherjee R.K., 1993.Physical
proper-ties of pumpkin grains. J. Agric. Eng. Res., 54, 219-229. Khanali M., Ghasemi Varnamkhasti M., Tabatabaeefar A.,
and Mobli H., 2007. Mass and volume modeling of
tangerine (Citrus reticulate) fruit with some physical attributes. Int. Agrophysics, 21, 329-334.
Konak M.C¸ arman K., and Aydin C., 2002.Physical properties
of chickpea grains. Biosystems Eng., 82, 73-78.
Mohsenin N.N., 1978.Physical properties of plant and animal
materials. Gordon and Breach Press, New York.
Nimkar P.M., Mandwe D.S., and Dudhe R.M., 2005.Physical
properties of moth gram. Biosystems Eng., 91, 183-189.
Olajide J.O. and Ade-Omowage B.I.O., 1999.Some physical
properties of locust bean seed. J. Agric. Eng. Res., 74, 15-22.
Olajide J.D. and Igbeka J.C., 2003.Some physical properties of
groundnut kernels. J. Food Eng., 58, 201-204.
Oloso A.O. and Clarke B., 1993. Some aspect of strength
properties of cashew nuts. J. Agric. Eng. Res., 55, 27-43.
Ozarslan C., 2002. Some physical properties of cotton grain.
Biosystems Eng., 83, 169-174.
Paksoy M. and Aydin A., 2004. Some physical properties of
edible squash (Cucurbita pepoL.) seeds. J. Food Eng., 65, 225-231.
Paulsen M.R., 1978.Fracture resistance of soybean to
compres-sive loading. Trans. ASAE, 21(6), 1210-1216.
Sacilik K., Ozturk R., and Keskin R., 2003. Some physical
properties of hemp grain. Biosystems Eng., 86, 213-215. Saiedirad M.H., Tabatabaeefar A., Borghei A., Mirsalehi M.,
Badii F., and Ghasemi Varnamkhasti M., 2008.Effects of
moisture content, seed size, loading rate and seed orientation on force and energy required for fracturing cumin seed (Cuminum cyminumLinn.) under quasi-static loading. J. Food Eng., 86, 565-572.
Sharifi M., Rafiee S., Keyhani A., Jafari A., Mobli H.,
Rajabi-pour A., and Akram A., 2007.Some physical properties of
orange (var. Tompson). Int. Agrophysics, 21, 391-397.
Sitkei G., 1986.Mechanics of Agricultural Materials. Elsevier,
New York.
Suthar S.H. and Das S.K., 1996. Some physical properties of
karingda (Citrus lanatus(thumb) mansf) grains. J. Agric. Eng. Res., 65, 15-22.
Tekin Y., Isýk E., U¨ nal H., and Okursoy R., 2006.Physical and
mechanical properties of Turkish goynuk Bombay beans (Phaseolus vulgarisL.). Pakistan J. Biol. Sci., 9, 2229-2235. Visvanathan R., Palanisamy P.T., Gothandapani L., and
Sreenarayanan V.V., 1996. Physical properties of neem
nut. J. Agric. Eng. Res., 63, 19-25.
Yalcin I. and Ozarslan C., 2004.Physical properties of vetch