Psychology: Journal Articles (Peer-Reviewed) Psychology
2006
Cognitive processes underlying lottery and sports
gambling decisions: The role of stated probabilities
and background knowledge
Rob Ranyard
University of Bolton, [email protected]
John Charlton
University of Bolton, [email protected]
This Article is brought to you for free and open access by the Psychology at UBIR: University of Bolton Institutional Repository. It has been accepted for inclusion in Psychology: Journal Articles (Peer-Reviewed) by an authorized administrator of UBIR: University of Bolton Institutional Repository. For more information, please [email protected].
Digital Commons Citation
Ranyard, Rob and Charlton, John. "Cognitive processes underlying lottery and sports gambling decisions: The role of stated probabilities and background knowledge." (2006).Psychology: Journal Articles (Peer-Reviewed).Paper 10.
Running head: LOTTERY AND SPORTS GAMBLE CHOICES
Cognitive Processes Underlying Lottery and Sports Gambling Decisions:
The Role of Stated Probabilities and Background Knowledge
Rob Ranyard and John P. Charlton
Abstract
Two studies compared choice and underlying cognitive processes in equivalent decision tasks
involving risk and uncertainty (lotteries versus sports gambles including displayed expert
probability judgments). In sports gambles, background knowledge was triggered via
information on team location, home or away. Otherwise, displayed risk information (stake,
winnings, odds and outcome probabilities) was controlled across gamble type. In a choice
study, home win bets were chosen significantly more frequently than draws or away wins,
compared to lottery equivalents. In a parallel study eliciting concurrent verbal protocols,
participants made fewer evaluations of odds and probabilities, and more statements involving
background knowledge in sports gambles. Furthermore, some sports gamble protocols
indicated modifications of stated probabilities and decision strategies contingent on domain
knowledge. It was concluded that stated probability revision and knowledge-based reasoning
are key cognitive processes in sports gambling not normally applied in the lottery paradigms
often employed in decision research.
KEY WORDS: Decision making, risk, uncertainty, probability revision, decision
Cognitive Processes Underlying Lottery and Sports Gambling Decisions:
The Role of Stated Probabilities and Background Knowledge
A basic distinction is made in decision research between risk and uncertainty
(Tversky & Fox, 1995). Risky decisions are those made when objective outcome probabilities
are precisely known. In contrast, decisions under uncertainty are those made when outcome
probabilities are unknown and any estimates or beliefs about them are subjective. In
behavioural studies of risky decision making, research participants have traditionally been
presented with lotteries in which small sums of money can be won or lost. These outcomes
are determined by a clearly random process, for example, drawing lottery tickets from an
opaque container or spinning a fair “wheel of fortune”. Known proportions of the tickets, or
of the wheel, are associated with different outcomes to clearly define their probabilities of
occurrence. The value of the lottery paradigm has frequently been stated, perhaps most
clearly by Lopes (1983, p. 137): “The simple static lottery or gamble is as indispensable to
research on risk as is the fruitfly to genetics”. However, its limitations as the main empirical
domain of psychological decision theory have also been recognised (e.g. Goldstein & Weber,
1995; Huber, 1997, in press). In particular, since there are major differences between
experimental lottery contexts and those involving uncertainty in everyday life, lottery-based
findings and theories developed from them may have limited generalisibility.
The present studies assess the extent to which findings from lottery studies generalise
by comparing predecision processes and choice patterns in a lottery paradigm with those in a
similar context involving uncertainty. We constructed naturalistic gambling tasks involving
uncertainty, based on betting on a football match, and equivalent, experimental lotteries
(raffles) in which the information displayed was closely matched. As far as we know, there
uncertainty that have controlled displayed risk dimension information. The studies focus on
two important differences between these decision contexts, the nature of outcome
probabilities, and background information and knowledge. In one study we adopt a process
tracing approach which seeks to identify the cognitive mechanisms underlying decision
behaviour. Previous research in this vein has shown how predecision processes are contingent
on a range of features of the decision context, such as task complexity and similarity structure
(for reviews see Crozier & Ranyard, 1997; Payne, 1982; Payne, Bettman & Johnson, 1993;
Svenson, 1979, 1996, 2003). For example, with respect to decision under risk, process tracing
studies using the think aloud method have identified some of the editing heuristics and
decision strategies people apply to lottery decisions (e.g. Montgomery, 1977; Ranyard, 1987,
1995). The broad aim of the present studies is to extend this work to develop an
understanding of the cognitive processes underlying decision under uncertainty.
Research questions and hypotheses
First let us consider how differences in the nature of outcome probabilities may affect
decision processes. There is an extensive body of previous research on the effects of
ambiguous and unknown outcome probabilities (Camerer & Weber, 1992; Fox, 1999; Fox &
Tversky, 1995, 1998; Heath & Tversky, 1991; Keren & Gerritsen, 1999; Tversky & Fox,
1995). Some of this has compared decision behaviour between situations where known
outcome probabilities are stated with those where outcome probabilities are neither known
nor stated – what Hogarth and Kunreuther (1995) refer to as “decision under ignorance”.
Equally important, however, is an understanding of the role of stated probabilities of different
types in different contexts. Whereas in the lottery paradigm stated probabilities can be
interpreted as precise, known probabilities, those in the sports gambling context can only be
interpreted as expressions of subjective probability. Little is known about the impact of
that the lottery’s clearly defined probabilities would have a greater impact than subjective
opinions offered to the sports gambler, even if the latter are those of an expert in the domain.
If people believe that the validity of probability information in the sports context is more
doubtful, they may attach less importance to it. Consequently, they may prefer sports gambles
with better possible gains, rather than better probabilities of gains, compared to in equivalent
lottery scenarios. In Study 1, therefore, one specific hypothesis tested was:
H1: lottery decisions will be more risk-averse compared to the equivalent sports
gambling choices.
The second contextual difference between lottery and sports gambling we consider
concerns background information and knowledge. The traditional lottery paradigm is not a
knowledge-rich context, unlike the world of sports gambling and many other everyday
decision contexts in which an extensive knowledge base is available. This may affect both the
subjective probabilities and decision strategies used to make gambling choices. With respect
to the former, Windschitl and Weber (1999) found that interpretations of precise stated
probabilities were influenced by the background context. For example, in scenarios where an
outcome was a priori more likely, verbal likelihood judgements were higher than in those
where it was less likely, even though experts’ stated probabilities were the same. The present
studies extend this research to decision under uncertainty and investigate the extent to which
the context of a sporting event affects gambling choices in scenarios where expert stated
probabilities are presented which take the context into account. Specifically, a second
hypothesis tested in Study 1 was that team location information would influence gambles on
the outcome of a football match. We predicted that choices would reveal a home win bias:
H2: Home win bets will be chosen more frequently than draws or away wins,
compared to the equivalent lottery options, even though stated probabilities were
Finally, background information and knowledge may also trigger different decision
strategies in sports gambling compared to lotteries. Previous process tracing studies have
found that most decision strategies adopted for lottery choices are compensatory, involving
trade-offs across gambles on the main risk dimensions, i.e., monetary gains and losses and
their associated probabilities (Montgomery, 1977; Ranyard, 1987, 1995). Studies of decision
under uncertainty, however, have identified a wider range of strategies employed. Three
studies are particularly relevant. First, Hogarth and Kunreuther (1995) compared decision
behaviour in conditions where precise stated probabilities were displayed to that in situations
where it was not presented at all. They reported that people selected more trade-off
arguments to justify their decision in the precise condition, and more ‘meta-strategy’
arguments, ones not dependent on risk dimensions, in the ignorance condition. Second, Huber
and Kühberger (1996) used the think aloud method to compare predecision processes and
mental representations in a lottery and three non-lottery tasks involving uncertainty. In two of
the non-lottery tasks, precise probabilities were stated for the possible outcomes but in the
third task they were not. Verbal protocols revealed that in the non-lottery tasks, people
introduced more background information and knowledge than they did in the lottery task. In
addition, differences were found in the frequency with which outcome probabilities were
evaluated. This was least in the non-lottery task in which outcome probabilities were not
presented, and most in the gamble task. Turning to the third study, Lipshitz and Strauss
(1997) found that participants used two types of strategy in making naturalistic decisions
involving uncertainty. One type involved assumption-based, or knowledge-based, reasoning
and the other compensatory evaluation.
In view of the above evidence, therefore, Study 2 was designed to explore decision
strategies in the lottery and sports gambling contexts and to identify ways they differed across
1. To what extent might knowledge-based decision strategies be applied in the sports
gamble context?
2. Do stated probabilities have the same role in strategies across lottery and sports
gambling contexts?
Although we expected to find evidence of knowledge-based strategies in the sports gambling
context, we did not at this stage predict how this would lead to differences in decision
behaviour. As well as exploring strategy differences, Study 2 aimed to seek evidence of the
cognitive mechanisms underlying the choice patterns observed in Study 1. To summarise,
then, in the next section we present Study 1 , a choice study testing two hypotheses predicting
differences in decision behaviour across gambling domains, and in the subsequent section, we
report Study 2, the parallel process tracing study incorporating the think-aloud method
(Ericsson & Simon, 1993; Payne, 1994).
Study 1
Method
Decision tasks and materials. The sports gambling context we used is typical of the
kinds of gambling opportunities available nowadays in the UK and other countries. Consider
the following football betting options available from UK bookmakers, based on an actual
match in the English Premier League (summarised in Table 1). The bookmaker offered fixed
odds on the three possible outcomes of the match as shown in the table. The odds define the
payoff-to-stake ratio for each outcome. For example, if someone decides to stake £2.00 on a
win for the home team (Aston Villa) the bookmaker would pay out £1.00 plus the return of
the stake if the home team won, otherwise the stake would be lost. Similarly, the payoff for a
£2.00 bet on a drawn match would be £6.00 and that for the same stake bet on the away win
--- Table 1 in here ---
The odds can also be interpreted as the bookmaker’s estimates of the likelihood ratio
of each outcome occurring or not. (It should be noted that since this is fixed-odds betting, the
bookmaker decides the odds before offering the bet, usually about 48 hours before the match
is played). As likelihood ratios, the odds in the example correspond to the outcome
probabilities shown in Table 1. Since there are only three outcomes, assuming the match is
neither postponed nor abandoned, the outcome probabilities should sum to 1.00. However,
they actually sum to 1.12, presumably to generate the bookmaker’s expected profit on the
transaction. The normalised probabilities shown in the right hand column of the table,
obtained by dividing the original estimates by 1.12, give more accurate (and coherent)
estimates of outcome probability. In the present studies, participants were presented with
these latter estimates, described as the opinions of experts, which we refer to as normalised
stated probabilities (NSPs). Note however, that in the naturalistic betting context only the
match odds are normally displayed.
Figure 1 gives an example of the display format used in our studies for sports betting
tasks. This format was used because equivalent laboratory lottery tasks, based on drawing a
numbered ticket at random, can be constructed from it. As shown, background information
was introduced by indicating which teams were playing at home or away. The lottery
equivalent to our sports betting example is illustrated in Figure 2. In this lottery, the player
must pick a ticket at random from a set numbered 1 to 100. They can choose from three
alternative lotteries: whether or not the ticket chosen will fall in Band A, in Band B or in
Band C. The instructions emphasised that for the lottery task the probabilities of winning
could be calculated exactly from the number of tickets in the draw, whereas for the football
task they were based upon experts’ predictions. Displayed information and other aspects of
involved in the football matches were not presented. The payoffs, odds and stated
probabilities (expressed as percentages) were exactly the same as in the sports betting
equivalent (Figure 1). The main differences, then, were in the gambling context, i.e. decision
under risk versus decision under uncertainty, and the presence of information on which teams
are playing at home or away in the sports context.
--- Figures 1 and 2 in here ---
Design and materials. A repeated measures design was used with type of gamble,
lottery versus football, being the main independent variable. We systematically varied the
stated probabilities of sports outcomes (NSPs) by selecting a set of actual football match
gambles varying in their pattern of odds. This information varied independently of team
location, home or away. Thus, seven pairs of equivalent gambles were constructed for the
main trials: odds, payoffs and expected values being exactly the same within each football –
raffle pair. They progressed smoothly from a pair in which the Home Win / Band A was the
strong favourite, through to a pair where the odds for a Home Win (or Band A) and an Away
Win (or Band C) were exactly the same, and then to three further trials where the odds for the
away team (or Band C) became increasingly shorter (see Appendix A). The basic dependent
variable was the choice made.
Participants were presented with two booklets, one containing the football trials and the
other containing the raffle trials. So as to avoid order effects, counterbalancing was adopted
whereby half the participants were presented with the booklet containing the raffle trials first
and the other half were given the booklets in the opposite order. Also, for each type of
gamble there were two booklet versions, each having trials in the reverse order of the other.
Furthermore, the ordering within football and raffle booklets differed so that participants
Participants. Thirty six female and 36 male adults participated, mainly students, both
young and mature (mean age = 32 years, SD = 11 years). In order to motivate genuine
consideration of choices, participants were paid £5 but had to use £2 of their fee as a stake on
their choice of gamble on a trial selected randomly at the end of the session.
Procedure. Participants were tested individually. The general nature of the study was
explained and participants read the detailed instructions. After resolution of any problems,
two practice trials were presented, one football and one non-equivalent raffle, and
participants made their choices. Envelopes were then produced and it was explained that each
one contained the outcome of either a real football match corresponding to the football
gamble, or an actual play of the lottery. In order to stress that payment would be determined
by real outcomes, the outcomes of the two practice trials were revealed and participants were
informed of how much money they would have won or lost if either choice had determined
their payment. Participants then worked through the first booklet of main trials at their own
pace, circling their choices on a response sheet. They were then allowed a brief rest before
completing the second booklet. Finally, participants were asked to choose at random one
envelope from a set of envelopes containing the gamble outcomes of the choices they had
made, and they were paid accordingly. The maximum amount that could be won was £15,
with the minimum payable being £3.
Results
The proportions of choices made for equivalent football and raffle gambles are shown
in Appendix A. The first analysis tested H1, the hypothesis that lottery choices would be
more risk-averse than sports gamble choices. A measure of risk aversion (RA) was devised,
based on the NSP of the chosen alternative. A choice of the riskiest option, with the lowest
probability of winning (NSP) was assigned a score –1; a choice of the most likely outcome,
NSP was assigned a score of zero. Then, for each participant, the mean RA averaged across
all trials of each type of gamble was calculated. Positive scores indicate a tendency to avoid
riskier alternatives, whereas negative scores indicate a risk-seeking tendency. In fact, contrary
to the hypothesis, the mean RA score indicated a slight risk-seeking tendency for lottery bets
(-.032) whereas for football bets the tendency was slightly risk-averse (.043). Given this
result, inferential analysis was not performed for this hypothesis.
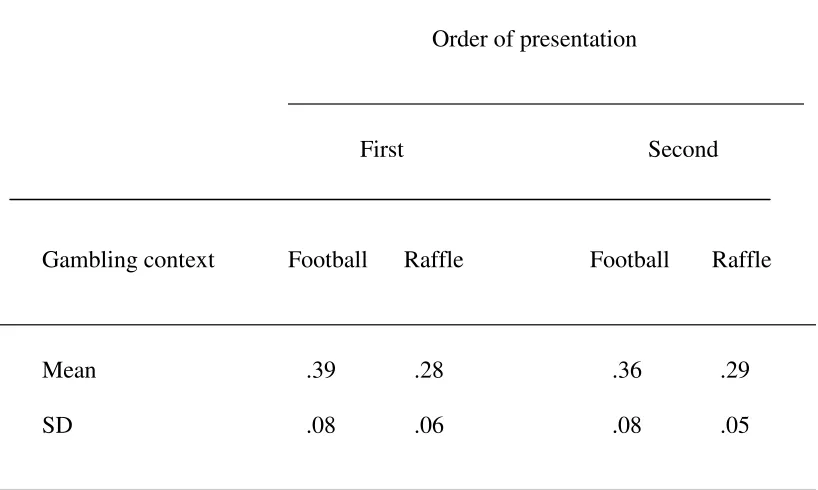
The second analysis tested H2, the Home Win bias hypothesis. The appendix shows
that for all seven gamble pairs participants chose the Home Win more often than they chose
the equivalent lottery option, Band A. To test the significance of this result, a 2 x 2 analysis
of variance was carried out. The first factor was order of presentation (football to raffle,
versus raffle to football gambles) and the second was gambling context (football or raffle).
The dependent variable was the mean proportion of Home Win or Band A choices for each
trial pair, with a log transformation applied. The non-transformed means for this analysis are
shown in Table 2. A significant main effect for trial type confirmed the presence of a Home
Win bias (F1,6 = 23.00, p < .01) with an effect size (η2) for the non-transformed data of 0.80.
The main effect of order of presentation was not significant (F1,6 = 0.36, p >.05, η2 for
non-transformed data = 0.05) and neither was the interaction between trial type and order of
presentation (F1,6 = 1.57, p >.05, η2 for non-transformed data = 0.17).
Thus, as Table 2 shows, irrespective of order of presentation, participants were
considerably more likely to choose the Home Win on football trials than Band A on raffle
trials. A further test of the Home Win bias was carried out at the level of the individual. A
two-tailed Wilcoxon Signed Ranks test showed that the difference between the median
number of Home Win and Band A choices made by each respondent across all trials was
significant (z = 3.35, p < .0005).
Discussion
The basic task our participants were set was to choose one of three win-lose gambles
which had equal, slightly negative, expected values. Our first hypothesis (H1), that the nature
of stated probabilities would cause lottery choices to be more risk-averse, was not supported.
In fact, the difference in risk-seeking across gambling contexts was in the opposite direction.
However, as predicted, for our second hypothesis (H2) we found a Home Win bias. Thus,
changing the context from lottery to sports gambling, and adding information as to whether a
team was playing at home or away, did have a significant effect on gambling choices.
Having obtained clear evidence of the Home Win bias in sports gamble choices, the
next step in our research strategy was to obtain verbal protocol evidence of the cognitive
mechanisms underlying this pattern of choices. Specifically, a probability revision
mechanism might operate in the uncertain sports gambling context, whereby the stated
outcome probabilities are integrated with background information and knowledge to produce
revised judged probabilities. Such a mechanism may not be triggered, however, if people
assume that the expert has taken all relevant information into account and that the stated
probability is the best estimate available. The first aim of Study 2, then, was to seek evidence
for a probability revision mechanism in think aloud protocols. As stated earlier, the second
aim was to describe the decision strategies in the lottery and sports gambling contexts and to
identify ways they might differ across contexts.
Study 2
This study, carried out several months after Study 1, was intended to be parallel to
that study in its essential features. This enabled us to test for the reactivity of the think aloud
bias. We decided to use a representative subset of participants from Study 1 in order to ensure
that individual strategy preferences underlying that study’s findings were represented. Apart
from the changes described below, the materials, design and procedure were the same as
those adopted in Study 1.
Method
Design and materials. Because protocol elicitation involved a longer procedure, the
number of trials was half that of the previous study. With only six trials, if the same
repeated-measures design had been used participants would probably have recognised that odds and
payoffs were the same across pairs of football and raffle trials. Therefore, an independent
groups design was adopted with type of gamble being the main independent variable. Two
matched sets of six trials were prepared each containing three football and three raffle trials
(Sets X and Y, see Appendix B). In two pairs the Home Win and Band A were the favourite,
in another two the Home and Away Wins and Bands A and C were equal favourites, and in
the remaining pairs the Away Win and Band C were the favourite.
Participants were divided into two groups, and were randomly allocated either Set X
or Set Y gambles. Although, as before, one dependent variable was the gamble chosen, the
main point of this study was to elicit and analyse verbal protocols. This had two components,
a pre-decision think aloud protocol and a post-decision summary. In the present article only
the think aloud protocols are relevant. The post-decision summaries were included as part of
a methodological evaluation of alternative verbal report elicitation techniques which is the
subject of a separate report.
Counterbalancing was implemented to mitigate order effects, with half the
participants in each group being given football trials first and half raffle trials first. Trial order
was also counterbalanced within subgroups and trial types. In order to enable the reactivity of
summaries after each trial and half did not. Testing for reactivity was important because if
providing a post-decision summary influenced the think aloud data, the value of the latter
would be compromised. The instruction sheet was broadly the same as that used in Study 1
apart from the addition of standard instructions to think aloud while completing the tasks
(Svenson, 1989).
Participants. A representative sample of 18 male and 18 female respondents (mainly
students), who had participated in either Study 1 or a similar pilot study, was recruited (mean
age = 40.5 years, SD = 15.33 years).
Procedure. Participants were first given a brief oral introduction and then a more
detailed written instruction sheet. Once any questions were answered, two practice trials were
presented which included thinking aloud. For alternate participants a post-decision summary
was elicited after each trial by the instruction: “Can you say in your own words how you
made your decision?” As in Study 1, participants were paid according to the result of a
randomly drawn trial.
Coding schemes for verbal protocols. Two content analyses of the verbal protocols
were carried out. For the main analysis, each pre-decision verbal protocol was transcribed
and segmented into separate statements. The secondary analysis was at the level of the whole
protocol (see below). The coding scheme for the statement level analysis was developed
through an iterative process. The initial scheme was based upon a priori notions of categories
that would be expected in the data. The two authors independently coded a set of protocols,
discussed areas of agreement and disagreement and revised the initial categories. A further
round of coding and consultation resulted in minor adjustments to produce the final scheme.
The authors then independently coded the protocols of six participants not previously used.
The Cohen’s Kappa of .88 for these codings signified a good level of agreement and so one
The statement analysis used 12 categories in five groups. The main group comprised
evaluative statements, either odds-based, referring to odds or probabilities, money-based,
referring to payoffs, or other evaluative statements. Odds-based and money-based statements
were further split into absolute and comparative categories. The former were evaluations of a
single aspect of a gamble, e.g. “The money is good” and use of evaluative terms such as
“only” when referring to payoffs or probabilities. The latter were statements comparing
payoffs or probabilities across gambles, including judgements of similarity or difference. The
other evaluations were split into: within-gamble comparisons of payoffs or probabilities, e.g.
“The money in A is good, but the chance of winning it is poor”; overall comparative, where
payoffs, odds and percentages were not referred to explicitly, or were referred to
simultaneously when comparing gambles; and overall absolute evaluations of gambles (e.g.
“this gamble is good”). The second group of categories consisted of knowledge-based
statements, split into: knowledge shared across society, including general knowledge of
football and randomness of raffles; and personal knowledge particular to an individual (e.g.
“13 is my lucky number”). The third broad category was that of unclear statements, i.e. those
where it was not readily apparent what the participant meant, incoherent and ambiguous
utterances, or not falling into any of the other categories. The final two categories were
recorded but not analysed further: statements where gamble information was read verbatim
and those expressing a decision.
The second analysis, based on the whole protocol, attempted to identify the major
type of processing that could be said to have influenced the decision. In situations where
there was ambiguity as to the category to which a protocol should be assigned, the coding
which most clearly and directly determined the decision was applied. After a number of
refinements, a Cohen’s Kappa of 0.64 was obtained for the relationship between the codings
protocol-level analysis is limited to a qualitative report illustrating the main decision
strategies identified.
Results
The Home Win bias observed in Study 1 was also found in Study 2. In four of the six
trial pairs a greater proportion of participants opted for Home Win choices on football trials
than opted for equivalent Band A choices on raffle trials. The mean proportion of Home Win
choices was 0.41 compared to 0.29 of Band A choices in the lottery trials. A one-tailed
Wilcoxon Signed Ranks test showed that the difference between the median number of Home
Win and Band A choices made by each respondent across all trials was significant (z = 1.70,
p < .05). This confirms that the think aloud method was not reactive with respect to the main
finding of Study 1. Also, the reactivity of the post-decision elicitation procedure was tested.
Since there was no evidence of reactivity, that is, no differences on various process measures
between the group providing post decision summaries and the group not providing them, data
from the two groups was pooled.
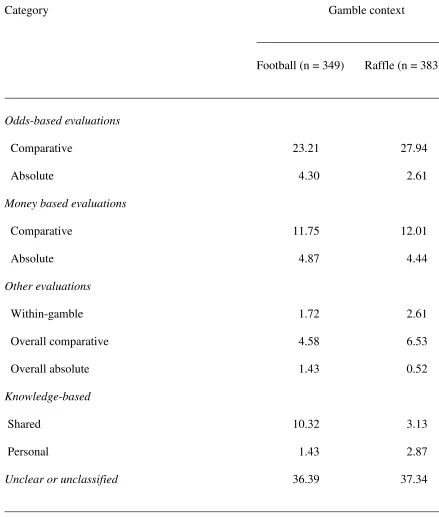
The final coding of the statement-level coding is summarised in Table 3. About one
third were unclear or unclassified, but of the more meaningful utterances, most were
evaluations of some kind, with evaluations of odds and percentage chances of winning
(odds-based in the table) accounting for about 30% of statements. Evaluations of winning payoffs
(money-based) accounted for a further 16%. As Table 3 shows, frequencies of most types of
utterance were similar across gamble type, but there were some differences across context, in
particular, rather fewer evaluations of odds and percentages and more shared knowledge
statements on the football trials.
--- Table 3 in here ---
The role of the main risk dimensions, payoffs and stated probabilities. In order to
context, the mean number of such utterances per person was calculated for each context. The
median number of these statements was greater on raffle than on football trials (0.50 versus
0.33) and a one-tailed Wilcoxon Signed Ranks test showed that this difference was
significant (z = 1.64, p < .05). A similar analysis for the mean number of money-based
evaluations showed a slightly greater number on raffle than on football trials (median values
0.25 versus 0.17), although a one-tailed Wilcoxon test found that the difference was not
significant (z = 0.69, p > .05). This indicates that outcome probabilities were evaluated less
frequently in decision under uncertainty compared to decision under risk.
The protocol-level coding was used to illustrate the decision strategies identified and
to elucidate the function of different types of statement in them. Almost half the decisions
made were classified as being based only on the main risk dimensions, as illustrated for both
gamble contexts in Table 4. Some were dominated by the evaluation of stated probabilities
and odds, some were money-based, and others were compensatory strategies involving both
risk dimensions. It can be seen that the decision strategies illustrated are rather similar across
gamble context.
--- Table 4 in here ---
The role of background knowledge. Table 3 shows that there was more processing of
shared knowledge in the football gambling decisions. Approximately 47% (17) of
participants made at least one shared knowledge statement on football trials compared to
about 17% (6) on raffle trials. A Wilcoxon test showed that for those participants making
such statements, this difference was significant (z = 3.40, p < .01, one-tailed). For football
gambles a post hoc analysis identified two sub-categories of statement, each produced by 11
participants: (a) Explicit indications of Home Win bias; and (b) General football knowledge.
Examples of protocols classified in the Home Win Bias category, that is, those in which such
illustrates that when the Home Win and the Away Win were equiprobable, knowledge of the
importance of team location was sometimes used in a tie-breaking capacity. In contrast, the
third protocol in Table 5 shows that knowledge of home team advantage was also used when
the away team was the favourite. This is direct evidence of the operation of a probability
revision mechanism: some participants used team location information to revise the stated
outcome probabilities.
Some statements in the second sub-category, General football knowledge, indicated
possible changes in evaluation strategy across gamble type. Examples of protocols using
team strength notions are shown at the bottom of Table 5.
---Table 5 in here ---
A second major type of knowledge contained in protocols was personal knowledge.
Such statements were less frequent than shared knowledge, with only 17% of the participants
making at least one such utterance on raffle trials and 11% on football trials. In all, these
utterances were observed on around 5% of the football and 8% of the lottery protocols. They
indicate that gamble information is sometimes restructured and related to the personal world,
and is not simply encoded in the manner presented.
General Discussion
Relatively complex choice tasks with the same basic structure as typical everyday
gambles involving risk and uncertainty were employed in these studies. Our experimental
manipulations removed most background information but included stated probabilities in
order to explore important questions concerning differences in decision processes across
gambling contexts. In Study 1, our main finding with respect to decision behaviour was that
home win bets were chosen significantly more frequently than draw or away win gambles,
protocol evidence of cognitive mechanisms underlying this choice pattern. The validity of
such data has been established in a range of tasks and has proved useful in elucidating the
processes underlying decisions in many domains, including decision under risk (Biggs,
Rosman & Sergenian, 1993; Ford, Schmitt, Schechtman, Hults & Doherty, 1989; Harte,
Westenberg & van Someren, 1994; Montgomery, 1977; Ranyard, 1987). We found that
evaluations of the main risk dimensions (monetary payoffs, odds and probabilities)
dominated verbal protocols in both gamble contexts. Nevertheless, in sports gambles,
participants made fewer evaluations of odds and probabilities, and more statements involving
shared knowledge. We interpret our findings in terms of mechanisms of stated probability
revision and knowledge-based strategies that can be triggered in decision under uncertainty
but are not available in the traditional lottery paradigm used to investigate decision under
risk.
With respect to probability revision, several participants in the process tracing study
explicitly referred to the greater likelihood of a Home Win or to the home team advantage in
sports events. Stated probabilities (NSPs) can be integrated with this knowledge to produce
the revised probabilities used in evaluation. A related line of research by Windschitl and
Weber (1999) has shown that in other tasks precise probability information interacts with
background information to influence probability judgment. It seems likely that the integration
of stated probabilities and background information is ubiquitous in important real life
decisions under uncertainty. People seem to readily modify the expert probabilities presented
to them even though these experts will have taken into account the information that people
use in these modifications.
Turning to evidence relevant to the role of knowledge-based strategies, the protocols
revealed evidence of such strategies specific to the sports gamble domain. Rather than
information to infer or judge the relative strengths of the home and away teams. Decision
strategies were indicated such as simply gambling on the stronger team, or, if they were
judged to be of similar strength, betting on a draw. Obviously, relative team strength and
win-probability are correlated, but this kind of knowledge-based thinking is qualitatively different
from the compensatory thinking balancing probabilities and outcome values implied by risk
dimension models such as prospect theory.
Clearly, however, as well as differences in decision strategy, there was also much
similarity across the two gambling contexts. In both cases, evaluations of the main risk
dimensions dominated and compensatory decision strategies were prominent. Huber and
Huber (2003) suggest that gambling is construed differently to many non-gambling tasks
involving risk and uncertainty. In their study, participants requested probability information
more in a lottery task because they expected to get useful information they saw as relevant to
their decision. Our data shows that in sports gambling also people see probability information
as important. The small difference we observed in the number of explicit probability
evaluations may have been because the outcome probabilities in the sports gambles were ill
defined compared to the raffle context. To investigate this interpretation further, future
research could manipulate this property of probabilities more extensively while controlling
other background information.
Returning to the question of strategies, Lipshitz and Strauss (1997) found, in their
study of naturalistic decisions involving uncertainty, that participants used two types of
decision strategy. One type involved assumption-based, or knowledge-based, reasoning and
the other compensatory evaluation. Our analysis of verbal protocols suggests that the use of
such qualitatively different types of thinking may be context dependent. While gambling of
all forms may be dominated by compensatory evaluation of risk dimensions, the domain of
In conclusion, Huber (1997, in press) and others have questioned the extent to which
findings from the lottery paradigm generalise to everyday decision problems involving
uncertainty. We conclude that the main reason lottery research may not generalise to such
decision tasks is that the lottery paradigm does not provide decision makers with the
opportunity to invoke their background knowledge, whereas most real world decision
domains do. For example, if the team names had been given in our sports gambling tasks this
would, for a follower of English professional football, have triggered an extensive body of
knowledge that would influence probability judgments and evaluation strategies. Huber
argued that decision making across a range of more naturalistic risk contexts needs to be
examined empirically, to augment the traditional focus on lottery gambling. Studies of the
influence of stated probabilities in different knowledge-rich contexts, including those in
which the credibility of stated probabilities is in doubt, would be a particularly promising
References
Biggs, S. F., Rosman, A. J., & Sergenian, G. K. (1993). Methodological issues in judgment
and decision-making research: Concurrent verbal protocol validity and simultaneous
traces of process. Journal of Behavioral Decision Making, 6, 187-206.
Camerer, C., & Weber, M. (1992). Recent developments in modelling preferences:
Uncertainty and ambiguity. Journal of Risk and Uncertainty, 5, 325-370.
Crozier, W. R., & Ranyard, R. (1997). Cognitive process models and explanations of decision
making. In R. Ranyard, W. R. Crozier & O. Svenson (Eds.), Decision making: Cognitive
models and explanations (pp. 5-20). London: Routledge.
Ericsson, K.A., & Simon, H.A. (1993). Protocol Analysis: Verbal Reports as Data (2nd ed.).
London: MIT Press.
Ford, K. J., Schmitt, N., Schechtman, S. L., Hults, B. M., & Doherty, M. L. (1989). Process
tracing methods: contributions, problems and neglected research questions.
Organizational Behavior and Human Decision Processes, 43, 75-117.
Fox, C. R. (1999). Strength of evidence, judged probability, and choice under uncertainty.
Cognitive Psychology, 38, 167-189.
Fox, C. R., & Tversky, A. (1995). Ambiguity aversion and comparative ignorance. Quarterly
Journal of Economics, 110, 585-603.
Fox, C. R., & Tversky, A. (1998). A belief-based account of decision under uncertainty.
Management Science, 44, 879-895.
Goldstein, W.M., & Weber, E. (1995). Content and discontent: Indications and implications
of domain specificity in preferential decision making. In J. Busemeyer, R. Hastie &
D. Medin (Eds.), The Psychology of Learning and Motivation, 32, 275-318.
Harte, J. M., Westenberg, R. M., & van Someren, M. (1994). Process models in decision
Heath, C., & Tversky, A. (1991). Preference and Belief: Ambiguity and competence in
choice under uncertainty. Journal of Risk and Uncertainty, 4, 5-28.
Hogarth, R., & Kunreuther, H. (1995). Decision making under ignorance: Arguing with
yourself. Journal of Risk and Uncertainty, 10, 15-36.
Huber, O. (1997). Beyond gambles and lotteries: Naturalistic risky decisions. In R. Ranyard,
W. R. Crozier & O. Svenson (Eds.), Decision making: Cognitive models and
explanations. (pp. 145-162). London: Routledge.
Huber, O. (in press). Risky decision making: Focus on risk defusing behavior. In F.
Columbus (Ed.), Advances in Psychology Research, 28. New York: Nova Science
Publishers.
Huber, O., & Huber, O. (2003). What makes gambles special? Active search for probability
and risk defusing information in gambles and quasi-realistic risky tasks. Unpublished
manuscript, University of Fribourg, Switzerland.
Huber, O., & Kühberger, A. (1996). Decision processes and decision trees in gambles and more
natural decision tasks. Journal of Psychology, 130, 229-236.
Keren, G., & Gerritsen, L. E. M. (1999). On the robustness and possible accounts of
ambiguity aversion. Acta Psychologica, 103, 125-148.
Lipshitz, R., & Strauss, O. (1997). Coping with uncertainty: a naturalistic decision making
analysis. Organizational Behavior and Human Decision Processes, 69, 149-163.
Lopes, L. L. (1983). Some thoughts on the psychological concept of risk. Journal of
Experimental Psychology: Human Perception and Performance, 9, 37-144.
Montgomery, H. (1977). A study of intransitive preference using a think aloud procedure. In
H. Jungerman & G. de Zeeuw (Eds.), Decision making and change in human affairs.
Payne, J. W. (1982). Contingent decision behaviour. Psychological Bulletin, 92, 382-402.
Payne, J. W. (1994). Thinking aloud: Insights into information processing. Psychological
Science, 5, 241-252.
Payne, J. W., Bettman, J. R., & Johnson, E. J. (1993). The adaptive decision maker. New
York: Cambridge University Press.
Ranyard, R. (1987). Cognitive processes underlying similarity effects in risky choice. Acta
Psychologica, 64, 25-38.
Ranyard, R. (1995). Reversals of preference between simple and compound risks: The role of
editing heuristics. Journal of Risk and Uncertainty, 11, 159-175.
Svenson, O. (1979). Process descriptions of decision making. Organizational Behavior and
Human Decision Processes, 23, 86-112.
Svenson, O. (1989). Eliciting and analyzing verbal protocols in process studies of judgement
and decision making. In H. Montgomery & O. Svenson (Eds.), Process and structure
in human decision making. Chichester: Wiley.
Svenson, O. (1996). Decision making and the search for fundamental psychological realities:
What can be learned from a process perspective? Organizational Behavior and
Human Decision Processes, 65, 252-267.
Svenson, O. (2003). Values, affect, and processes in human decision making: A
differentiation and consolidation theory perspective. In S. L. Schneider & J. Shanteau
(Eds.), Emerging perspectives on decision research. New York: Cambridge
University Press.
Tversky, A., & Fox, C. R. (1995). Weighing risk and uncertainty. Psychological Review, 102,
Windschitl, P.D., & Weber, E. U. (1999). The interpretation of “likely” depends on the
context, but “70%” = 70% -- right? The influence of associative processes on
perceived certainty. Journal of Experimental Psychology: Learning, Memory and
Author Note
We would like to thank Eileen Hill for help with data collection. This work was
supported by the Economic and Social Research Council of the United Kingdom, award L211
25 2051.
A report of Study 1 was presented at SPUDM-17, Mannheim, 1999. A report of Study
2 was presented at SPUDM-18, Amsterdam, 2001. We are grateful for the valuable and
constructive comments of SPUDM participants and anonymous reviewers.
Correspondence concerning this article should be addressed to Rob Ranyard,
Department of Psychology and Life Sciences, University of Bolton, Deane Rd., Bolton,
Lancs, BL3 5AB, UK. Telephone: +44 (0)1204 528851. Fax: +44 (0)1204 399074. E-mail:
Appendix A
Study 1: Stated Odds, Normalised Stated Probabilities (NSP) and
Choice Proportions for the Seven Pairs of Gambles
__________________________________________________________________________
Gamble pair Stated odds NSP Proportion of Choices
____________________
Football Raffle
__________________________________________________________________________
Pair 1
HW / A 4/9 .62 .38 .28
D / B 13/5 .25 .38 .40
AW / C 6/1 .13 .25 .32
Pair 2
HW / A 6/5 .41 .46 .36
D / B 9/4 .27 .19 .26
AW / C 9/5 .32 .35 .38
Pair 3
HW / A 6/4 .36 .29 .28
D / B 2/1 .30 .43 .46
AW / C 13/8 .34 .28 .26
__________________________________________________________________________
Appendix A continued:
__________________________________________________________________________
Gamble pair Stated odds NSP Proportion of Choices
____________________
Football Raffle
__________________________________________________________________________
Pair 4
HW / A 6/4 .36 .43 .25
D / B 11/5 .28 .40 .44
AW / C 6/4 .36 .17 .31
Pair 5
HW / A 13/8 .34 .43 .32
D / B 11/5 .28 .29 .36
AW / C 11/8 .38 .28 .32
Pair 6
HW / A 15/8 .31 .31 .22
D / B 11/5 .28 .26 .38
AW / C 6/5 .41 .43 .40
__________________________________________________________________________
Appendix A continued
_________________________________________________________________________
Gamble pair Stated odds NSP Proportion of Choices
___________________
Football Raffle
_________________________________________________________________________
Pair 7
HW / A 5/1 .15 .35 .28
D / B 9/4 .28 .31 .36
AW / C 4/7 .57 .35 .36
__________________________________________________________________________
Note. HW/A = Home Win or Band A, D/B = Draw or Band B; AW/C = Away Win or Band
C.
Appendix B
Study 2: Stated Odds and Normalised Probabilities (NSPs) for the Six Pairs of Gambles
____________________________________________________________
Gamble pair Stated odds NSP
____________________________________________________________
1 HW / A 11/10 .42
D / B 11/5 .28
AW / C 2/1 .30
2 HW / A 5/3 .34
D / B 11/6 .32
AW / C 5/3 .34
3 HW / A 7/4 .33
D / B 2/1 .30
AW / C 13/9 .37
4 HW / A 5/4 .40
D / B 9/4 .28
AW / C 7/4 .32
____________________________________________________________
Appendix B continued
____________________________________________________________
Gamble pair Stated odds NSP
____________________________________________________________
5 HW / A 7/5 .37
D / B 5/2 .26
AW / C 7/5 .37
6 HW / A 13/8 .33
D / B 2/1 .29
AW / C 5/4 .38
__________________________________________________________________
Note. Set X: football trials pairs 1, 2, 3; raffle trials pairs 4, 5, 6; Set Y: football trials pairs 4,
5, 6; raffle trials pairs 1, 2, 3.
Table 1
Odds offered by a bookmaker on outcomes of an English Premier League football match,
associated probabilities and normalised stated probabilities (NSP)
______________________________________________
Aston Villa (home) versus Bolton Wanderers (away)
______________________________________________
Outcome Odds Associated NSP
probability
______________________________________________
Home Win 1-2 .67 .60
Draw 3-1 .25 .22
Away Win 4-1 .20 .18
Table 2
Study 1: Mean choice proportions of the Home Win and equivalent Band A gamble, by
gambling context and presentation order
___________________________________________________________________
Order of presentation
___________________________________________
First Second
Gambling context Football Raffle Football Raffle
____________________________________________________________________
Mean .39 .28 .36 .29
SD .08 .06 .08 .05
Study 2, statement-level analysis: Definitions and percentages of statements in each main
category by gambling context
__________________________________________________________________________
Category Gamble context
_______________________________
Football (n = 349) Raffle (n = 383)
__________________________________________________________________________
Odds-based evaluations
Comparative 23.21 27.94
Absolute 4.30 2.61
Money based evaluations
Comparative 11.75 12.01
Absolute 4.87 4.44
Other evaluations
Within-gamble 1.72 2.61
Overall comparative 4.58 6.53
Overall absolute 1.43 0.52
Knowledge-based
Shared 10.32 3.13
Personal 1.43 2.87
Unclear or unclassified 36.39 37.34
Study 2: Examples of protocols dominated by odds-based, money-based, or compensatory processing
_________________________________________________________________________________________________________________
Odds based processing “Betting upon the outcome of a raffle again. There’s slightly bigger difference in percentages here, …[Pause]… I
think …[Pause]… I’m going to be … [Pause]… almost predictable and go for Band A, I’ll take sort of the middle
band of chance, shall we say, percentage chances and go for that.”
“home win, 13 to 8, draw 2 to 1, away win 5 to 4. Now I'm gonna have to do some quick mental arithmetic to find out
how close 13 to 8 is to 5 to 4 …[Pause]… 13 to 8 is still the best odds …[Pause]… Oh no it's not, 5 to 4’s better …
[Pause]… on an away win ... [Pause]… marginally …[Pause]… I’ll go for the away win.”
Money based processing “The outcome of a raffle. Band A ... [Pause]… Right now Band A is odds, and you get £1.50 for your £2 stake. B
would actually double it, and C. You'd only get 80p. I'd go for B. I'd be greedy.”
____________________________________________________________________________________________________________________
____________________________________________________________________________________________________________________
“Betting upon the outcome of a football match, the stake of £2 and the odds winning …[Pause]… a home win
…[Pause]… the odds of 7 to 5 which means I could win £2.80 for my £2. A draw is odds of 5 to 2, which means £5
for my £2 stake. And C, the away win, is £2.80. Well, both the home and the away win are £2.80 win for a £2 stake...
[Pause]… A draw of £5 compared to winning £2.80, I think, would make me go for B, the draw. So that's B.”
Compensatory processing “Betting upon the outcome of a raffle again. Band A is 1 to 33, could win £3.25, 34 to 62 could win £4, 63 to 100, £
2.50. Percentage chances at the bottom, 33 per cent, 29 per cent and 38 per cent. There’s not a lot of difference
between the percentages. The higher percentage is C, so I mean for £2.50, the lowest ones £3.25. Probably go for
Band B, it’s nearly a third chance for £4”.
“Home win 5 to 3, £3.33, draw 11 to 6, £3.67, away win same as A isn't it, 5 to 3. So again, looking at percentage
chances of winning ... [Pause]… I'm gonna go for B again, because it's only slightly less, the percentage chance of
winning, but there's slightly more to win. Okay, B.”
Study 2: Examples of protocols in the Home Win Bias and Football Knowledge categories
____________________________________________________________________________________________________________________
Home Win Bias “Draw odds 5 to 2, 26% ... [Pause]… Home win odds 7 to 5, could win £2.80. And that's the same for the away win ...
[Pause]… This time I'd like to go for the one with the highest percentage and the home win and the away win both have
the same percentage but I think I'd go for the home win because there's more, there's more chance of them winning at
home than away.”
“The first one, oh, those are equal odds. So.. I would go with A that time, cos they're equal odds, the home team is likely
to have an advantage …[Pause]… with the same odds, the…[Pause]… the home team is likely to be more …[Pause]… the
stronger team, being at home.”
__________________________________________________________________________________________________________________
___________________________________________________________________________________________________________________
“ that doesn't look too bad cos home wins tend to be the ones that are generally work out whatever the odds are, 7 to 4. B,
draw odds of 2 to 1, so you win £4 and a 30% chance of that so there's not much difference there between those two. And
C, an away win with odds of 13 to 9, which is quite a high ... [Pause]… you'd get £2.89 back. (pause) so 37% chance of an
away win ... [Pause]… Right well I'm not sure which of these to go for now because I'll my instinct is to go for a home
win which has a pretty good chance it's a 30% and it's not that much different than the away win which I reckon is, is not
all that favourable so I will go for home win, because, the home win seems to me of the three, it hasn't got the highest
chance of, highest estimated percentage chance but I think in real terms it's probably much more likely to be the outcome
of the game. So I'll go for a home win.”
__________________________________________________________________________________________________________________
___________________________________________________________________________________________________________________
Football Knowledge “The percentages, 40% of a home win, draw 28%, an away win 32% ... [Pause]… They're a stronger team, there could be
possibly be a stronger team at home, than, than away... [Pause]… the team that they play, the opponents ... [Pause]… of
one team …[Pause]… two teams, home win, one play team playing at home stronger than playing away. Their away
opponents …[Pause]… are quite good, draw, a draw's a possibility not good odds on the draw... [Pause]… There's a
definite result… [Pause]… Without knowing the teams I think I would go for a home win.”
“ I'm going for a …[Pause]… draw here, between two, between two teams, whoever they are, presumably ... [Pause]…
great teams like Arsenal or Liverpool, who end up doing a boring …[Pause]… so called nil, nil draw.”
________________________________________________________________________________________________________________
Figure 1. Sports gamble presentation format.
BETTING UPON THE OUTCOME OF A FOOTBALL MATCH
Given the information below, indicate your choice of gamble on the sheet provided.
STAKE OF £2.00
ODDS AND WINNINGS:
_________________________________________________________________
A. HOME WIN ODDS 1/2
YOU WOULD WIN £1.00 (+ YOUR £2.00 STAKE BACK)
_________________________________________________________________
_________________________________________________________________
B. DRAW ODDS 3/1
YOU WOULD WIN £6.00 (+ YOUR £2.00 STAKE BACK)
_________________________________________________________________
_________________________________________________________________
C. AWAY WIN ODDS 4/1
YOU WOULD WIN £8.00 (+ YOUR £2.00 STAKE BACK)
_________________________________________________________________
PERCENTAGE CHANCES:
HOME WIN DRAW AWAY WIN
BETTING UPON THE OUTCOME OF A RAFFLE
Given the information below, indicate your choice of gamble on the sheet provided.
STAKE OF £2.00
ODDS AND WINNINGS:
_________________________________________________________________
Band A TICKET NUMBERS 1-60 ODDS 1/2
YOU WOULD WIN £1.00 (+ YOUR £2.00 STAKE BACK)
_________________________________________________________________
_________________________________________________________________
Band B TICKET NUMBERS 61-82 ODDS 3/1
YOU WOULD WIN £6.00 (+ YOUR £2.00 STAKE BACK)
_________________________________________________________________
_________________________________________________________________
Band C TICKET NUMBERS 83-100 ODDS 4/1
YOU WOULD WIN £8.00 (+ YOUR £2.00 STAKE BACK)
_________________________________________________________________
PERCENTAGE CHANCES:
BAND A BAND B BAND C
60% 22% 18%