TECHNICAL NOTE
MAXIMUM ENTROPY ANALYSIS FOR G/G/1 QUEUING SYSTEM
M. Jain
Department of Mathematics, Institute of Basic Science
Dr. B. R. Ambedkar University, Agra-282002, India, madhujain@sancharnet in
M. R. Dhakad
Govt. Women’s Polytechnic, College Gwalior-474007, India, [email protected]
(Received: November 19, 2001 – Accepted in Revised Form: May 15, 2003)
Abstract This paper provides steady state queue-size distribution for a G/G/1 queue by using principle of maximum entropy. For this purpose we have used average queue length and normalizing condition as constraints to derive queue-size distribution.Ourresultsgivegood approximation as demonstrated by taking a numerical illustration. In particular case when square coefficient of variation of inter-arrival time is equal to one, the average queue length provided tallies with the results for M/G/1 model. Other particulars cases have also been deduced which match with already existing results.
Key Words Queue, G/G/1, Maximum Entropy, Queue Length, Lagrange’s Principle, Information Theory
ﻩﺪﻴﮑﭼ
ﻩﺪﻴﮑﭼ
ﻩﺪﻴﮑﭼ
ﻩﺪﻴﮑﭼ
ﻝﻮﻃﻊﻳﺯﻮﺗﻪﻟﺎﻘﻣﻦﻳﺍ ﻒﺻﻝﺪﻣﯼﺍﺮﺑﺭﺍﺪﻳﺎﭘﺖﻟﺎﺣ ﺭﺩﺍﺭﻒﺻ
G/G/1
ﺎﺑ ﻢﻤﻳﺰﮐﺎﻣﻝﻮﺻﺍﺯﺍﻩﺩﺎﻔﺘﺳﺍ
ﺍ
ﯽﻣ ﺍﺪﻴﭘﯽﭘﻭﺮﺘﻧ ﺪﻨﮐ
. ﻱﺍﺮﺑ
ﻥﺩﺮﮐ ﻩﺰﻴﻟﺎﻣﺮﻧﻁﺮﺷ ﻭﻒﺻﻝﻮﻃ ﻦﻴﮕﻧﺎﻴﻣﺯﺍﺭﻮﻈﻨﻣﻦﻳﺍ ﻡﺎﺠﻧﺍ ﻋﻪﺑ
ﺖﻳﺩﻭﺪﺤﻣﻥﺍﻮﻨ
ﯽﻣﻩﺩﺎﻔﺘﺳﺍ ﻮﺷ
ﺩ .
ﯽﻣﺪﻳﺎﻋﺍﺭﯽﺑﻮﺧﺞﻳﺎﺘﻧﻱﺩﺪﻋﯼﺎﻬﻟﺎﺜﻣﮏﻤﮐﻪﺑﻪﻟﺎﻘﻣ ﺩﺯﺎﺳ
. ﻪﮐﯼﺩﺭﺍﻮﻣﯼﺍﺮﺑ،ﺹﺎﺧﺖﻟﺎﺣﺭﺩ
ﻒﺻﻝﺪﻣﺞﻳﺎﺘﻧﺎﺑﻒﺻﻝﻮﻃﻦِﮕﻧﺎﻴﻣﺖﺳﺍﮏﻳﺮﺑﺍﺮﺑﺩﻭﺭﻭﻭﺩﻦﻴﺑﺎﻣﻥﺎﻣﺯﺕﺍﺮﻴﻴﻐﺗﺐﻳﺮﺿﻊﺑﺮﻣ M/G/1
ﻖﻓﺍﻮﺗ
ﺩﺭﺍﺩ . ﺰﻴﻧﺪﻧﺭﺍﺩﺩﻮﺟﻭﺮﺿﺎﺣﻝﺎﺣﺭﺩﻪﮐﯼﺮﮕﻳﺩﺹﺎﺧﺕﻻﺎﺣ ﺩﺭﺍﺩﺖﻘﺑﺎﻄﻣﻪﻟﺎﻘﻣﻦﻳﺍﺞﻳﺎﺘﻧﺎﺑﻭﻩﺪﺷﺝﺍﺮﺨﺘﺳﺍ
.
1. INTRODUCTION
The principle of maximum entropy (PME) is often useful for analyzing the complex queuing model in different frame-works. Based on the principle of sufficient reason, the principle of maximum entropy often employed to obtain equilibrium probabilities in terms of the first few moments of given distributions. Sometimes it provides exact queue length distribution as in case of M/M/1 model. The aim of this paper is to get the probability distribution of the G/G/1 queuing system by maximizing the corresponding entropy function. An attempt has been made to estimate probability distribution for G/G/1 model using principle of maximum entropy where prior information available is in the form of the mean arrival rate, mean service time and square coefficient of variation of inter-arrival and service
time distributions.
queue length distribution for the G/G/1 queue based on PME. Guiasu [5] presented a probabilistic model for M/G/1 queuing system using the maximum entropy principle subject to the constraints on the expected number of customers given by Pollaczek Khinchine formula. Tanyimboh and Templeman [18] calculated maximum entropy flows in networks. Tagliani [17] pointed out the application of maximum entropy to the moment’s problem. Wu and Chan [21] developed maximum entropy analysis of multiple-server queuing system model. Kouvatsos [10] gave a new analytic framework, based on PME for a stable G/G/1 queuing system at equilibrium when the constraints involve only the first two moments of the inter-arrival and service time distributions. Tsao et al [19] obtained the optimal entropy analysis. Currently Jain and Dhakad [7] analyzed queue size distribution for G/G/1 model using principal of maximum entropy.
Although many researchers have studied G/G/1 model but exact analytical expression for probability distribution of the number of customers in the system is not available. Many papers, which treated queuing models based on maximum entropy principle, are also restricted to deal with specific queuing situations and most often results obtained are in implicit form. In this study an effort has been made to present the probability distribution of the possible state for G/G/1 queue by PME corresponding to Jayne’s principle [8]. The explicit expression for the queue-size distribution is facilitated using first two moments of the inter-arrival and service-time distributions. The rest of the paper is organized as follows. The basic concepts of PME used for the formation of the G/G/1 model are discussed in section 2. In section 3 we drive steady queue-size distribution for the number of customers in the system. Some special cases are discussed in section 4. For particularmodels,numericalresultsareobtainedin section 5, and are summarized in tabular form. Finally the future scope and noble features of the study are remarked in section 6.
2. THE PRINCIPLE OF MAXIMUM ENTROPY (PME)
We know the finite discrete case of Shannon’s
entropy, which is given by Boltzmann’s H-function taking from statistical mechanics.
We define the entropy function as follows:
)
p
,...,
p
,
p
(
H
)
p
(
H
=
n 1 2 n =-p
log
p
1 k
k k
∑
=
n
(1)
where
H
(
p
)
is the amount of uncertainty contained by the probability distributionp
=
(
p
1,
p
2,...,
p
n)
, is known as system’s entropy function . The property of Shannon’s entropy is that)
n
1
,
...,
n
1
(
H
)
p
,...,
p
,
p
(
=
H
)
p
(
H
n 1 2 n≤
nwith equality if
p
k=
1
n
, (k=1,2,…,n).By this expression we notice that the uniform distribution is the most uncertain one when no constraint is imposed on the probability distribution. This relation is equal to Laplace’s principle of insufficient reason, which implies that the most reasonable strategy consists in attaching the same probability to different outcomes when we have no additional information about them.
Jayne’s [8] extended Laplace’s principle of sufficient reason by introducing the PME, which proves to be a non-linear entropy function 1 to be maximizes subject to the constraints
p
f
)
f
(
E
n1 k
k k
∑
=
=
(2)where
f
k,(
k
=
1
,
2
,...,
n
)
are weights which give information about moments in case of queuing theory. Also1
p
1 kk
=
∑
=
n
(3)
We select the probability distribution p=(p1, p2, ..., pn) that maximizes the corresponding entropy Relation 1.
given by 2 and 3. The solution of non-linear objective function 1 subject to constraints 2 and 3 is given by (see [13]).
p
k = 1/φ (β0) exp (-β0 fk ), k=1,2,…,nwhere
)
f
(-β
exp
)
(β
n 1 k k 0∑
==
φ
and β0 is unique solution of the equation
E(f)
)
(β
log
β
d
d
φ
=
−
(4)
In general, there is no analytical expression for the solution of the Equation 4. In case of queuing theory, we can obtain simple expressions for the probability distribution, which satisfies PME when prior information are available in terms of mean values.
The optimum property of the exponential distribution is known in information theory but it is not mentioned in the queuing theory. So here we give the statement of a lemma, which can be proved by using Taylor’s formula.
Lemma
For any t>0, there is τ, depending on t,which lies between 1 and t, such that
2
)
1
t
(
2
1
)
1
t
(
t
log
t
)
t
(
g
−
τ
+
−
=
=
(5)Proof
Since τ depending on t, lies between 1 andt, applying Taylor’s formula, we get
)
t
(
o
)
1
(
g
)
1
t
(
2
1
)
1
(
g
)
1
t
(
)
1
(
g
)
t
(
g
=
+
−
'+
−
2 ''+
so that we find
t
log
t
)
t
(
g
=
which implies (5).
We shall use of this lemma to prove the following theorem:
Theorem 1
If the arrival rate is λ then the PMEimplies that inter-arrival time follows exponential distribution.
Proof
We have expected inter-arrival time asλ
=
1
)
T
(
E
aLet fa be the probability density function of inter-arrival times Ta. According to PME in order to maximize the continuous entropy, we determine fa such that
∫
∞=
0a a
(
t
)
log
f
(
t
)
dt
f
H
Max
(6)subject to the constraints:
(i) The normalizing constraints
∫
∞=
0a
(
t
)
dt
1
f
(7)(ii) The mean arrival rate satisfies
∫
∞=
λ
0tf
a(
t
)
dt
1
(8)
By introducing Lagrange’s multipliers α >0 and β > 0 and applying 5, we obtain required result as follows:
∫
∫
∫
∞ ∞ ∞+
α
−
α
−
τ
+
+
α
−
α
−
=
+
α
+
−
=
λ
+
α
+
−
0 2 a 0 a 0 a adt
1]
-βt)
exp(
)
t
(
f
βt)[
exp(
2
1
dt
1]
-βt)
exp(
)
t
(
f
βt)[
exp(
dt
]
βt
)
t
(
f
)[log
t
(
f
1
.
β
1
.
H
∫
∫
∞ ∞−
−
−
=
+
−
−
≥
0 0βt)dt
exp(
1
dt
1]
-βt)
exp(
)
(
βt)[
exp(
α
α
α
f
at
which holds if and only if
fa (t)= exp (-α−βt) , t>0 (10)
From 7 and 10, we get
β
=
−
=
α
)
∫
∞exp(
βt
)
dt
1
/
exp(
0
or
α = - log β
Equation 10 implies that
fa(t) = β exp (-βt) (11)
From 8 and 11, we have
β= 1/λ
Equation 11 implies that
λ
−
λ
=
1
exp
t
)
t
(
f
aTherefore if the only information available at the input of a queuing system is arrival rate λ, the most uncertain distribution for inter-arrival time is exponential distribution with mean 1/λ. Similarly, we can prove that most uncertain distribution for service time is exponential if only information available is service rate.
Theorem 2
Let L be the expected number ofcustomers in the system. Then by using PME, the probability distribution of the state N of the system is
n
p
=prob(
N
=
n
)
=
L
n(
1
+
L
)
n+1(
n
=
0
,
1
,
2
,...)
(12)
Proof
We maximize the discrete countable entropyp
log
p
H
0 n
n n
∑
∞=
−
=
(13)subject to constraint
1
p
0n n
=
∑
∞ =(14)
and
p
n
L
0
n n
∑
∞ ==
(15)By applying theorem in 13 subject to 14 and 15, we obtain
n
p
= exp (-α−βn) (α>0 & β>0)(
n
=
0
,
1
,
2
,...)
(16) and
exp (-β) =
L
1
+
L
(17)Using Equations 16 and 17, we get required result 12.
3. MAXIMUM ENTROPY IN SINGLE SERVER QUEUING MODEL
Now we shall derive expression for steady state queue size distribution for G/G/1 model using PME. Consider G/G/1 queue with mean arrival rate
λ and mean service time 1/µ. Let
C
2a andC
2s be the square coefficient of variation of inter-arrival and service-time distributions. The average number of customers (L) in steady state is given by (see [4]).
ρ
−
+
ρ
+
ρ
=
)
1
(
2
)
C
C
(
1
L
2 s 2
a (18)
where
ρ=λ/µ
Applying PME and using Equation 12, the steady state probability distribution is obtained as
1 n 2 s 2 a 2 n
2 s 2 a n
n
) 1 ( 2
) C C ( 1
) 1 ( 2
) C C ( 1 p
+
ρ −
+ ρ + ρ +
ρ −
+ ρ + ρ =
4. SOME PARTICULAR CASES
We deduce the results of queue-size distribution
for some specific models by substituting the value of square coefficient of variation as follows:
TABLE 1. The Effect of Traffic Intensity (ρρρρ) on Probabilities for M/M/1 Model.
ρ
n
0.1
0.2
0.3
0.4
0.5
0.6
0 0.9000 0.8000 0.7000 0.6000 0.5000 0.4000
1 0.0900 0.1600 0.2100 0.2400 0.2500 0.2400
2 0.0090 0.0320 0.0630 0.0960 0.1250 0.1440
3 0.0009 0.0064 0.0189 0.0384 0.0625 0.0864
4 0.0000 0.0012 0.0056 0.0153 0.0312 0.0518
5 0.0000 0.0002 0.0017 0.0061 0.0156 0.0311
6 0.0000 0.0000 0.0005 0.0024 0.0078 0.0186
7 0.0000 0.0000 0.0001 0.0009 0.0039 0.0111
8 0.0000 0.0000 0.0000 0.0003 0.0019 0.0067
TABLE 2. The Effect of Traffic Intensity (ρρρρ) on Probabilities for M/E2/1 Model.
ρ
n
0.1
0.2
0.3
0.4
0.5
0.6
0 0.9022 0.8080 0.7161 0.6250 0.5333 0.4395
1 0.0881 0.1550 0.2032 0.2343 0.2488 0.2463
2 0.0086 0.0297 0.0577 0.0878 0.1161 0.1380
3 0.0008 0.0057 0.0163 0.0329 0.0542 0.0773
4 0.0000 0.0010 0.0046 0.0123 0.0252 0.0433
5 0.0000 0.0002 0.0013 0.0046 0.0118 0.0243
6 0.0000 0.0000 0.0003 0.0017 0.0055 0.0136
7 0.0000 0.0000 0.0001 0.0006 0.0025 0.0076
8 0.0000 0.0000 0.0000 0.0002 0.0012 0.0042
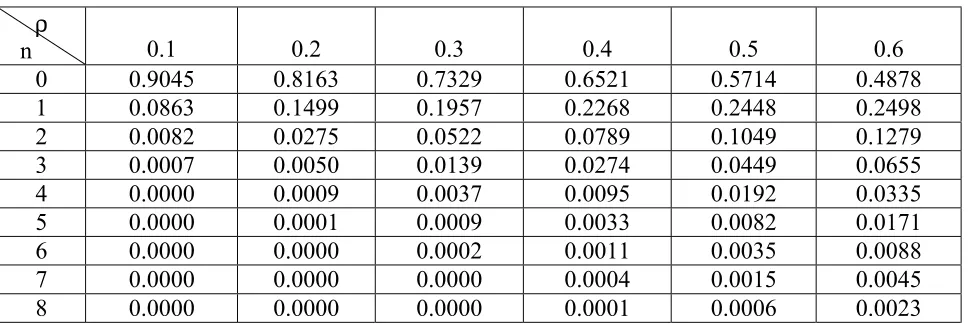
TABLE 3. The Effect of Traffic Intensity (ρρρρ) on Probabilities for E2/E2/1 Model.
ρ
n
0.1
0.2
0.3
0.4
0.5
0.6
(i)
M/G/1 Model
In this case C2 1a = so that Equation 19 yields:
TABLE 4. The Effect of Traffic Intensity (ρρρρ) on Probabilities for E2/D2/1 Model.
ρ
n
0.1
0.2
0.3
0.4
0.5
0.6
0 0.9067 0.8246 0.7504 0.6815 0.6149 0.5472
1 0.0845 0.1445 0.1872 0.2170 0.2367 0.2477
2 0.0078 0.0253 0.0467 0.0691 0.0911 0.1121
3 0.0007 0.0044 0.0116 0.0220 0.0351 0.0507
4 0.0000 0.0007 0.0029 0.0070 0.0135 0.0229
5 0.0000 0.0001 0.0007 0.0022 0.0052 0.0104
6 0.0000 0.0000 0.0001 0.0007 0.0020 0.0047
7 0.0000 0.0000 0.0000 0.0002 0.0007 0.0021
8 0.0000 0.0000 0.0000 0.0000 0.0001 0.0009
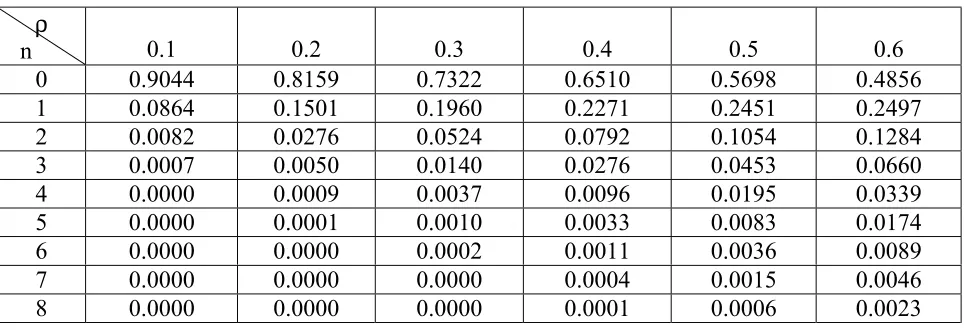
TABLE 5. The Effect of Traffic Intensity (ρρρρ) on Probabilities for G/E2/1 Model.
ρ
n
0.1
0.2
0.3
0.4
0.5
0.6
0 0.1066 0.8242 0.7495 0.6799 0.6125 0.5439
1 0.0846 0.1448 0.1877 0.2176 0.2373 0.2480
2 0.0078 0.0254 0.0117 0.0696 0.0919 0.1131
3 0.0007 0.0044 0.0029 0.0222 0.0356 0.0516
4 0.0000 0.0007 0.0007 0.0071 0.0138 0.0235
5 0.0000 0.0001 0.0001 0.0022 0.0053 0.0048
6 0.0000 0.0000 0.0000 0.0007 0.0020 0.0022
7 0.0000 0.0000 0.0000 0.0002 0.0008 0.0010
8 0.0000 0.0000 0.0000 0.0000 0.0003 0.0004
TABLE 6. The Effect of Traffic Intensity (ρρρρ) on Probabilities for M/G/1 Model.
ρ
n
0.1
0.2
0.3
0.4
0.5
0.6
1 n 2 s 2 n 2 s n n ) 1 ( 2 C 1 ) 1 ( 2 C 1 p + ρ − ρ + ρ + ρ − ρ + ρ = (20)
(ii)
M/M/1 Model
For this model, we substitute1 C and 1 C 2 s 2
a = = in Equation 19 and get
1 n 2 n n n
)
1
(
1
)
1
(
1
p
+
ρ
−
ρ
+
ρ
+
ρ
−
ρ
+
ρ
=
(21)(iii) G/M/1 Model
HereC
21
s
=
, so that we obtain from Equation191 n 2 a 2 n 2 a n n ) 1 ( 2 C 1 ) 1 ( 2 C 1 p + ρ − ρ + ρ + ρ − ρ + ρ = (22)
(iv) G/E
k/1 Model
For this caseC
2s=
1
/
k
. NowEquation 19 gives
1 n 2 a 2 n 2 a n n ) 1 ( 2 )) k 1 ( C ( 1 ) 1 ( 2 )) k 1 ( C ( 1 p + ρ − + ρ + ρ + ρ − + ρ + ρ = (23)
(v) M/E
k/1 Model
HereC
a2=
1
andC
s2=
1
/
k
so that 19 provides
1 n 2 n n n ) 1 ( 2 )) k 1 ( 1 ( 1 ) 1 ( 2 )) k 1 ( 1 ( 1 p + ρ − + ρ + ρ + ρ − + ρ + ρ = (24)
(vi) E
k/E
l/1 Model
For this model we putk
/
1
C
2a
=
andC
2s=
1
/
l
so as to obtain1 n 2 n n n ) 1 ( 2 )) l 1 ( ) k 1 ( ( 1 ) 1 ( 2 )) l / 1 ( ) k 1 ( ( 1 p + ρ − + ρ + ρ + ρ − + ρ + ρ = (25)
(vii) E
k/D/1 Model
Now we putC
a2=
1
/
k
and0
C
2s
=
, so thatp
nfor Ek/D/1 model are obtained as 1 n 2 n n n ) 1 ( k 2 1 ) 1 ( k 2 1 p + ρ − ρ + ρ + ρ − ρ + ρ = (26)5. NUMERICAL ILLUSTRATION
For illustration purpose we demonstrate the effect of traffic intensity (ρ) on probabilities for models M/M/1, M/E2/1, E2/E2/1, E2/D2/1, G/E2/1 and M/G/1, and the corresponding numerical results are presented in tables 1-6 respectively.
6. CONCLUSION
In this investigation we have constructed the queue-size probability distribution for G/G/1 model subject to constraints expressed in terms of mean arrival rate, mean service rate, square coefficient of variation of the distribution and mean number of customers in the system. By maximizing Shannon’s entropy, we have obtained explicit formula for the probability distribution. Numerical results provided indicate the simplicity of computational effort to prepare the ready reckoner for queue-size distribution. The extension of PME to Gx/G/1 is currently the subject of further study. It is realized that the PME can also be used to obtain the probability distribution of the number of customers in double-ended queuing systems.
7. REFERENCES
1. Cantor, J. L. “Information Theoretic Analysis for a Multi-Server Queuing System of Equilibrium with Application to Queue in Tandem”, M. Sc. Thesis, University of Maryland, (1984).
2. Chaudhary, M. L. and Templeton, J. G. C., “A First Course in Bulk Queues”, John Wiley & Sons, New York, (1983).
3. El–Affendi, M. A. and Kouvatsos, D. D., “A Maximum Entropy Analysis of the M/G/1 and G/M/1 Queuing Systems at Equilibrium”, Acta Info., Vol. 19, (1983), 339-355.
4. Gelenbe, E. and Pujole, G., “Introduction to Queuing Networks”, John Wiley, New York, (1987).
5. Guiasu, S. “Maximum Entropy Condition in Queuing Theory” J. Opl. Res. Soc., Vol. 37, (1986), 293-301. 6. Jain, M. “A Maximum Entropy Analysis for Mx/G/1
Queuing System at Equilibrium State”, J. KAU
Engineering Science, Vol. 10, No. 1, (1998), 57-65.
7. Jain, M. and Dhakad, M. R., “Queue Size Distribution for G/G/1 Model Using Principle of Maximum Entropy”, J.
Rajasthan Acad. Phy. Sci., Vol. 1, No. 3, (2002),
199-200.
Sci. Cybern., SSC-4, (1968), 227-241.
9. Kouvatsos, D. D., “Maximum Entropy Methods for General Queuing Networks”, In Modeling Techniques and Tools for Performance Analysis (D. Potier. Eds.), North-Holland, Amsterdam, (1985), 589-608.
10. Kouvatsos, D. D., “Maximum Entropy Analysis of the G/G/1 Queue at Equilibrium”, J. Opl. Res. Soc., Vol. 39, (1988), 183-200.
11. Kouvatsos, D. D., “A Maximum Entropy Queue Length Distribution for the G/G/1 Finite Capacity Queue”, Proc.
of Perf., ACM Sigmet., (1986), 224-236.
12. Kleinrock, L., “Queuing Systems”, Vol. I, John Wiley, New York, (1975).
13. Kapur, J. N. and Kesavan, H. K. “Entropy Optimization Principles with application”, Academic Press, INC., London, (1992).
14. Shannon, C. E. “A Mathematical Theory of Communication”, Bell Syst. Tech. J., Vol. 27, (1948), 379-423, 623-656.
15. Shore, J. E. and Johnson, R. W., “Axiomatic Derivation of
the Principle of Maximum Entropy and the Principle of the Minimum Cross-Entropy”, IEEE Trans. on
Information Theory IT, Vol. 26, (1980), 26-37.
16. Shore, J. E., “Information Theoretic Approximations for M/G/1 and G/G/1 Queuing Systems”, Acta Info., Vol. 17, (1982), 43-61.
17. Tagliani, A., “On the Application of Maximum Entropy to the Moments Problem”, J. Math. Phys., Vol. 34, (1993), 326-337.
18. Tanyimboh, T. T. and Templeman, A. B., “Calculating Maximum Entropy Flows in Networks”, J. Opl. Res. Soc., Vol. 44, No. 4, (1993), 383-396.
19. Tsao, H. S. J., Fang, S. C. and Lee, D. N., “On the Optimal Entropy Analysis”, European J. Oper. Res., Vol. 59, (1992), 324-329.