Predictability of properties of a fractured
geothermal reservoir: the opportunities
and limitations of an outcrop analogue study
Johanna F. Bauer
1*, Michael Krumbholz
1, Silke Meier
1,2and David C. Tanner
3Background
The most essential requirements for a geothermal reservoir are sufficient temperature and permeability (e.g. Jung et al. 2002; Paschen et al. 2003; Schulz 2011; Schulz et al.
2009). Whereas the geothermal gradient for a given region is commonly constrained to a sufficient degree, estimates of porosities, fracture systems, permeabilities, and therefore the achievable convective heat flow in a planned fractured reservoir are subject to large uncertainties (Agemar et al. 2012; Domenico and Palciauskas 1973). Permeability pro-vided by barren fractures, commonly referred to as structural permeability (e.g. Sibson
1996; Jolie et al. 2015), and thus the convective heat flow, may be substantially increased in fault-related reservoirs by locally enhanced fracture intensities and therefore create prime targets for geothermal exploration (Jung 2007; Paschen et al. 2003; Vidal et al.
Abstract
Minimizing exploration risk in deep geothermics is of great economic importance. Especially, knowledge about temperature and permeability of the reservoir is essen‑ tial. We test the potential of an outcrop analogue study to minimize uncertainties in prediction of the rock properties of a fractured reservoir in the Upper Rhine Graben. Our results show that although mineralogical composition, clay content, grain size, and fabric type are basically comparable, porosity and quartz cementation are not. Young’s modulus, as observed in the outcrop closest to the reservoir is about twice as high (~ 64 GPa) as observed in the reservoir (~ 34 GPa). Most importantly, however, the parameters that describe the fracture system, which are essential to predict reservoir permeability, differ significantly. While the outcrops are dominated by perpendicu‑ lar fracture sets (striking NE–SW and NW–SE), two different conjugate fracture sets (striking NW–SE and N–S) occur in the reservoir. Fracture apertures, as reported from the FMI, are one order of magnitude wider than in the outcrop. We conclude that our outcrop analogue study fails to predict important properties of the reservoir (such as permeability and porosity). This must be in part because of the tectonically complex setting of the reservoir. We propose that analogue studies are important, but they must be treated with care when attempting to predict the controlling parameters of a fractured reservoir.
Keywords: Geothermal energy, Geothermal exploration, Outcrop analogue study, Rock properties, Fracture system parameters, Upper Rhine Graben
Open Access
© The Author(s) 2017. This article is distributed under the terms of the Creative Commons Attribution 4.0 International License (http://creativecommons.org/licenses/by/4.0/), which permits unrestricted use, distribution, and reproduction in any medium, provided you give appropriate credit to the original author(s) and the source, provide a link to the Creative Commons license, and indicate if changes were made.
RESEARCH
*Correspondence: Johanna. Bauer@geo.uni‑goettingen.de
1 Department of Structural
2016). However, estimating the potential of a fractured hydrogeothermal reservoir is a major problem. This is because of the limited amount of data available to estimate the permeability in the subsurface and thus to predict achievable flow rates for geothermal power exploitation (at least 20 kg s−1 MW−1, Franco and Villani 2009). Permeability
val-ues are typically at best restricted to a small number of existing wells close to the envis-aged reservoir and not necessarily representative of larger volumes. It is thus inherent that the quality of predictions made on reservoir properties largely depends not only on the distance between exploration wells in the reservoir, but also on the heterogene-ity of the latter (e.g. Müller et al. 2010; Fitch et al. 2015). This holds particularly true for fluvial sedimentary rock sequences that are characterized by frequent changes of rock properties, both laterally and vertically (Morad et al. 2010). This is the case for the Lower Triassic (Buntsandstein) in the Upper Rhine Graben (URG), where lithostratigraphic correlations are further complicated by a complex system of fault block tectonics (Boigk and Schöneich 1970; Sauer et al. 1982; Villemin et al. 1986).
Predictions of heterogeneities on a larger scale from point information such as bore-hole logs have therefore large uncertainties. Geophysical methods, such as 2D or 3D reflection seismics, in contrast, provide continuous spatial information, which can be used to image large structural geological heterogeneities, such as faults. Due to their resolution, however, they can only provide limited data on small-scale structures such as fractures.
One common approach to reduce the observational gap between well and seismic data is to include outcrop data into the exploration strategy (Chesnaux et al. 2009; Howell et al. 2014; Philipp et al. 2010; Reinecker et al. 2015). The advantages of this approach are that, if good outcrops exist, lateral as well as vertical heterogeneities of rock- and fracture system properties can be observed in detail. These properties are challenging or even impossible to sample adequately using borehole logs and in general they are invis-ible to seismics.
An outcrop will always be different from its subsurface analogue, even if it exposes age-equivalent rocks, since it must have experienced a different burial/uplift history and thus different diagenetic conditions. In addition, outcrops are not always available in the desired size, quality, and/or quantity.
Consequently, the resolution of the different methods used to analyse a reservoir needs to be scaled accordingly. For instance, the scale of observation is important with respect to fracture orientation. While (sub)recent microcrack orientations are com-monly consistent over large volumes (e.g. Vollbrecht et al. 1994; Krumbholz et al. 2014a) and therefore predictable, larger fractures have usually a more complex history and thus exhibit more variable systematics. A direct implication is that the strength of the rocks is also scale dependent (Krumbholz et al. 2014b).
However, outcrop studies only provide limited 2D/3D information and it is necessary for the observed rock properties to be corrected to be comparable with the conditions at reservoir depth. In addition, the deformation history of the target formation may be different from that of the outcrop. For instance, faults at depth may juxtapose rock units, but possibly not in the outcrop.
intensity in a fault zone often increases towards the fault core, and with increasing fault displacement (e.g. Faulkner et al. 2011; Hull 1988; Reyer et al. 2012; Shipton et al.
2013). Thus, damage zones of large-scale fault zones are prime targets for geother-mal exploration. When evaluating fault properties, it is, however, crucial to take into account that (1) faults and fault zones may act either as conduits, barriers, or as com-bined conduit–barrier systems for fluid flow (e.g. Caine et al. 1996; Chester and Logan
1986; Evans et al. 1997; Farrell et al. 2014) and (2) the characteristics of faults and brit-tle fault zones can vary considerably, even on small spatial scale (e.g. Caine et al. 1996; Faulkner et al. 2010; Laubach et al. 2014; Schulz and Evans 2000). Consequently, reli-able prediction of the structural inventory of faults and its hydrological impact on the planned geothermal reservoir is crucial. Given the amount of parameters needed to be investigated to predict the properties of fractured and fault-related reservoirs, careful selection of outcrop analogues is essential to ensure their comparability to the reser-voir under exploration.
This study focusses on the rock properties and fracture system parameters in outcrops and compares them with equivalent reservoir data. The study was carried out in the Lower Triassic of the Upper Rhine Graben (URG), a potential, but still underexplored target for geothermal exploitation. Outcrop data are compared with reservoir informa-tion from the geothermal well Brühl GT1 within the URG, close to the eastern graben shoulder. In total, four outcrops on the eastern and western graben shoulders were selected; they belong to the Lower to Middle Buntsandstein (Fig. 1).
We analyse the rock parameters that directly control the reservoir performance, they are porosity, and fracture system parameters, such as mineralization, orientation, inten-sity, and aperture. Other rock parameters, such as tensile strength, Young’s modulus, and uniaxial compressive strength are of interest from an engineering point of view, e.g. in terms of borehole stability or in case reservoir stimulation becomes necessary.
Fig. 1 a Location of the URG. b Solid geological map of the study area. The locations of the outcrops studied (LS Leistadt, CL Cleebourg, RS Riesenstein, KF Kammerforster) are indicated by red dots, and the geothermal well Brühl GT1 is represented by a blue diamond (map modified after Eisbacher and Fielitz 2010). c Permo‑ Carboniferous troughs and highs in the URG. Black lines indicate Variscan fault traces (after Schumacher
Site descriptions and methods Regional geology and geothermal setting
The URG is part of the European Cenozoic Rift System and strikes NNE–SSW, its length is about 300 km, and it is about 30–40 km wide (e.g. Illies 1977; Schumacher 2002; Zie-gler 1992; Fig. 1).
The structural pre-rift setting of the URG was established during the Variscan Orog-eny; Permo-Carboniferous wrench tectonics formed NE- to ENE-trending fault zones (e.g. Schumacher 2002; Schwarz and Henk 2005; Ziegler 1990). These fault zones form the boundaries of the Variscan Internides and Permo-Carboniferous troughs and highs (Fig. 1c). Early Carboniferous, NNE- to SSW-oriented, sinistral shear zones are asso-ciated with Lower Carboniferous to Permian intrusive bodies (Vosges, Black Forest, Odenwald; e.g. Schumacher 2002; Schwarz and Henk 2005; Ziegler 1990).
The formation of the URG in the Cenozoic occurred in two main phases and was con-trolled by multiphase reactivation of Variscan and Permo-Carboniferous discontinuities (e.g. Illies 1972; Schumacher 2002; Ziegler et al. 2006). The first rifting phase occurred during the Late Eocene until Late Oligocene, and was characterized by NW–SE- to WNW–ESE-directed extension (e.g. Schwarz and Henk 2005; Ziegler 1992; Ziegler and Dèzes 2006). The second main phase of graben formation began in Early Miocene and was marked by reorientation of the stress field to NE–SW extension. As a consequence, the major graben-forming faults are characterized by sinistral and dextral oblique dis-placements, local inversion, and normal displacements (Illies and Greiner 1979; Schu-macher 2002). Uplift and erosion was limited to the central and southern parts of the URG, while subsidence and sedimentation shifted southwards during the Miocene (Bartz 1974; Pflug 1982). The recent maximum horizontal stress component in the URG is NW–SE to NNW–SSE oriented (Heidbach et al. 2008). However, fault plane solutions reveal a change in faulting regime from dominantly strike-slip faulting in the southern part to a combination of strike-slip and extensional movement in the northern URG (Larroque et al. 1987; Plenefisch and Bonjer 1997).
several lithostratigraphic classifications of the Buntsandstein units exist (e.g. Backhaus
1974; Hagdorn and Nitsch 2009; Richter-Bernburg 1974). Within the URG, the regional geothermal gradient is elevated to 45–50 °C km-1, with local hot spots that have
temper-ature gradients of up to 100 °C km−1 and make the URG a prime target for geothermal
exploration in Germany (Schellschmidt and Clauser 1996; Stober and Bucher 2014). This positive temperature anomaly is commonly explained by a raised Moho due to the gra-ben formation (Brun et al. 1992) or by advective fluid flow (Schellschmidt and Clauser
1996; Pribnow and Schellschmidt 2000).
Study area
The graben shoulders expose Triassic rocks of Lower to Upper Buntsandstein. The out-crops studied (Figs. 1, 2) comprise one outcrop with a fault zone (Fig. 2a; Cleebourg) and one without an exposed fault zone (Fig. 2b; Leistadt) on the western graben shoulder. On the eastern graben shoulder, two additional outcrops without fault zone exposure were studied (Fig. 2c; Riesenstein and Kammerforster).
The location of the geothermal well Brühl GT1 is southwest of Heidelberg, approxi-mately 12 km west of the eastern graben shoulder (Fig. 1a, d). The thickness of the res-ervoir is 162 m and lies between 3157 and 3319 m measured depth (MD), close to a system of three NNW-, W-, and NE-dipping transtensional faults that are part of a nega-tive flower structure (Lotz 2014). The targeted reservoir zone is intersected by an 80° westwards-dipping transtensional fault. The normal vertical displacement of this fault is approximately 70 m (Reinecker et al. 2015), although the strike-slip component is unknown.
Methods
Outcrop‑based methods
In this study, we used classic structural geological fieldwork, including mechanical rock property measurements, and optical microscopy, which included image analysis of selected thin sections of rock samples.
Standard parameters of the fracture system were recorded using scan line and win-dow-sampling methods (e.g. Adler et al. 2013; Priest 1993; Terzaghi 1965). The recorded fracture system parameters include orientation, intensity (number of fractures per meter), connectivity, aperture, and whether the fractures are cemented or not.
Laboratory‑based methods
16 rock samples were taken: 12 from the outcrop at Cleebourg, 1 from Leistadt, 2 from Riesenstein, and 1 from Kammerforster. From each of the samples, at least six right-cir-cular cylinders were taken for mechanical testing. The rocks were classified according to their fabric type after Miall (1977), and dried samples were used to determine the ultrasonic shear-wave velocity (vs), uniaxial compressive strength (UCS), static Young’s
modulus (E), tensile strength (T0), and bulk density (ρb). Transient times of shear-wave
velocities were measured at a frequency of 0.25 MHz. The compression tests were car-ried out according to ISRM 1989 (Fairhurst and Hudson 1989) and the indirect tensile strength was measured using a Brazilian test after ISRM 1981 (Brown 1981). The bulk densities of the samples were calculated using their mass to volume ratios.
For comparison of petrophysical and petrographical properties, 24 thin sections of the samples from Cleebourg were saturated with blue resin. Using optical microscopy, we determined porosity, cementation, grain size, and mineralogical composition. For pet-rographical quantification of the rock, thin sections were analysed using classical point counting (300 points) and classified after McBride (1963). Petrographic analyses of rock samples of the other outcrops (Leistadt, Riesenstein, and Kammerforster) were previ-ously performed by Soyk (2015).
Porosity and grain size were assessed by digital image analysis with the software ImageJ (Rasband 2011). An optical scan of each thin section with a resolution of 300 dpi was taken under plane polarized light. To distinguish between the grains and the dyed resin-filled pore space, a binary image was calculated, with white pixels representing the grains and black pix-els the pore space. The porosity was then calculated as an area fraction in ImageJ. The sizes of about 100 grains along a scan line were measured and classified after Wentworth (1922). While our 2D approach cannot compete with the accuracy of 3D analysis, e.g. Berg et al. (2016), Sahagian and Proussevitch (1998) concluded that, in the majority of cases, the accu-racy of 2D porosity estimates can be considered sufficiently close to 3D results.
Analytical methods
To estimate the matrix permeability (Km) in the reservoir from the properties determined in
the outcrop study, the porosity–permeability relation (Kozeny–Carman, Eq. 1) was utilized,
in which θ is the porosity and d50 is the mean grain size (Freeze and Cherry 1979).
To estimate the structural permeability in analytical models, it is an accepted approach to approximate naturally rough fractures by parallel plates with a constant aperture and to apply the cubic law (e.g. Bear 1993; Snow 1965, 1969; Witherspoon et al. 1980). Conse-quently, the permeability (Kf) of sets of differently oriented fractures was estimated using:
where L is the profile length [m] and b is the fracture aperture [m] (Bear 1993).
(1) Km =
θ3
(1−θ )2
d502 180 m2 , (2) Kf =
Reservoir‑based methods
The reservoir formation was analysed based on drill cuttings, i.e. no core was taken, but pumping and injection tests and standard wireline logging were carried out.
The geophysical logging devices that were used are listed in Table 1. The logs are avail-able for the uppermost 140 m of the reservoir section.
The density-correction log from the LDS tool records the absolute deviation from the measured bulk density. For deviations larger than 15 (kg m−3), the determined bulk
den-sity was found to be not reliable and corresponding well sections were rejected during the evaluation of the bulk density and, thus, also for calculations of bulk porosity and the dynamic elastic parameters. The logging quality was further evaluated by the well caliper from the FMI tool. In the places where the well caliper returned values that deviate more than 15% from the bit size (> 0.22 m, < 0.16 m), log signals from the LDS were found to affect the bulk density measurements and therefore rejected in further interpretation.
Density or bulk porosity Φb was determined using a quartz-equivalent rock density
(ρmatrix) of 2650 kg m−3, a formation fluid density (ρfluid) of 1170 kg m−3, and the meas-ured bulk density log
ρlog
after Schlumberger (1989):
The sonic or matrix porosity Φm was estimated with the Wyllie time-average method
using p-wave velocities (Schlumberger 1989). This method requires an estimate of fluid and matrix travel times (tfluid = 607 μs m−1, tmatrix = 182 μs m−1) and compares these with travel times measured in the reservoir (tlog):
Since sonic log-derived porosities largely ignore secondary porosity, such as fractures, and the density log responds primarily to the bulk porosity, the difference was used to calculate the fracture porosity, referred to as the secondary porosity index (SPI) of the reservoir (Schlumberger 1989).
To compare the bulk densities of the dried surface samples and the fluid saturated rocks in the well, the log measurements were corrected by replacing the water-filled pores with air.
(3)
Φb=
ρmatrix−ρlog
ρmatrix −ρfluid [−].
(4) Φm=
�tlog−�tmatrix
�tfluid −�tmatrix
[−].
Table 1 Wireline-logging tools used in this study
GR gamma ray, FMI formation micro imager, DSI dipole sonic imager, LDS litho density sonde, MD measured depth
Tool Log interval (MD) (m) Measurements of Evaluation of
GR 3305–3150 Natural gamma rays Sand/clay content, depth correlation of the various logging tools
FMI 3295–3150 Electrical resistance, well caliper Sedimentary facies, detection of open/ closed fractures, fracture orientation, fracture intensity, fracture apertures DSI 3293–3150 Compressional‑ and shear‑wave
velocities Matrix porosity, elastic mechanical rock properties, lithology LDS 3294–3150 Emitted gamma rays, Compton scat‑
Elastic properties of the reservoir rock include dynamic Young’s modulus (Ed). It is
derived from the measured densities and elastic wave velocities (compressional- vp and
shear-wave velocity vs):
The formation structural permeability was determined equivalent to outcrop calcula-tions, using the cubic law (Eq. 2). Data on fracture apertures and densities are based on FMI images; data on fracture mineralization was analysed using a combination of FMI, LDS, and DSI, provided by J. Reinecker (GeoT). The results were compared with deter-mined bulk permeabilities from pumping and injection tests. The reservoir transmissiv-ity is specified as follows:
and the formation permeability [m2] as
where Q is the production rate (m3 s−1), S the pressure reduction (m), H the reser-voir height, ρf the fluid density (kg m−3), g the acceleration due to gravity (m s−2), and
η (kg m−1 s−1) the dynamic fluid viscosity (Kruseman and Ridder 1992). Outcrop properties
Rock properties
Whereas the Triassic sandstones in outcrops on the western graben shoulder are yellow-ish, brownish to red coloured, and, in some cases, they are totally bleached, the inves-tigated sandstones from the eastern flank are red, and not, or only slightly, bleached. Typical fabric types of the studied rock samples comprise trough cross-bedding, partly with mudstone intraclasts (St) and low-angle (< 10°) cross-bedding (Sl). Both fabric types are interbedded by thin silty claystone layers.
Despite different lithostratigraphies, the mineralogical compositions for all studied outcrops cluster narrowly in the fields of subarkose and lithic subarkose; the Leistadt samples show an increased amount of lithic components (Fig. 3).
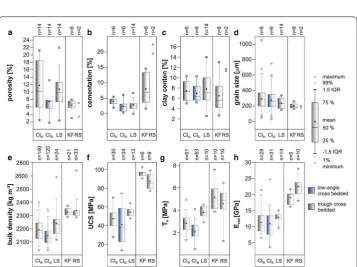
Rock porosity estimations based on image analysis show that the rock porosities at the eastern flank have only minor variations and lie between 3 and 8%: the porosities estimated at the western flank vary between 2 and 22% (Fig. 4a). Quartz cementation at the western flank does not exceed 7% and covers only a small range, in contrast to the eastern flank, where the cementation lies between 2 and 23% (Fig. 4b). The average clay content lies in a narrow range between 6 and 8% for the outcrops of Cleebourg, Leistadt, and Riesenstein. Only in the Kammerforster outcrop is the clay content of 12% significantly higher (Fig. 4c). The corresponding API values (from gamma-ray measure-ments) in the outcrops lie in the range of 77–95 (Reinecker et al. 2015). The grain size is medium sand with a slight tendency to finer sand in the easterly outcrops, and sorting is (5) Ed=ρvs2·
3vp2−4vs2
v2 p−v2s
[Pa].
(6) T =
2.3·Q 4π·�s
m2s−1
(7)
K=
T H ·
η ρfg
moderate to well (Fig. 4d). The bulk densities are lower on the western graben shoulder, with mean values for the outcrops ranging from 2150 to 2240 kg m−3. On the eastern
graben shoulder, the mean bulk density lies between 2330 and 2340 kg m−3 (Fig. 4e).
Fig. 3 Modal composition of sandstone samples from the different locations in a QFL diagram, after McBride (1963). The sandstone compositions of Leistadt, Riesenstein, and Kammerforster are adopted from Soyk (2015)
Notably, the low-angle cross-bedded sandstones (Sl) in Cleebourg have in general higher porosities, bulk densities, and quartz cementations compared with the trough cross-bedded sandstones (St).
The mechanical properties determined include uniaxial compressive strength (UCS) , indirect tensile strength (T0), and static Young’s modulus (Estat). The properties exhibit comparable values on the western graben shoulder (UCS: 41.0–54.3 MPa; T0: 2.1–
3.8 MPa; Estat: 10.8–12.8 GPa), but on the eastern graben shoulder they are consistently about twice as large (UCS: 80–100 MPa; T0: 4–7 MPa; Estat: 15–25 MPa). The only excep-tion is the indirect tensile strength (T0), where the difference between the eastern and
western outcrops is smaller, but still considerable. In general, there is a clear tendency that the mechanical rock properties increase eastwards (Fig. 4f–h). Accordingly, sonic velocity (vs) follows the same trend as static Young’s modulus and also increases towards
the east (Figs. 4h, 5a). Assuming a typical vp/vs ratio of about 1.7 for sandstones (Pickett 1963), we calculated the dynamic Young’s modulus. The mean values range from 35 GPa in Cleebourg to 64 GPa in Kammerforster (Fig. 5b) and are thus two to four times higher than the corresponding static measurements.
Fracture system parameters
NE- to SW-striking fractures are present at all the different locations (Fig. 6). In addi-tion to this, a small group of fractures strike NW–SE in the Leistadt and Kammerforster outcrops (Fig. 6b, c). In Leistadt, the NE- to SW-striking fracture set is the main set, whereas in Kammerforster the NW- to SE-oriented set appears to dominate.
Notably in the Cleebourg outcrop (Fig. 6a), within fault zone exposure, the orientation of the main fracture set seems to be layer specific, i.e. in layers 1 and 2 the fractures are sub-parallel to the fault, whereas in layer 3 the dominant fracture orientation is about 30–40° rotated clockwise compared to layers 1 and 2 and the fault (Fig. 7).
The mean fracture intensities in the outcrops without fault zone exposure on the east-ern graben shoulder do not exceed 0.8 m−1, compared to up to 1.2 m−1 in Leistadt on
the western graben shoulder. In the Cleebourg outcrop with fault zone exposure, the mean fracture intensity is 3.3 m−1 in the damage zone and, in two of three measured
layers, shows increasing fracture intensity towards the fault plane (Fig. 7). In layer 1, the fracture intensity reaches a maximum of 27 m−1 in the vicinity of the fault plane, but in
layer 3 the maximum is only 9 m−1.
For Cleebourg, background parameters of the fracture system cannot be provided, due to the limited extent of the outcrop. However, in the outcrops without fault zone expo-sure, larger blocks that are almost fracture free occur, in contrast to the Cleebourg out-crop (Table 2).
Fig. 6 Fracture orientation data shown in equal area‑scaled rose diagrams with 10° bin size and in pole plots (equal area, lower hemisphere). a Cleebourg (CL) fracture orientation data with the strike of the main fault (bold line) and minor faults (dashed lines) marked, b Leistadt (LS), c Kammerforster (KF), and d Riesenstein (RS)
The highest fracture connectivity occurs within the fault zone in Cleebourg, where 49% of all measured fractures are interconnected. In the proximity of the fault core, i.e. within 5 m distance, the amount of connected fractures rises to 66%. In contrast, in outcrops without fault zone exposure, only 20–40% of the fractures are interconnected (Table 2).
The vast majority of the observed fractures were not affected by mineralization. We observed 7% mineralized fractures only in the western outcrops (Table 2; Fig. 8). This mineralization comprises mostly quartz and baryte.
The mean fracture aperture in Cleebourg is about 0.8 mm, and therefore lower than in Leistadt at 1.0 mm. In Leistadt, the widest fracture apertures occur in fractures classified as partially open. They reach a maximum aperture of 14 mm and belong to the NW- to SE-striking set. In Cleebourg, the maximum fracture aperture is 7 mm and was observed in the N- to S-striking fracture set, close to the fault plane (Fig. 8).
Permeability data
Matrix permeabilities of the outcrops, calculated using Eq. 1, range between 2·10−13 and
8·10−13 m2 for the western outcrops, with the highest values determined for the Leistadt samples, followed by St and Sl samples from Cleebourg (see “Rock properties” section). The matrix permeabilities at the eastern outcrops are about one order of magnitude lower (Fig. 9).
Structural permeabilities, derived using Eq. 2, range between 10−10 and 10−13 m2 for
Cleebourg and from 10−9 to 10−15 m2 in Leistadt, for the different fracture sets. Since
fracture intensity and apertures in Cleebourg increase towards the fault plane, calculated fracture permeabilities follow this same trend. The main orientations of enhanced frac-ture permeabilities in Cleebourg change from N to S close to the fault core to NE–SW in the damage zone. In Leistadt, the estimated maximum fracture permeability was deter-mined for the NW- to SE-oriented fracture set and reaches values about one order of magnitude higher with respect to Cleebourg.
Reservoir properties Rock properties
For depths between 3150 and 3282 m (MD), which covers almost the complete vertical extent of the reservoir, drill cuttings are available. From the cuttings, the rocks encoun-tered in the well were classified as light red to red-brownish sandstones, with grain sizes that reach from silt to coarse-grained sand which is well to poorly sorted. The mineral-ogical composition of the cuttings is predominantly subarkosic with low to tight porosity
Table 2 Summary of fracture intensity, mineralization, and connectivity for the outcrops studied
Outcrop Fracture intensity (m−1) Amount of mineralization (%) Connectivity (%) Mean Min Max None Partial open Full
Cleebourg 3.3 0 27 87 6 7 49
Leistadt 1.2 0 5 89 7 4 40
Kammerforster 0.7 0 3 100 0 0 35
and high cementation (Reinecker et al. 2015). Typical sedimentary fabric types from FMI image logs comprise an alternation of horizontally and cross-bedded sandstone beds, interbedded by thin silty claystones (Reinecker et al. 2015).
The values of the gamma-ray log range between 20 and 104 API. Most values lie in a range between 35 and 83 API (mean 60 API), with the lowest values in the middle of the reservoir. The strongest variations in the gamma-ray log occur at about 3270 to 3280 m and in the uppermost 20 m of the reservoir. There are two intervals with considerably higher API: 3180–3200 m and 3240–3270 m (Fig. 10a).
The recorded vp/vs ratios range from 1.0 to 2.9 (Fig. 10b). The majority of the forma-tion has vp/vs ratios between 1.6 and 1.8, which are typical values for clean sandstone, whereas higher ratios may indicate higher clay content (Pickett 1963). Equivalent to the gamma-ray log, the vp/vs ratio shows strong variation at about 3200 m, between 3270
and 3280 m, and in the top 20 m of the well log (Fig. 10).
The log data presented in Figs. 11 and 12 are complete datasets. Data found to be unreliable are indicated as dashed lines (see “Methods” section) and were not included in further evaluation.
The calculated bulk densities under dry conditions in the reservoir lie between 1143 and 2648 kg m−3 (mean 2323 kg m−3), with the majority of data falling in the range
between 2070 and 2534 kg m−3 (Fig. 11a). The bulk porosity, calculated according to
Eq. 3, varies from 0 to 58% (mean about 13%). Most of the determined porosity data lie between 5 and 22%. There is a slight tendency towards higher bulk porosities with increasing depth until about 3240 m, below which the porosity decreases. Matrix poros-ity (Eq. 4) varies in the range of 0 to 48% (mean 16%). Common values lie between 3 and 27%. The bulk porosities document a higher variability with depth, compared to the matrix porosity. Over large parts of the reservoir formation, however, the calculated bulk porosity is lower than the matrix porosity (Fig. 11b, d).
The dynamic Young’s modulus of the reservoir formation was derived from DSI and LDS logs (Eq. 5). Even after removing unreliable data (see “Methods”), the deter-mined Young’s modulus covers a wide range of 2–71 GPa, where the majority of data lie between 20 and 46 GPa and have a mean value of 34 GPa (Fig. 12).
Fracture system parameters
Fracture properties measured based on FMI logs comprise orientation, intensity, aper-ture, and mineralization (analysed and provided by J. Reinecker). Two different fracture systems, separated at a depth of 3270 m, were identified.
Above 3270 m, the main fracture set strikes NW–SE to NNW–SSE and may consti-tute a conjugate fracture set. Most of the fractures dip sub-vertically, and only a small amount dip less than 80°. Below 3270 m, the fractures are differently oriented. Although the fractures probably also form a conjugate set, the strike of the fractures is rotated clockwise to a N to NNE direction. The dip component is considerably shallower, i.e. less than 80°, compared to the set above 3270 m (Fig. 13).
A large amount of the fractures are partially mineralized (46%) or completely closed by mineralization (13%). The observed fracture apertures span 3–22 mm (mean 8.5 mm). The largest apertures were detected for partly mineralized fractures, which deviate, in terms of orientation, by about 20° anticlockwise from the main fracture set above and by 40–50° below 3270 m (Fig. 12e, f). The maximum horizontal stress direction in the reservoir is about N 150° (Reinecker et al. 2015). This means fractures striking 30° coun-terclockwise from the main horizontal stress direction show the largest apertures.
The vertical fracture intensity varies between 0 and 6 m−1 (mean about 0.3 m−1).
Fractures seem to concentrate in four intervals, i.e. there are depth intervals that differ
Fig. 10 Vertical bore logs of lithological and mineralogical properties and the corresponding histograms. a
considerably with respect to fracture intensity (Fig. 14a). Decreasing fracture aperture with increasing depth, i.e. due to increasing confining pressure, is not observed.
Fracture porosity, as determined using the secondary porosity index (see “Methods”), lies in a range between − 26 and 43% with a mean of − 3% (Fig. 14b), even if data classi-fied as unreliable are excluded. However, excluding negative fracture porosity, the mean fracture porosity is 5%.
Comparison of fracture apertures from FMI with the secondary porosity index (SPI) shows that high SPI values do not correspond to the higher amounts of detected frac-tures or vice versa (Fig. 14).
Reservoir permeability
Increased mud loss between 3200 and 3282 m depth and total mud loss below 3282 m depth indicates drastically increased permeability at this depth (Reinecker et al. 2015, Fig. 14). The high permeability was confirmed and quantified by injection and produc-tion tests.
In the production test, 1000 m3 thermal water was produced in 15,480 s (4 h and
18 min), which corresponds to an average production rate (Q) of 65 l s−1. At the
maxi-mum production rate of 70 l s−1, the pressure drop was 0.28 MPa, equivalent to a
pro-ductivity index of 29 l s−1 bar−1. During the injection test, 3084 m3 water was injected at
2.6 MPa within 61,920 s (17 h and 12 min), i.e. with a mean rate of 50 l s−1. The
maxi-mum injection rate was 90 l s−1, which resulted in an injectivity index of 3.6 l s−1 bar−1.
The skin effect of the borehole is estimated from the difference between the pressure in
the well before and directly after shut-in and amounts to 2.3 MPa. If the skin effect of the well is neglected, the injectivity index is 30 l s−1 bar−1. In consequence, the reservoir
transmissivity (Eq. 6) reaches values of about 4.6·10−4 m2 s−1, whereas the mean
inte-grated reservoir permeability is about 7.2·10−14 m2 according to Eq. (7).
Discussion
The aim of this study was to evaluate to what extent the concept of outcrop analogue studies, as commonly applied in hydrocarbon exploration (Budding and Inglin 1981; Keogh et al. 2007), could be used to improve predictions about the quality of geothermal reservoirs, with focus on permeability.
Lithology
The comparison of outcrop and well data shows that rock properties that determine lithology, such as mineralogical composition and grain size, are in good agreement, despite some uncertainties in stratigraphic correlation. All rocks analysed fall into the fields of subarkose and lithic subarkose (Fig. 3), with medium to fine grain size, and a tendency for finer grain size towards the east (Fig. 4d), as previously reported (Reinecker et al. 2015; Soyk 2015). The rocks in the reservoir cover a somewhat wider range of grain
size and are less well sorted (Reinecker et al. 2015). The similar API values for the out-crops (77–97 API) and the reservoir rocks (35–85 API; Reinecker et al. 2015) show that the clay contents are comparable. Also, the rock facies, as confirmed by fabric types, are comparable between surface and subsurface (Reinecker et al. 2015).
Fig. 13 Fracture properties derived from the FMI log (analysed and provided by J. Reinecker). a, b The fracture orientations, above and below 3270 m depth, respectively, in equal area‑scaled rose diagrams with 10° bin size. The dashed red line shows the strike of the fault that cuts through the reservoir. c, d The cor‑ responding pole plots (equal area, lower hemisphere) with the great circle showing the fault orientation. e, f
Cementation and porosity
Quartz cementation, which has a direct effect on rock properties, such as density, poros-ity, and strength, has a trend at the surface that increases from west (3–7%) to east (3–23%; Fig. 5b). These findings agree with observations made by Soyk (2015) and with the observations in the reservoir, where the quartz cementation of cuttings is described as high (Reinecker et al. 2015). However, the highly variable quartz cementation in the eastern outcrops does not cause high variability in porosity (3–8%) and density (2117–2592 kg m3; Fig. 4a, b). In the west, a wide range in porosity is observed (2–22%),
where the quartz cementation is well defined in a narrow range (Fig. 4). In the reservoir, “high” quartz cementation is accompanied by a highly variable matrix porosity (0–27%,
Fig. 11d). Thus, even though direct correlation between porosity and cementation is impossible for the reservoir, since cementation has only been reported from drill cut-tings, the cementation to porosity ratio appears to be inconsistent with that observed at the surface. Rock density seems to be comparable between reservoir and the eastern outcrops. The fact that strong variation in cementation does not cause strong variation in porosity might be due to the fact that during diagenesis, the rocks were subjected to different conditions. While early cementation may initially reduce the matrix poros-ity, during burial it may also counteract further porosity loss due to compaction. Conse-quently, late cementation may cause high cementation rates in rocks that already have been compacted, i.e. that already have low porosity (e.g. Ehrenberg 1989; Molenaar et al.
2007; Ramm and Bjorlykke 1994).
Differences in the burial and thermal history of the Buntsandstein (e.g. Clauer et al.
2008; Rupf and Nitsch 2008; Soyk 2015; Steingötter 2005) and thus regional diagene-sis have been described for the URG. Furthermore, the complex structural geology has likely caused strong heterogeneities, e.g. along deep-seated faults that may provide pre-ferred pathways for fluids and thus have locally strong effects on cementation and poros-ity. Thus, the prediction of porosity and cementation, in a lateral and vertical sense, is difficult for the Buntsandstein of the URG. However, in a less complex structural situ-ation, with knowledge of original rock composition, thermal, and diagenetic history, it may be possible to better predict porosity.
Rock mechanical properties
The values determined for tensile and compressive strength from the outcrop samples follow a trend that is consistent with increasing quartz cementation and decreasing porosity from east to west (Figs. 4, 5). Average dynamic Young’s moduli determined for the outcrops span from 35 GPa in the west to 64 GPa in the east (Figs. 4, 5). In the reser-voir, the determined average dynamic Young’s modulus is 34 GPa (Fig. 12). This means the outcrops closest to the reservoir have dynamic Young’s moduli almost twice as high as those obtained from the reservoir. Since dynamic as well as static Young’s moduli increase with depth (e.g. Carlson and Gangi 1985; Holt et al. 2005), Young’s modulus at reservoir depth should therefore be higher than at the surface. Thus, Young’s modulus at reservoir depth has been highly underestimated. This agrees with the high porosity (e.g. Dunn et al. 1973; Palchik 1999; Palchik and Hatzor 2004), as reported from the well logs, but not with the high quartz cementation reported from the drill cuttings. The other rock mechanical parameters cannot be compared since measurements of tensile and compressive strength are not feasible in the well. However, based on the poor correlation of porosity, cementation, and density, one can expect that they are also highly variable in the reservoir.
Variable mechanical rock properties also influence the development of fracture sys-tems (Gross and Eyal 2007; Gross et al. 1995; Laubach et al. 2009; Narr and Suppe 1991; Odling et al. 1999). Since fracture systems, besides matrix permeability, are most essen-tial in geothermal energy, because they provide a large part of the permeability (e.g. Bear
Fracture system parameters and permeability
The fracture orientations derived from the outcrops in this study show a degree of simi-larity; for instance, a common NE–SW set exists, and in three of the four outcrops a sec-ond NW–SE group occurs (Fig. 6). However, other studies carried out in this region (e.g. Dezayes et al. 2015; Meier et al. 2015; Peters 2007) show that a wider range of fracture patterns have been observed in this area. In addition, we found that in the Cleebourg out-crop with fault zone exposure, individual layers host different fracture systems (Figure 7). Both observations suggest that the permeability-controlling fracture patterns are diffi-cult to predict in the study area. This assumption is further supported by the two frac-ture patterns that were identified in the well, based on FMI data (Fig. 13; Reinecker et al.
2015). None of these fracture patterns coincides with those observed at the surface. At a depth of about 3275 m, i.e. the depth at which total mud loss occurred, and where the API values are increased (Fig. 10a), a fault is expected based on the seismics (Lotz 2014). We propose that it is likely that this fracture system belongs to the damage zone of the fault, rather than reflecting the regional trend.
The fracture intensity is comparable among the outcrops, but significantly increases in Cleebourg where a fault is exposed. The same holds for the fracture connectivity, which is highest in Cleebourg. In the Brühl GT1 well, the upper fracture system appears to be dominated by a conjugate sub-vertical fracture set, and is thus likely to be poorly con-nected. This assumption is supported by the low to moderate mud loss in this section. In the lower fracture system, in contrast, the fractures dip shallower and have a higher vari-ability in strike, which favours better connectivity (Fig. 13), supported by the increasing mud loss at this depth (Fig. 14b). However, from the FMI log, as well as from the second-ary porosity index (fracture porosity), increased fracture intensity, at the depth where the fault is expected, cannot be confirmed (Fig. 14b).
The average fracture apertures observed at the surface range from 0.8 mm in Clee-bourg (range 0.1–7 mm), to 1.0 mm in Leistadt (range 0.1–14 mm), whereas the aper-tures derived from the FMI are, on average, 8.5 mm (range 3–22 mm; Figs. 8, 13, and
14a). Thus, the apertures at depth are reported to be about one magnitude of order larger, despite the higher confining pressure. When utilizing these data, and using the cubic law (Eq. 2) to roughly estimate and compare structural permeabilities between outcrop and reservoir conditions, we show that the structural permeability for the different fracture orientations in the outcrops lies between 10−9 and 10−15 m2 (Leistadt), and 10−10 and
10−13 m2 (Cleebourg). In the reservoir, based on FMI, it is in the range of 10−9–10−11 m2.
The bulk permeability of the reservoir determined by the pumping tests is 10−14 m2, and
thus estimates of the structural permeability, only based on FMI, are three to five orders too high, but close to outcrop data. This apparent overestimation of bulk permeability by FMI might, for example, result from excessive tool standoffs due to bad hole condi-tions or to the common enlargement of fractures close to the well (e.g. Luthi and Souhaité
1990). Notably, also the fracture porosity of about 5% determined with the SPI is about three orders higher than typical values (e.g. Snow 1968; Van Golf-Racht 1982). This and the fact that SPI values and FMI fracture locations do not correspond are strong indica-tors for technical problems and/or bad hole conditions during logging.
1969; Witherspoon et al. 1980). These may be at least to a certain degree provided by partly mineralized fractures, or by fractures favourably oriented to the present-day stress field. Partially mineralized fractures and fractures sub-parallel to the recent major stress direction are both reported to provide larger apertures (e.g. Heffer and Lean 1993; Lau-bach et al. 2004; Marrett et al. 2007; Singhal and Gupta 2010; Teufel et al. 1991, Figs. 8,
13). The observations in the outcrop Leistadt and in the reservoir confirmed that partly mineralized apertures are wider compared to barren fractures. However, aperture and the main horizontal stress direction do not correlate in general. For instance, the wid-est fracture apertures in the Leistadt outcrop are (sub)parallel to the regional maximum horizontal stress direction, while they deviate in Cleebourg by about 45° and in the well by about 30° counterclockwise from the maximum horizontal stress direction. Reasons for the observed mismatch at the surface could be disturbances in the local stress field caused by topography or faults (Barton and Zoback, 1994). The mismatch in the reser-voir, where the present-day stress orientation was determined by borehole breakouts, shows that the concept, even under perfect conditions, is not generally applicable and should thus be applied with caution. Fractures that have an acute angle of about 20–30° to the maximum horizontal stress direction, as observed in the well, are subject to a high shear component. It has been shown, for example, by Barton et al. (1995) and Rogers (2003) that such fractures can constitute preferable pathways for fluid flow. Noteworthy, also fracture sets normal to the maximum compressive stress were reported by Laubach et al. (2016) to provide high permeabilities over long time spans.
Summary and conclusions
It is commonly thought that, if an outcrop is of the same formation and depositional facies, it may serve as an analogue to derive in-depth knowledge about the conditions in the envisaged reservoir. However, this statement on outcrop analogue studies constitutes the classic "chicken and egg problem”, because the appropriateness of any given outcrop is unknown until the reservoir itself has been analysed. This requires that the cost-inten-sive drilling process is at least advanced before analogue outcrops are sought out.
In the example presented here, the comparison of the data derived from outcrop and well logs shows that, in particular, the most relevant parameters for geothermal energy exploitation, i.e. the fracture system and porosity, show notable differences and cannot be extrapolated from the surface to reservoir depth. We conclude that the concept of outcrop analogue studies, based on standard methods, has, in this case, limited potential to minimize exploration risk for this fault-related geothermal reservoir.
The main reasons for the differences in observations are attributed to three facts. Firstly, the URG is a complex geological area, i.e. the area underwent a multiphase deformation history, and is characterized by sedimentary rocks that show strong facies changes at a small scale. Given, however, a less complex setting, knowledge of original rock composition, thermal history, and fracture timing should improve comparison and prediction of cementation (Lander et al. 2008; Lander and Laubach 2015) and thus allow mechanical rock properties to be better determined.
their interplay, e.g. host rock lithology, displacement, pre-existing structures, tempera-ture, depth, time, and stress conditions (e.g. Bense et al. 2013; Caine et al. 1996; Faulkner et al. 2010; Lunn et al. 2008; Schulz and Evans 2000; Shipton and Cowie 2001).
We conclude that in our study area the outcrops are simply unfavourable as a reser-voir analogue. Aiming for fault-related fractured reserreser-voirs can, under the right circum-stances, promise increased structural permeability, but at the same time this significantly lowers the chance to predict the reservoir conditions from surface outcrops. Conversely, outcrop analogue studies have a higher potential to produce meaningful results in homogenous areas such as large basins that do not have complex internal structures.
To further improve the concept of analogue studies, the next step must be to iden-tify ranges within which essential parameters must be determined, to allow for an early evaluation of the quality of a reservoir.
Authors’ contributions
The manuscript was written by JFB, MK, and DCT; field work was carried out by JFB and SM; laboratory experiments were carried out by JFB; discussion of data was done by JFK, MK, SM, and DCT; and all authors commented on the manuscript. All authors read and approved the final manuscript.
Author details
1 Department of Structural Geology and Geodynamics, Geoscience Centre, Georg‑August‑University of Göttingen, Gold‑
schmidtstr. 3, 37077 Göttingen, Germany. 2 Present Address: Dr. Pelzer und Partner, Lilly‑Reich‑Str. 5, 31137 Hildesheim,
Germany. 3 Leibniz Institute for Applied Geophysics (LIAG), Stilleweg 2, 30655 Hannover, Germany.
Acknowledgements
We thank Prof. Dr. S. Siegesmund for permission to use the tectonic laboratory and Dr. J. Reinecker for providing well data and discussion of the results. Three anonymous reviewers are thanked for their concise and constructive reviews. Competing interests
The authors declare that they have no competing interests. Availability of data and materials
All data analysed in this study are presented in the manuscript. Consent for publication
Not applicable.
Ethics approval and consent to participate Not applicable.
Funding
The study is part of the AuGE project (Outcrop Analogue Studies in Geothermal Exploration) funded by the German Federal Ministry for Economic Affairs and Energy (BMWi) within the framework of the 5th Energy Research Program (FKZ: 0325302).
Publisher’s Note
Springer Nature remains neutral with regard to jurisdictional claims in published maps and institutional affiliations.
Received: 13 June 2017 Accepted: 26 October 2017
References
Adler PM, Thovert J‑F, Mourzenko VV. Fractured porous media. Oxford: Oxford University Press; 2013.
Agemar T, Schellschmidt R, Schulz R. Subsurface temperature distribution in Germany. Geothermics. 2012;44:65–77. https://doi.org/10.1016/j.geothermics.2012.07.002.
Backhaus E. Limnische und fluviatile Sedimentation im südwestdeutschen Buntsandstein. Geol Rundsch. 1974;63(3):925– 42. https://doi.org/10.1007/bf01821318.
Barton CA, Zoback MD. Stress perturbations associated with active faults penetrated by boreholes: possible evi‑ dence for near complete stress drop and a new technique for stress magnitude measurement. J Geophys Res. 1994;99(B5):9373–90. https://doi.org/10.1029/93JB03359.
Bartz J (1974) Die Mächtigkeit des Quartärs im Oberrheingraben. In: Illies JH, Fuchs K (eds) Approaches to taphrogenesis: proceedings of an international Rift symposium held in Karlsruhe. Schweizerbart, Stuttgart, p. 78–87.
Bear J. Modelling flow and contaminant transport in fractured rocks. In: Bear J, Tsang CF, de Marsily G, editors. Flow and contaminant transport in fractured rock. New York: Academic Press; 1993. p. 1–37.
Bense VF, Gleeson T, Loveless SE, Bour O, Scibek J. Fault zone hydrogeology. Earth Sci Rev. 2013;127:171–92. https://doi. org/10.1016/j.earscirev.2013.09.008.
Berg SE, Troll VR, Deegan FM, Burchardt S, Krumbholz M, Mancini L, Polacci M, Carracedo JC, Soler V, Arzilli F, Brun F. Heterogeneous vesiculation of 2011 El Hierro xeno‑pumice revealed by X‑ray computed microtomography. Bull Volcanol. 2016;78(85). https://doi.org/10.1007/s00445‑016‑1080‑x.
Boigk H, Schöneich H. Die Tiefenlage der Permbasis im nördlichen Teil des Oberrheingrabens. In: Illies JH, Mueller S (eds) Graben Problems: Proceedings of an International Rift Symposium held in Karlsruhe 1968. Stuttgart: Schweizer‑ bart; 1970. p. 45–55.
Bourquin S, Peron S, Durand M. Lower Triassic sequence stratigraphy of the western part of the Germanic Basin (west of Black Forest): fluvial system evolution through time and space. Sed Geol. 2006;186(3–4):187–211. https://doi. org/10.1016/j.sedgeo.2005.11.018.
Brown ET. Rock characterisation testing and monitoring: ISRM suggested methods. Oxford: Pergamon for the Commis‑ sion on testing methods, International Society for Rock Mechanics. 1981.
Brun JP, Gutscher MA, ECORS‑DEKORP Team. Deep crustal structure of the Rhine Graben from ECORS‑DEKORP seismic reflection data: a summary. Tectonophysics. 1992;208(1):139–47. https://doi.org/10.1016/0040‑1951(92)90340‑C. Budding MC, Inglin HF. A reservoir geological model of the Brent Sands in southern Cormorant. In: Illing LV, Hobson GD,
editors. Petroleum geology of the continental shelf of northwestern Europe. London: Institute of Petroleum; 1981. p. 326–34.
Caine JS, Evans JP, Forster CB. Fault zone architecture and permeability structure. Geology. 1996;24(11):1025–8. https:// doi.org/10.1130/0091‑7613(1996)024<1025:FZAAPS>2.3.CO;2.
Carlson RL, Gangi AF. Effect of cracks on the pressure dependence of P wave velocities in crystalline rocks. J Geophys Res Solid Earth. 1985;90(B10):8675–84. https://doi.org/10.1029/JB090iB10p08675.
Chesnaux R, Allen DM, Jenni S. Regional fracture network permeability using outcrop scale measurements. Eng Geol. 2009;108(3–4):259–71. https://doi.org/10.1016/j.enggeo.2009.06.024.
Chester FM, Logan JM. Implications for mechanical‑properties of brittle faults from observations of the Punchbowl fault zone, California. Pure and Applied Geophysics. 1986;124(1):79–106. https://doi.org/10.1007/BF00875720. Clauer N, Liewig N, Ledesert B, Zwingmann H. Thermal history of triassic sandstones from the Vosges Mountains‑Rhine
Graben rifting area, NE France, based on K‑Ar illite dating. Clay Min. 2008;43:363–79. https://doi.org/10.1180/ claymin.2008.043.3.03.
Dachroth W (1985) Fluvial sedimentary styles and associated depositional environments in the Buntsandstein west of river Rhine in Saar area and Pfalz (F.R. Germany) and Vosges (France). In: Mader D (ed) Aspects of fluvial sedimen‑ tation in the Lower Triassic Buntsandstein of Europe. Berlin: Springer; 1985. p. 197–248. https://doi.org/10.1007/ BFb0010521.
De Marsily G. Quantitative hydrogeology: groundwater hydrology for engineers. 1st ed. New York: Academic Press; 1986. Dezayes C, Lerouge C, Sanjuan B, Ramboz C, Brach M. Toward a better understanding of the fluid circulation in the Rhine
Graben for a better geothermal exploration of the deep basins. In: Proceedings World Geothermal Congress 2015 Melbourne, Australia, 2015. p. 13.
Domenico PA, Palciauskas VV. Theoretical analysis of forced convective heat transfer in regional ground‑water flow. Geol Soc Am Bull. 1973;84(12):3803–14. https://doi.org/10.1130/0016‑7606(1973)84<3803:taofch>2.0.co;2.
Dunn DE, LaFountain J, Jackson RE. Porosity dependence and mechanism of brittle fracture in sandstones. J Geophys Res. 1973;78(14):2403–17. https://doi.org/10.1029/JB078i014p02403.
Ehrenberg SN. Assessing the relative importance of compaction processes and cementation to reduction of porosity in sandstones; discussion; Compaction and porosity evolution of Pliocene sandstones, Ventura Basin, California; discussion. AAPG Bull. 1989;73(10):1274–6.
Eisbacher GH, Fielitz W. Karlsruhe und seine Region Nordschwarzwald, Kraichgau, Neckartal, südlicher Odenwald, Oberrhein‑Graben, Pfälzerwald und westliche Schwäbische Alb, vol. 103. Berlin: Sammlung Geologischer Führer, Gebrüder Bornträger; 2010.
Evans JP, Forster CB, Goddard JV. Permeability of fault‑related rocks, and implications for hydraulic structure of fault zones. J Struct Geol. 1997;19(11):1393–404. https://doi.org/10.1016/S0191‑8141(97)00057‑6.
Fairhurst CE, Hudson JA. International society for rock mechanics commission on testing methods. Int J Rock Mech Min Sci Geomech Abstr. 1989;26(5):427–34. https://doi.org/10.1016/0148‑9062(89)90938‑8.
Faulkner DR, Jackson CAL, Lunn RJ, Schlische RW, Shipton ZK, Wibberley CAJ, Withjack MO. A review of recent developments concerning the structure, mechanics and fluid flow properties of fault zones. J Struct Geol. 2010;32(11):1557–75. https://doi.org/10.1016/j.jsg.2010.06.009.
Faulkner DR, Mitchell TM, Jensen E, Cembrano J. Scaling of fault damage zones with displacement and the implications for fault growth processes. J Geophys Res Solid Earth. 2011;. https://doi.org/10.1029/2010jb007788.
Farrell NJC, Healy D, Taylor CW. Anisotropy of permeability in faulted porous sandstones. J Struct Geol. 2014;63:50–67. https://doi.org/10.1016/j.jsg.2014.02.008.
Feist‑Burkhardt S, et al. Triassic. In: McCann T, editor. The geology of Central Europe. vol. 2. Mesozoic and Cenozoic. Lon‑ don: Geological Society; 2008. p. 749–821.
Fitch PJR, Lovell MA, Davies SJ, Pritchard T, Harvey PK. An integrated and quantitative approach to petrophysical hetero‑ geneity. Mar Pet Geol. 2015;63:82–96. https://doi.org/10.1016/j.marpetgeo.2015.02.014.
Freeze RA, Cherry JA. Groundwater. Englewood Cliffs: Prentice‑Hall; 1979.
Franco A, Villani M. Optimal design of binary cycle power plants for water‑dominated, medium‑temperature geothermal fields. Geothermics. 2009;38(4):379–91. https://doi.org/10.1016/j.geothermics.2009.08.001.
Gross MR, Fischer MP, Engelder T, Greenfield RJ. Factors controlling joint spacing in interbedded sedimentary rocks: inte‑ grating numerical models with field observations from the Monterey Formation, USA. Geol Soc Lond Spec Publ. 1995;92:215–33. https://doi.org/10.1144/GSL.SP.1995.092.01.12.
Hagdorn H, Nitsch E. The Germanic Triassic in its Southwest German type area. In: Hagdorn H, Nitsch E, Aigner T, Simon T, editors. 6th International Triassic Field Workshop (Pan‑European Correlation of the Triassic) Triassic of Southwest Germany 175th. Anniversary of the Foundation of the Triassic System. 2009. http://www.stratigraphie.de/perm‑ trias/trias_workshops.htm.
Heffer KJ, Lean J. Earth stress orientation—a control on, and a guide to, flooding directionality in a majority of reservoirs. In: Linville W, editor. Reservoir characterization III. Tulsa: PennWell Books; 1993. p. 799–822.
Heidbach O, Tingay M, Barth A, Reinecker J, Kurfeß D, Müller B. The World Stress Map Database Release 2008. 2008. Hestir K, Long JCS. Analytical expressions for the permeability of random two‑dimensional Poisson fracture net‑
works based on regular lattice percolation and equivalent media theories. J Geophys Res Solid Earth Planets. 1990;95(B13):21565–81. https://doi.org/10.1029/JB095iB13p21565.
Holt RM, Nes O‑M, Fjaer E. In‑situ stress dependence of wave velocities in reservoir and overburden rocks. Lead Edge. 2005;24(12):1268–74. https://doi.org/10.1190/1.2149650.
Howell JA, Martinius AW, Good TR. The application of outcrop analogues in geological modelling: a review, present status and future outlook. Geol Soc Lond Spec Publi. 2014;387:1–25. https://doi.org/10.1144/sp387.12.
Hull J. Thickness displacement relationships for deformation zones. J Struct Geol. 1988;10(4):431–5. https://doi. org/10.1016/0191‑8141(88)90020‑X.
Illies JH. The Rhine Graben rift system‑plate tectonics and transform faulting. Surv Geophys. 1972;1(1):27–60. https://doi. org/10.1007/BF01449550.
Illies JH. Ancient and recent rifting in the Rhinegraben. Geol En Mijnb Neth J Geosci. 1977;56(4):329–50.
Illies JH, Greiner G. Holocene movements and state of stress in the Rhinegraben rift system. Tectonophysics. 1979;52(1– 4):349–59. https://doi.org/10.1016/0040‑1951(79)90245‑2.
Jolie E, Klinkmueller M, Moeck I. Diffuse surface emanations as indicator of structural permeability in fault‑controlled geothermal systems. J Volcanol Geoth Res. 2015;290:97–113.
Jung R. Stand und Aussichten der Tiefengeothermie in Deutschland. Erdöl, Erdgas, Kohle. 2007; 123(2).
Jung R, Röhling S, Ochmann N, Rogge S, Schellschmidt R, Schulz R, Thielmann T. Abschätzung des technischen Potenzials der geothermischen Stromerzeugung und der geothermischen Kraft‑Wärme‑Kopplung (KWK) in Deutschland. Bericht für das Büro für Technikfolgenabschätzung beim Deutschen Bundestag; BGR/GGA, Archiv‑Nr. 122 458; Hannover. 2002. http://dip21.bundestag.de/dip21/btd/15/018/1501835.pdf.
Keogh KJ, Martinius AW, Osland R. The development of fluvial stochastic modelling in the Norwegian oil industry: a historical review, subsurface implementation and future directions. Sed Geol. 2007;202(1–2):249–68. https://doi. org/10.1016/j.sedgeo.2007.05.009.
Krumbholz M, Hieronymus CF, Burchardt S, Troll VR, Tanner DC, Friese N. Weibull‑distributed dyke thickness reflects probabilistic character of host‑rock strength. Nat Commun. 2014a;5:3272. https://doi.org/10.1038/ncomms4272. Krumbholz M, Vollbrecht A, Aschoff M. Recent horizontal stress directions in basement rocks of southern Sweden
deduced from open microcracks. J Struct Geol. 2014b;65:33–43. https://doi.org/10.1016/j.jsg.2014.03.006. Kruseman GP, Ridder NA. Analysis and evaluation of pumping test data, vol. 47. 2nd ed. Netherlands: International Insti‑
tute for Land Reclamation and Improvement; 1992.
Lander RH, Larese RE, Bonnell LM. Toward more accurate quartz cement models: the importance of euhedral versus non‑ euhedral growth rates. AAPG Bull Am Assoc Pet Geol. 2008;92(11):1537–63. https://doi.org/10.1306/07160808037. Lander RH, Laubach SE. Insights into rates of fracture growth and sealing from a model for quartz cementation in frac‑
tured sandstones. Geol Soc Am Bull. 2015;127(3–4):516–38. https://doi.org/10.1130/B31092.1.
Larroque JM, Etchecopar A, Philip H. Evidence for the permutation of stresses σ1 and σ2 in the Alpine foreland: the exam‑ ple of the Rhine Graben. Tectonophysics. 1987;144(4):315–22. https://doi.org/10.1016/0040‑1951(87)90299‑X. Laubach SE, Eichhubl P, Hargrove P, Ellis MA, Hooker JN. Fault core and damage zone fracture attributes vary along strike
owing to interaction of fracture growth, quartz accumulation, and differing sandstone composition. J Struct Geol. 2014;68:207–26. https://doi.org/10.1016/j.jsg.2014.08.007.
Laubach SE, Olson JE, Gale JFW. Are open fractures necessarily aligned with maximum horizontal stress? Earth Planet Sci Lett. 2004;222(1):191–5. https://doi.org/10.1016/j.epsl.2004.02.019.
Laubach SE, Olson JE, Gross MR. Mechanical and fracture stratigraphy. AAPG Bull Am Assoc Pet Geol. 2009;93(11):1413– 26. https://doi.org/10.1306/07270909094.
Laubach SE, Fall A, Copley LK, Marrett R, Wilkins S. Fracture porosity creation and persistence in a basement‑involved Laramide fold, Upper Cretaceous Frontier Formation, Green River Basin USA. Geol Mag. 2016;153(5–6):887–910. https://doi.org/10.1017/S0016756816000157.
Lotz U. Geothermie—Potentiale im Oberrheintal und Chancen für die kommunale Energieversorgung. 2014. http:// docplayer.org/12998886‑Geothermie‑potentiale‑im‑oberrheintal‑und‑chancen‑fuer‑die‑kommunale‑energiever‑ sorgung‑dr‑ulrich‑lotz‑leiter‑exploration‑geoenergy‑gmbh.html.
Lunn RJ, Shipton ZK, Bright AM. How can we improve estimates of bulk fault zone hydraulic properties? In: Wibberley C, Kurz W, Imber J, Holdsworth R, Collettini C editors. The internal structure of fault zones: implications for mechani‑ cal and fluid‑flow properties, vol. 299. London: Special Publications. Geological Society; 2008. p. 231–237. https:// doi.org/10.1144/SP299.14.
Luthi SM, Souhaité P. Fracture apertures from electrical borehole scans. Geophysics. 1990;55(7):821–33. https://doi. org/10.1190/1.1442896.
Marrett R, Laubach SE, Olson JE. Anisotropy and beyond: geologic perspectives on geophysical prospecting for natural fractures. Lead Edge. 2007;26(9):1106–11. https://doi.org/10.1190/1.2780778.
McBride EF. A classification of common sandstones. J Sediment Res. 1963;33(3):664–9. https://doi. org/10.1306/74d70ee8‑2b21‑11d7‑8648000102c1865d.
Meixner J, Schill E, Grimmer JC, Gaucher E, Kohl T, Klingler P. Structural control of geothermal reservoirs in extensional tectonic settings: an example from the Upper Rhine Graben. J Struct Geol. 2016;82:1–15. https://doi.org/10.1016/j. jsg.2015.11.003.
Miall AD. Lithofacies types and vertical profile models in braided river deposits: a summary. In: Miall AD, editor. Fluvial Sedimentology, Memoir 5. Calgary: Canadian society of petroleum geologists; 1977. p. 597–604.
Molenaar N, Cyziene J, Sliaupa S. Quartz cementation mechanisms and porosity variation in Baltic Cambrian sandstones. Sed Geol. 2007;195(3–4):135–59. https://doi.org/10.1016/j.sedgeo.2006.07.009.
Morad S, Al‑Ramadan K, Ketzer JM, De Ros LF. The impact of diagenesis on the heterogeneity of sandstone reser‑ voirs: a review of the role of depositional facies and sequence stratigraphy. AAPG Bull Am Assoc Pet Geol. 2010;94(8):1267–309. https://doi.org/10.1306/04211009178.
Müller C, Siegesmund S, Blum P. Evaluation of the representative elementary volume (REV) of a fractured geothermal sandstone reservoir. Environ Earth Sci. 2010;61(8):1713–24. https://doi.org/10.1007/s12665‑010‑0485‑7. Narr W, Suppe J. Joint spacing in sedimentary‑rocks. J Struct Geol. 1991;13(9):1037–48. https://doi.
org/10.1016/0191‑8141(91)90055‑N.
Nelson RA. Geologic analysis of naturally fractured reservoirs. vol 1. In: Contributions in petroleum geology and engineer‑ ing, 1st edn. Texas: Gulf Publishing, Houston; 1985.
Odling NE, et al. Variations in fracture system geometry and their implications for fluid flow in fractured hydrocarbon reservoirs. Pet Geosci. 1999;5(4):373–84. https://doi.org/10.1144/petgeo.5.4.373.
Palchik V. Influence of porosity and elastic modulus on uniaxial compressive strength in soft brittle porous sandstones. Rock Mech Rock Eng. 1999;32(4):303–9. https://doi.org/10.1144/10.1007/s006030050050.
Palchik V, Hatzor YH. The influence of porosity on tensile and compressive strength of porous chalks. Rock Mech Rock Eng. 2004;37(4):331–41. https://doi.org/10.1007/s00603‑003‑0020‑1.
Paschen H, Oertel D, Grünwald R. Möglichkeiten geothermischer Stromerzeugung in Deutschland. TAB‑Büro für Technikfolgen‑Abschätzung beim Deutschen Bundestag. 2003. https://www.tab‑beim‑bundestag.de/de/pdf/ publikationen/berichte/TAB‑Arbeitsbericht‑ab084.pdf.
Peters G. Active tectonics in the Upper Rhine Graben: integration of paleoseismology, geomorphology and geomechani‑ cal modeling. Dissertation, Vrije University, Amsterdam. 2007.
Pflug R editor. Bau und Entwicklung des Oberrheingrabens. vol. 184. Darmstadt: Wissenschaftliche Buchgesellschaft; 1982.
Philipp SL, Reyer D, Meier S. Strukturgeologische Geländestudien in Aufschlussanaloga und Permeabilitätsentwicklung in potentiellen geothermischen Reservoiren. Z Geol Wiss. 2010;38(1):49–59.
Pickett GR. Acoustic character logs and their applications in formation evaluation. J Petrol Technol. 1963;15(6):659–67. https://doi.org/10.2118/452‑PA.
Plenefisch T, Bonjer KP. The stress field in the Rhine Graben area inferred from earthquake focal mechanisms and estimation of frictional parameters. Tectonophysics. 1997;275(1–3):71–97. https://doi.org/10.1016/ S0040‑1951(97)00016‑4.
Pribnow D, Schellschmidt R. Thermal cracking of Upper Crustal Fluid Flow in the Rhine Graben. Geophys Res Lett. 27(13):1957–1960. https://doi.org/10.1029/2000GL008494.
Priest SD (1993) Discontinuity analysis for rock engineering. 1st edn. London: Chapman and Hall. https://doi. org/10.1007/978‑94‑011‑1498‑1.
Ramm M, Bjorlykke K. Porosity/depth trends in reservoir sandstones; assessing the quantitative effects of varying pore‑ pressure, temperature history and mineralogy, Norwegian Shelf data. Clay Miner. 1994;29(4):475–90.
Rasband W. ImageJ, US National Institutes of Health, Bethesda, Maryland, USA. 2011. http://imagej.nih.gov/ij/, 1997–2016. Reinecker J, Grobe R, Hochschild T, Bauer JF, Meier S, Philipp SL, Filomena M, Stollhofen H, Bechstädt T, Drews T, Miernik
G, Soyk D, Melchert B. Verbundprojet AuGE: Aufschlussanalogstudien und ihre Anwendbarkeit in der geother‑ mischen Exploration—Entwicklung von Methoden zur Ermittlung von Permeabilitäten und Transmissivitäten aus Reservoir‑Informationen des Oberrheingrabens—Schlussbericht Teilprojekt A (2015). 2015. https://doi. org/10.2314/GBV:860785203.
Reyer D, Bauer J, Philipp SL. Fracture systems in normal fault zones crosscutting sedimentary rocks, Northwest German Basin. J Struct Geol. 2012;45:38–51. https://doi.org/10.1016/j.jsg.2012.06.002.
Richter‑Bernburg G. Stratigraphische Synopsis des deutschen Buntsandsteins. Geol Jahrb A. 1974;25:27–132. Rogers SF. Critical stress‑related permeability in fractured rocks. In: Meen M. editor. Fracture and in‑situ stress charac‑
terization of hydrocarbon reservoirs. Geological Society, London: Special Publications; 209, 7–16. The Geological Society of London 2003. 2003. https://doi.org/10.1144/GSL.SP.2003.209.01.02.
Rupf I, Nitsch E. Das geologische Landesmodell von Baden‑Württemberg: Datengrundlagen, technische Umsetzung und erste geologische Ergebnisse. Baden: Landesamt für Geologie, Rohstoffe und Bergbau; 2008.
Sahagian DL, Proussevitch AA. 3D particle size distributions from 2D observations: stereology for natural applications. J Volcanol Geoth Res. 1998;84(3–4):173–96. https://doi.org/10.1016/S0377‑0273(98)00043‑2.
Sauer K, Naegele R, Tietze R, Kreuzkamp H. Geothermal inventory of the Upper Rhinegraben between Karlsruhe and Mannheim (situated in Baden‑Wuerttemberg). 1982. https://www.tib.eu.
Schellschmidt R, Clauser R. The thermal regime of the Upper Rhine Graben and the anomaly at Soultz. Z Angew Geol. 1996;42(1):40–4.
Schlumberger. Log interpretation principles/applications: Houston (Schlumberger Educ. Services), SMP‑7017. 1989. Schulz R. Energie aus der Tiefe: Geothermie. In: Renn J, Schrögl, R. & Zenner editors. Herausforderung Energie: aus‑
gewählte Vorträge der 126. Versammlung der Gesellschaft Deutscher Naturforscher und Ärzte e.V. epubli GmbH, Berlin; 2011. p. 53‑67.
Schulz R et al. Aufbau eines geothermischen Informationssystems für Deutschland. Endbericht. LIAG‑Bericht, Archiv‑ Nr 128, 452; Hannover. 2009. https://www.geotis.de/homepage/Ergebnisse/GeotIS_Endbericht.pdf. Schulz SE, Evans JP. Mesoscopic structure of the Punchbowl Fault, Southern California and the geologic and geo‑