L
ASER
P
RECIPITATION
M
ONITOR
FOR
M
EASUREMENT
OF
D
ROP
S
IZE
AND
V
ELOCITY
OF
M
OVING
S
PRAY‐
P
LATE
S
PRINKLERS
B. A. King, T. W. Winward, D. L. Bjorneberg
ABSTRACT. Sprinkler drop size distribution and associated drop velocities have a major influence on sprinkler performance
in regards to kinetic energy transferred to the soil surface. A laser instrument commercially marketed for real‐time rainfall measurements as a Laser Precipitation Monitor (LPM) was used to measure drop size and velocity from 10 moving spray‐plate type sprinklers. Measured drop size and velocity were used to determine sprinkler drop size distribution and kinetic energy applied to the soil by sprinkler discharge. Drop size distributions measured by the LPM were compared to drop size distributions measured in earlier studies using the traditional flour pellet method. Eight of the ten measured drop size distributions were not significantly different between measurement methods. However, the operating conditions when the two methods did not compare well were outside sprinkler manufacturer specifications. Based on this limited study, the results from the two drop size measurement methods can be vastly different for sprinklers under operating conditions that produce relatively compact streams of water drops; which method is more accurate for this condition remains unknown. Kinetic energy values calculated using measured drop size and velocity data were not significantly different from values determined using flour pellet drop size data and a ballistic model for estimating sprinkler droplet tangential velocity. The laser instrument used in this study provided a relatively easy means to obtain reliable estimates of sprinkler kinetic energy per unit volume of applied water for various moving spray‐plate sprinkler types and operating conditions. Measured drop size distribution and computed kinetic energy applied by sprinkler discharge is sufficient for practical field application purposes.
Keywords. Sprinkler, Moving spray‐plate, Drop size, Drop velocity, Kinetic energy, Center pivot.
prinkler drop size distribution and associated velocities have a major influence on sprinkler performance in regards to kinetic energy transferred to the soil surface. When application intensity exceeds water infiltration rate, runoff and soil erosion can ensue. Kinetic energy of sprinkler drops impacting a bare soil surface can induce soil surface sealing and lead to a reduction in water infiltration rate (Thompson and James, 1985; Mohammed and Kohl, 1987) exacerbating runoff and erosion hazard.
Studies involving the measurement of drop size distributions from agricultural sprinklers have been conducted on a relatively limited basis over the past 50 years. Three methods have primarily been used to measure drop sizes from agricultural sprinklers. They are:
S Paper stain method in which drops are caught on treated paper and allowed to dry (Hall, 1970; Solomon et al., 1985; Kincaid et al., 1996). The resulting stains are
Submitted for review in May 2009 as manuscript number SW 8043; approved for publication by the Soil & Water Division of ASABE in December 2009.
Mention of trade name, proprietary product, or specific equipment does not constitute a guarantee or warranty by the authors or their institutions and does not imply approval of product to the exclusion of others that may be suitable.
The authors are Bradley A. King, ASABE Member Engineer,
Research Agricultural Engineer, Troy W. Winward, Hydrologic Technician, and David L. Bjorneberg, ASABE Member Engineer,
Supervisory Research Agricultural Engineer, USDA ARS NWISRL, Kimberly, Idaho. Corresponding author: Bradley A. King, USDA ARS NWISRL, 3793 N. 3600 E., Kimberly, ID 83341‐5076; phone: 208‐423‐5061; fax: 208‐423‐6555; e‐mail: brad.king@ars.usda.gov.
measured and converted using a calibration equation which relates stain size to drop size.
S Flour pellet method in which drops are caught in a pan of sifted flour, the flour dried, and dried flour pellets sieved into different size categories (Kohl, 1974; Kohl and DeBoer, 1984; Chen and Wallender, 1985; Kohl and DeBoer, 1990; Li et al., 1994; DeBoer et al., 2001). A calibration equation relates pellet mass to drop size.
S Laser particle measuring system where the shadow of a drop passing through a horizontal laser beam is projected onto a linear array of photodiodes (Kohl et al., 1985; Solomon et al., 1991; Kincaid et al., 1996). The width of the shadow on the photodiode array is a measure of drop size.
from the photodiode. The magnitude and duration of the change in voltage from the photodiode is proportional to the cross‐section of the drop and to its residence time (time the drop shadows photodiode) in the light beam. The square of the voltage change is proportional to equivalent drop diameter (Hauser et al., 1984). The integral of the square of the voltage change over the residence time is proportional to drop diameter squared multiplied by total residence time. The total residence time can be estimated from the measured duration of the voltage change. Drop velocity can then be determined if drop diameter is known. This provides an unbiased estimate of drop velocity (Hauser et al., 1984), but not independent of drop diameter. Alternately, drop velocity can be estimated from total residence time, the light beam physical dimensions, drop size, and assuming the drop crosses the two parallel faces of the light beam (Salles et al., 1999). The geometry of the light beam limits estimation of drop velocity to the component of velocity normal to the light beam.
The major disadvantages of the LPM have been signal processing limitations and dependency of photodiode output on where the drop passes through the light beam due to imperfections in lenses, diffraction effects, and incomplete optical alignment (Salles et al., 1999). Limitations with signal processing have largely been resolved by the current state of commercial signal processing electronics. The issue of where the drop passes through the light beam has not been resolved. However, collecting a large sample of drops to average out variability in drop size measurement has been used to overcome this issue. Salles et al. (1999) found that drop size distributions of simulated and natural rainfall can be measured with an accuracy of 3% or less with a minimum sample size of 10,000 drops. Salles and Poesen (1999) compared measured drop size distributions of simulated and natural rainfall using a LPM and the paper stain method. They concluded that given the uncertainties associated with the two methods, there was good agreement in derived drop size distributions between the two methods. They also concluded the errors in computed rainfall erosivity indices, kinetic energy, and momentum are less than 4%.
Laser instruments used to measure drop size are subject to two major sources of measurement error; coincidence and edge effect. Coincidence errors occur when two drops pass through the laser beam simultaneously and project overlapping shadows on the photo detector(s). Kohl et al. (1985) studied coincidence error and developed a model to estimate the probability of coincidence for uniformly sized drops at terminal velocity as a function of laser beam length and width and drop diameter. The model demonstrated that coincidence error cannot be eliminated but can be controlled by restricting the length of the laser beam for drop passage. Edge effect errors occur when only a fraction of a drop passes through the laser beam along one of the edges. When this happens the laser detects a smaller drop than actually existed. Edge effect errors cannot be eliminated but can be reduced by making the laser beam wider, which increases the probability of coincidence error. For laser instruments that also measure drop velocity, one approach to control coincidence and edge effect errors is to validate each drop measurement based on measured drop velocity. In the case of rainfall, drop velocity can be assumed to be at terminal velocity for the measured drop size. Comparing measured drop velocity with terminal velocity based on measured drop
size provides a basis for validating drop size measurement. Drops with a measured velocity differing substantially from terminal velocity for the measured drop size could be the result of coincidence or edge effect error and eliminated from the data set. In the case of irrigation sprinklers, drops may not be traveling at terminal velocity. However, the velocity of sprinkler drops at a specific location relative to the sprinkler nozzle may be assumed to be relatively constant for a given drop size if flight trajectory and droplet formation processes are assumed to be constant with time. Based on these assumptions, Solomon et al. (1991) used measured velocity of sprinkler drops exceeding ±2 standard deviations from mean measured velocity as criteria to eliminate drop size measurements from a data set. This approach reduces measurement errors but does not eliminate them.
Kincaid et al. (1996) measured drop size distributions for a wide range of sprinkler types, nozzles sizes, and pressures using a laser particle measuring system (model GBPP‐100S, Particle Measuring System, Boulder, Colo.). The measurements were conducted by the Center for Irrigation Technology (California State University, Fresno, Calif.) hereafter referred to as the CIT laser. Measured drop sizes ranged from 0.2 to 13.0 mm in 0.02‐mm increments. Sprinkler height was 3 m and length of the laser beam was restricted to 100 mm. Drop size measurements were collected at 1 m radial distance intervals over the wetted radius of the sprinkler. A total of 10,000 drops were collected at each radial location with exception of the farthest distance were 4,000 drops were collected to save time. Drop size measurements were filtered based on measured drop velocity within ±2 standard deviations of mean measured velocity (Solomon et al., 1991, 1996). Kincaid et al. (1996) found that the CIT laser indicated a few large drops in the 7‐ to 9‐mm range, which appeared to distort the drop size distribution toward the larger drops as compared to other measurement methods. Based on rainfall studies that show drops larger than 5.5 mm are unstable and breakup, Kincaid et al. (1996) rationalized that drop distortion in flight was responsible for the larger measured drops sizes. They applied a correction factor to measured drop size to account for distortion. The final drop size distribution was obtained by discarding drops greater than 7 mm and adjusting drop sizes between 1 and 7 mm to account for distortion. The resulting drop size distributions compared well with drop size distributions measured using the flour pellet method.
DeBoer and Monnens (2001) measured drop size distributions for several moving spray‐plate sprinklers for a range of nozzle sizes and operating pressures. They measured drop sizes from 0.33 to 5.95 mm in 0.08‐mm increments for the smallest drops to 1.01‐mm increments for the largest drops. Sprinkler height was 2.5 m above the flour pans. Drop size measurements were collected at 1‐m intervals to the edge of the wetted area. Smaller distance intervals were used at the outer edge of the wetted area where water application rate change with distance was large. Composite drop size distributions were weighted by the fraction of sprinkler volume applied within each radial measurement interval. Drop size measurements were repeated once at each distance interval.
over the past 50 years (Seginer, 1965; Stillmunkes and James, 1982; von Bernuth and Gilley, 1984; Edling, 1985; Vories et al., 1987; Seginer et al., 1991; Hinkle, 1991; Kincaid, 1996; Carrion et al., 2001; Montero et al., 2001; Lorenzini, 2004; De Wrachien and Lorenzini, 2006) to investigate and predict sprinkler operating characteristics. These models are often referred to as ballistic models and use assumptions and simplifications to formulate a numerical model of droplet trajectory. The major simplifying assumptions in ballistic models include: 1) drops form at the sprinkler nozzle, 2) droplet volume is constant during flight, 3) droplet shape is spherical and does not deform, 4) forces acting on a drop during flight are gravity and friction, 5) friction is in the opposite direction of velocity during flight, and 6) droplet initial velocity and direction is known (an input to model). These simplifications all affect the ability of a ballistic model to accurately predict sprinkler operating characteristics. Ballistic models perform reasonably well given an initial tangential velocity (magnitude and direction) and size of drop.
Using high speed photography, McCreery and Stoots (1996) found that the jet of water from the sprinkler nozzle forms a water film on the splash plate that flows radially outward on the splash plate, flows from the splash plate outward as a sheet, and breaks into drops after the water detaches from the splash plate. They concluded sprinkler drop size distribution is determined by a balance between shear forces with air and flow instabilities and turbulence in the liquid flow sheet, which tend to fracture the liquid sheet and drops; and surface tension forces, which tend to hold the liquid sheet and drops together. Drops are actually formed some distance from the edge of the splash plate. Sprinkler droplet formation processes are not included in ballistic models and therefore these models cannot predict drop size distribution.
Kincaid (1996) and DeBoer (2002) combined sprinkler drop size measurements with ballistic models to calculate kinetic energy per unit drop volume for a single sprinkler. Kincaid (1996) used the CIT laser for drop size measurements and DeBoer (2002) used the flour pellet method. DeBoer (2002) used the Seginer (1965) ballistic model to estimate tangential velocity. Kincaid (1996) developed a ballistic model and adjusted the drag coefficient to account for drops traveling as a larger mass of water after leaving the splash plate. The adjustment was empirically determined for each sprinkler by adjusting the drag coefficient to get the flight distance from ballistic model for the largest few drop sizes to match measured wetted radius of each sprinkler. This approach results in a ballistic model calibrated to a specific method of drop size measurement. Tangential velocity predicted by the ballistic model was then used to compute kinetic energy per unit drop volume. The drag coefficient adjustment factor was not critical for calculating kinetic energy.
Studies using an LPM to measure drop size distributions of irrigation sprinklers are very limited. Montero et al. (2003) used an LPM to measure drop size distribution of selected impact sprinklers. They measured 200 drops at different radial distances from the sprinkler and compared volume mean diameter (d50) size with predictions from a ballistic
model (Montero et al., 2001). They found good agreement between the two methods. Measurement of drop size distributions from moving spray‐plate sprinklers or
calculation of kinetic energy using an LPM has not been investigated. An automated and robust instrument such as the LPM to measure drop size and velocity of moving spray‐plate type sprinklers would be useful in evaluating runoff and erosion hazard of center pivot sprinklers and potential aid in center pivot sprinkler irrigation system design.
The objective of this study was to evaluate applicability of an LPM for measuring drop size and velocity of moving spray‐plate sprinklers used on center pivot sprinkler irrigation systems. This was accomplished by comparing measured drop size distributions of selected sprinklers with published drop size distributions obtained using other methods of measurement. Drop size and velocity measured by the LPM were used to compute kinetic energy per unit drop volume which was compared to published values to assess applicability of an LPM for determining kinetic energy of moving spray‐plate sprinklers.
M
ATERIALS ANDM
ETHODSDrop size and velocity discharged from selected moving spray‐plate sprinklers were measured using a Thies Clima Laser Precipitation Monitor (TCLPM) (Adolf Thies GmbH & Co. KG, Göttingen, Germany). The laser diode wave length was 785 nm and the nominal measuring area of the laser beam was 4460 mm2 (223 mm long, 20 mm wide) with
a thickness of 0.75 mm. The TCLPM drop size and velocity measurement ranges were 0.16 to 8.0 mm and 0.2 to 20 m/s, respectively. The TCLPM was attached to a 3.8‐cm diameter metal pipe supported by a tripod base (fig. 1). A mounting bracket was constructed that allowed the TCLPM to be angled rather than fixed horizontally. The TCLPM firmware was operated in “particle event” mode to output drop size and
Infrared Laser Source
Photo-Diode Detector
Support Stand Hinged
Bracket
Moveable Shields
Splash Guards
velocity whenever a drop passed through the laser beam. Serial communication protocol of the TCLPM was set to a baud rate of 115,200, 8‐data bits, no parity, and 1‐stop bit. Output for each particle event was logged using a serial communication capture program on a notebook computer. A minimum of 10,000 particle events were collected from the TCLPM at a given distance from the sprinkler, except at the largest distance from the sprinkler where a minimum of 4,000 drops were collected to save time.
Drop size and velocity measurements were collected at 1‐m increments from the sprinkler. The TCLPM was angled to allow the drop to pass through the laser beam approximately normal to its face. The angle was set visually at each measurement location and recorded. The TCLPM output includes two values of drop diameter and velocity for each particle event. One value is the diameter measured by the TCLPM and the second is an adjusted diameter for an equivalent spherical drop. The diameter adjustment is to account for deformation of a spherical drop traveling at terminal velocity due to air drag forces. The drop size measured by the TCLPM and the corresponding velocity were used in this study rather than the adjusted values since most of the drops were less than terminal velocity when they passed through the laser beam (based on ballistic model simulation).
The length of the TCLPM laser beam for drops to pass was physically restricted to minimize the range in photodiode response over the sample area for a given drop size and reduce the probability of multiple drops in the laser beam or coincidence error (Kohl et al., 1985). The laser beam length for drops to pass was restricted to the center portion using metal shields (fig. 1). For measurements within 4 m of the sprinkler, laser beam length was restricted to 50 mm and for greater distances it was restricted to 100 mm. Based on the model of Kohl et al. (1985) for probability of coincidence, restricting the laser beam length to 100 mm from 2230 mm for 0.2‐mm diameter drops with an application intensity of 25 mm/h reduced the probability of coincidence from 192% to 9%. Further restricting the laser beam length to 50 mm reduces the probability of coincidence to 4%. For 1‐mm diameter drops with an application intensity of 50 mm/h and 100‐mm laser beam length, the probability of coincidence is 0.3%.
Aluminum honeycomb‐type material, 38 mm thick, was fixed on top of the TCLPM structural elements to minimize splash from drops striking structural elements passing through the laser beam (fig. 1). The honeycomb material was effective in reducing splash but did not completely eliminate it.
Moving spray‐plate sprinklers included in this study were the ROTATORR (model R30) and SPINNER (model S30) models manufactured by Nelson Irrigation Corp. (Walla Walla, Wash.) with four groove green and six groove red spray plates. Current production ROTATORR (model R3000) and SPINNER (model S3000) sprinklers are hydraulically similar and can use the same spray plates. Pressure and nozzle sizes for the sprinklers are listed in table 1. The tests were conducted in the laboratory and represent a no wind condition. Sprinklers were positioned on the end of a drop tube with nozzle discharge directed vertically downward 2.5 m above the laser beam of the TCLPM. Pressure regulators with nominal pressure ratings for the test condition were used to control pressure at the base
Table 1. Sprinklers and operating conditions used in study.
Test
Sprinkler
ID[a] Sprinkler SprayPlate Pressure (kPa)Nominal Diameter (mm)Nozzle
1 R41064 Rotator 4 groove 103 6.4 2 R61064 Rotator 6 groove 103 6.4 3 R61348 Rotator 6 groove 138 4.8 4 R61379 Rotator 6 groove 138 7.9 5 R62048 Rotator 6 groove 207 4.8 6 R62064 Rotator 6 groove 207 6.4 7 S41064 Spinner 4 groove 103 6.4 8 S61064 Spinner 6 groove 103 6.4 9 S61379 Spinner 6 groove 138 7.9 10 S62048 Spinner 6 groove 207 4.8
[a] R = Rotator or S = Spinner; 4 = 4‐groove or 6 = 6‐groove;
10 = 103 kPa, 13 = 138 kPa or 20 = 207 kPa; and 48 = 4.8 mm, 64 = 6.4 mm or 79 = 7.9 mm.
of the sprinkler. A pressure gauge located between the pressure regulator and sprinkler base was used to monitor pressure during a test. Pressure values were within ±7 kPa of the nominal pressure rating.
Radial application rate distributions for the sprinklers were also tested in the laboratory. Catch cans, 15 cm in diameter and 18 cm tall spaced at 0.6‐m increments from the sprinkler in one radial direction, were used to collect water. The duration of each test was 30 to 60 min. Water collected in each can was measured using a graduated cylinder. Application rate was calculated based on the diameter of the catch cans and duration of the each test. The average radial application distribution from two consecutive laboratory tests was used in this study.
Data collected by the TCLPM were filtered to reduce the occurrence of measured particle events due to splash, coincidence error, and edge effect error. Drop size measurements were grouped into 0.1‐mm increments for analysis starting with 0.25 mm continuing to 7.95 mm. Measured drops less than 0.2 mm in diameter were discarded as they represented less than 0.01% of total volume of drops measured. Drops having a velocity exceeding ±2 standard deviations of the mean measured velocity for a given drop size at a given radial location were eliminated from the data set (Solomon et al., 1991, 1996). Drop size groups with less than 15 drops before filtering were discarded as the computed mean drop velocity was highly variable between adjacent size groupings and the computed standard deviation was erratic indicating drop size values were due to measurement errors. This only occurred for the largest few size groupings at radial distances greater than 4 m and represented less than 0.5% total volume of drops measured at a radial location.
Drop size distributions at each radial location were calculated based on total volume of measured drops at the location. These subdistributions were then combined into an overall distribution for each sprinkler by weighting them according to the fraction of the total water volume applied within each radial distance interval. The fraction of total water volume applied within each 1‐m interval was determined from the measured radial application rate distribution for each sprinkler.
from the water jet exiting the sprinkler to the drops (i.e. no energy loss due to flow on plate or to move the plate) and initial drop trajectory angle was taken as the manufacture's published value for spray‐plate angle. The model was applied without adjustment to the air drag force coefficient values. The model of Kincaid (1996) was solved using the fourth‐order Runge‐Kutta fixed‐step method in Mathcad (ver. 13, Parametric Technology Corp., Needham, Mass.).
The kinetic energy for each measured drop size and velocity was calculated for each radial measurement location. Kinetic energy per unit volume of applied water (J/L) was calculated at each measurement location by dividing the cumulative kinetic energy of the measured drops by the volume of measured drops. The mean kinetic energy of the sprinkler was computed by weighting the kinetic energy per unit volume at each measurement location by the fraction of wetted area within each 1‐m measurement interval. The resulting value represents the total kinetic energy per liter of discharged water applied over the wetted area (DeBoer, 2002). Evaluation of kinetic energy variation with distance was beyond the scope of this study.
A limited number of drop size measurements used by Kincaid et al. (1996) were also used for comparison purposes. Modification of measured drop size to account for drop deformation at terminal velocity as described by Kincaid et al. (1996) was not used in this study because the objective of this study is to compare applicability of measurement
techniques and not data analysis techniques. The data presented in this study are based on the raw data collected by the CIT laser.
R
ESULTS ANDD
ISCUSSIONDrop size distributions for the 10 sprinklers tested are shown in figures 2 through 4. Drop size distributions measured using the CIT laser method (Kincaid et al., 1996) are included where available. In general, measurements using the TCLPM and flour pellet method produced similar results. The noted exceptions are the R41064 (fig. 2) and S41064 sprinklers (fig. 4) which have substantially different drop size distributions between the two measurement methods. The CIT laser measurements for the R41064 (fig. 2) were substantially different from the other methods as well. Which method provided a more accurate estimate of drop size under these conditions is unknown. The four‐groove plate is not recommended by the manufacturer for the SPINNER sprinkler at any pressure or for the ROTATORR sprinkler at an operating pressure less than 138 kPa. For the remaining eight sprinklers tested, measurements determined using any of the three methods were not significantly different (p = 0.05) based on the Kolmogorov‐Smirnov two‐sample test (Steele and Torrie, 1980) of cumulative drop size distributions. Overall, the
Drop Diameter (mm)
0 2 4 6 8 10
Percent V
olume
0 20 40 60 80 100
Flour Test 1 Flour Test 2 TCLPM
R61379
Drop Diameter (mm)
0 2 4 6 8 10
Percent V
olume
0 20 40 60 80 100
Flour Test 1 Flour Test 2 TCLPM
R61348
Drop Diameter (mm)
0 2 4 6 8 10
Percent V
olume
0 20 40 60 80 100
Flour Test 1 Flour Test 2 TCLPM
CIT Laser R61064
Drop Diameter (mm)
0 2 4 6 8 10
Percent V
olume
0 20 40 60 80 100
Flour Test 1 Flour Test 2 TCLPM
CIT Laser R41064
Drop Diameter (mm)
0 2 4 6 8 10
Percent
V
olume
0 20 40 60 80 100
Flour Test 1 Flour Test 2 TCLPM CIT Laser
R62048
Drop Diameter (mm)
0 2 4 6 8 10
Percent
V
olume
0 20 40 60 80 100
Flour Test 1 Flour Test 2 TCLPM CIT Laser
R62064
Figure 3. Comparisons of drop size distribution measured using the TCLPM with flour pellet method data from DeBoer and Monnens (2001) and CIT laser data from Kincaid et al. (1996) for sprinklers R62048 and R62064.
TCLPM measurements tend to give smaller drop sizes than the flour pellet method or CIT laser [without Kincaid et al. (1996) modification].
A summary of drop sizes to the nearest 0.1 mm corresponding to 10%, 25%, 50%, 75%, and 90% (d10, d25,
d50, d75, and d90, respectively) of sprinkler discharge
volumes for both the TCLPM and flour pellet measurements are given in table 2 for the 10 sprinklers. Mean differences between the two measurement methods ranged from ‐0.39 to ‐0.62 mm (a negative means that values for the TCLPM were less than flour pellet values). Drop size measurements for the R41064 and S41064 sprinklers had the largest differences
Drop Diameter (mm)
0 2 4 6 8 10
Percent V
olume
0 20 40 60 80 100
Flour Test 1 Flour Test 2 TCLPM
S61379
Drop Diameter (mm)
0 2 4 6 8 10
Percent V
olume
0 20 40 60 80 100
Flour Test 1 FlourTest 2 TCLPM
CIT Laser S62048
Drop Diameter (mm)
0 2 4 6 8 10
Percent V
olume
0 20 40 60 80 100
Flour Test 1 Flour Test 2 TCLPM
CIT Laser S61064
Drop Diameter (mm)
0 2 4 6 8 10
Percent V
olume
0 20 40 60 80 100
Flour Test 1 Flour Test 2 TCLPM
S41064
Table 2. Drop sizes (mm) for 10%, 25%, 50%, 75%, and 90% of sprinkler discharge volumes and differences (D) between two methods.
d10 d25 d50 d75 d90
Sprinkler TCLPM Flour[a] Δ TCLPM Flour Δ TCLPM Flour Δ TCLPM Flour Δ TCLPM Flour Δ
R41064 0.5 2.0 ‐2.5 0.9 4.2 ‐3.3 1.9 5.2 ‐3.3 3.3 5.6 ‐2.3 5.2 5.8 ‐0.6
R61064 0.5 0.7 ‐0.2 0.8 0.9 ‐0.1 1.4 2.1 ‐0.7 2.5 3.7 ‐1.2 3.6 4.1 ‐0.5
R61348 0.5 0.7 ‐0.2 0.7 0.8 ‐0.1 1.3 1.4 ‐0.1 2.0 2.2 ‐0.2 2.8 3.1 ‐0.3
R61379 0.5 0.7 ‐0.2 0.7 0.9 ‐0.1 1.3 1.4 ‐0.1 2.3 2.8 ‐0.5 3.9 4.1 ‐0.2
R62048 0.4 0.5 ‐0.1 0.6 0.7 ‐0.1 0.9 1.1 ‐0.2 1.6 2.0 ‐0.4 2.3 2.9 ‐0.6
R62064 0.5 0.6 ‐0.1 0.6 0.7 ‐0.1 1.1 0.9 0.2 1.8 2.0 ‐0.2 3.0 3.1 ‐0.1
S41064 0.7 1.4 ‐0.7 1.3 2.9 ‐1.3 2.1 3.7 ‐1.6 3.3 4.5 ‐1.2 4.1 5.3 ‐1.2
S61064 0.6 0.7 ‐0.1 0.8 0.9 ‐0.1 1.5 2.1 ‐0.6 3.0 3.0 0.0 3.9 3.4 ‐0.5
S61379 0.5 0.7 ‐0.2 0.7 1.0 ‐0.3 1.2 1.3 ‐0.1 1.8 1.8 0.0 2.8 2.3 0.5
S62048 0.3 0.3 0.0 0.5 0.5 0.0 0.7 0.8 ‐0.1 1.1 1.3 ‐0.2 1.4 1.8 ‐0.4
Mean ‐0.43 ‐0.54 ‐0.70 ‐0.62 ‐0.39
[a] Flour pellet drop size data is from DeBoer and Monnens (2001).
in drop size parameters which was expected given the significant differences shown in figures 2 and 4 for these two sprinklers. If these two sprinklers are omitted from the comparison summary, mean differences between the two measurement methods for d10, d25, d50, d75, and d90 drop
sizes are ‐0.11, ‐0.10, ‐0.21, ‐0.27, and ‐0.21 mm, respective‐ ly. These mean differences are similar to the mean differ‐ ences reported by DeBoer et al. (2001) when comparing the CIT laser (drop size modified by Kincaid et al., 1996) and flour pellet methods.
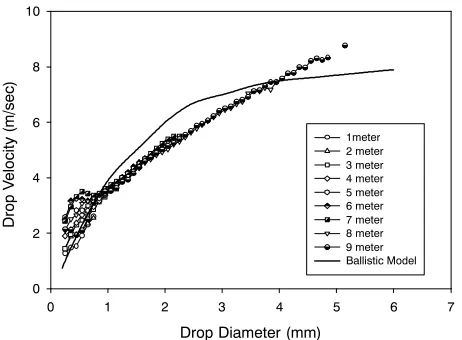
Mean velocity measured by the TCLPM over the range of measured drop sizes for distances of 1 to 9 m from the R62064 sprinkler are shown in figure 5. Computed tangential drop velocity 2.5 m below the sprinkler using the drop ballistic model of Kincaid (1996) is also shown in figure 5 for comparison. The measured and computed velocities were similar but not equal. This outcome was expected as the ballistic model is based on the assumption that drops form at the edge of the spray plate and travel as individual spherical objects in still air. Mean measured drop velocities for 0.3 to 0.9 mm size drops at distances greater than 2m from the sprinkler were greater than that predicted by the ballistic model. This is likely due to drop formation from the breakup of larger drops in flight rather than at the edge of the spray plate. When formed, these smaller drops are traveling at the
Drop Diameter (mm)
0 1 2 3 4 5 6 7
Drop V
elocity
(m/sec)
0 2 4 6 8 10
1meter 2 meter 3 meter 4 meter 5 meter 6 meter 7 meter 8 meter 9 meter Ballistic Model
Figure 5. Comparison of drop velocity measured by the TCLPM at 1‐ to 9‐m distances from the R62064 sprinkler with velocity calculated using the ballistic model of Kincaid (1996) for a range drop sizes.
velocity of the parent drop and immediately begin to decelerate but pass through the TCLPM laser beam at a higher velocity than predicted by the ballistic model.
Measured drop sizes greater than 4.0 mm (fig. 5) also had a higher mean measured velocity than predicted by the ballistic model. This was likely due to large drops being formed from the breakup of a larger mass of water (liquid flow sheet) some distance from the sprinkler plate, and thus experienced less overall drag force than predicted by the ballistic model for individual drops formed at the edge of the spray plate.
Mean measured velocities of drop sizes between 0.9 and 4.0 mm (fig. 5) were less than predicted by the ballistic model with a maximum difference of about 1 m/s for a 2.0‐mm drop size. This difference between measured and predicted drop velocities may be the result of measurement error, ballistic model error, or both. The TCLPM measured velocity is the velocity component normal to the face of the laser beam. The angle of the TCLPM was visually set normal to the trajectory of the drops at a given distance from the sprinkler. This was not difficult for distances less than 3 m or greater than 7 m from the sprinkler as the majority of the drops were of the same trajectory angle. However, between these radial distances drop trajectory was highly variable, which made setting the angle difficult and also means that not all drops passed through the laser beam normal to its face. Thus, the measured velocity of some drops was less than actual tangential velocity. This measurement error is likely part of the reason for measured velocity less than predicted velocity based on the ballistic model.
range could experience drag forces greater than assumed in the ballistic model (Vories et al., 1987; Hinkle, 1991). Detailed analysis of the mechanics of water exiting the nozzle, energy transfer to water mass leaving the sprinkler spray‐plate, and drop drag forces was beyond the scope of this study.
Kinetic energy per unit volume applied water (J/L) from each sprinkler, calculated from TCLPM measured drop size and velocity is listed in table 3. Values calculated using the model developed by Kincaid (1996) and the method of DeBoer (2002) are also given in table 3 for comparison. Kinetic energy predicted by the Kincaid (1996) model consistently resulted in higher values than those calculated from TCLPM measured drop size and velocity, on average 3.9 J/L greater. This difference was likely the result of Kincaid (1996) reduction in drag coefficient to account for water drops leaving the sprinkler plate as a liquid sheet rather than individual drops. Kinetic energy values calculated using the method of DeBoer (2002) using four pellet method drop size data and his ballistic model ranged from ‐1.3 to 3.4 J/L greater than values calculated from TCLPM data, with an average difference of ‐0.4 J/L. Based on a paired t‐test, there was no significant difference (pv0.05) between kinetic energy values calculated using TCLPM drop size and velocity data and method of DeBoer (2002) for the 10 sprinklers used in this study.
Practical field application of drop size information for moving spray‐plate sprinklers is the qualitative or quantitative comparison of potential runoff and erosion hazard of center pivot sprinklers for irrigation system design. In this study, use of the TCLPM to measure drop size distribution did not provide significantly different results from the flour pellet method or the CIT laser method for 8 of the 10 sprinklers tested. Based on this limited study, the results from the drop size measurement methods can be vastly different for sprinklers under operating conditions that produce relatively compact streams of water drops. Which method is more accurate for this condition remains unknown. However, the operating conditions when the methods did not compare well were outside sprinkler manufacturer recommendations.
Table 3. Comparison of kinetic energy per unit volume (J/L) of sprinkler discharge determined using three methods
and differences (D) in calculated energy using
TCLPM measured drop diameter and velocity.
Sprinkler
TCLPM Kinetic Energy
Kincaid (1996) Model
DeBoer (2002) Method
Kinetic Energy Δ Kinetic Energy Δ
R41064 14.2 24.3 ‐10.1 14.2 0
R61064 9.2 18.0 ‐8.8 12.6 ‐3.4
R61348 12.0 14.8 ‐2.8 11.5 0.5
R61379 13.5 16.4 ‐2.9 12.5 1.0
R62048 10.3 12.8 ‐2.5 11 ‐0.7
R62064 12.1 13.5 ‐1.4 10.8 1.3
S41064 10.7 NA NA 12.3 ‐1.6
S61064 11.3 15.0 ‐3.7 10.8 ‐0.5
S61379 10.9 14.3 ‐3.4 11.2 ‐0.3
S62048 6.9 10.7 ‐3.8 8.2 ‐1.3
Mean ‐3.9 ‐0.4
The TCLPM used in this study cost roughly $6,000 and allowed the drop size distribution of a moving spray‐plate sprinkler to be determined in 20 h or less with minimal labor requirement beyond equipment setup, infrequent observation of equipment operation, and computerized data analysis. Besides drop size measurement, the TCLPM allows the velocity of the drops to be determined and used in calculation of kinetic energy per unit volume of water applied. Kinetic energy values calculated using TCLPM measured data were not significantly different from values determined using the method of DeBoer (2002) based on flour pellet method drop size data and ballistic model for estimating sprinkler drop tangential velocity.
Critical threshold values of sprinkler kinetic energy for minimizing or eliminating runoff and erosion hazard for various soil types is unknown. Thus, highly accurate values of kinetic energy applied by sprinkler discharge are of limited value, but easy, reliable, and highly reproducible estimates are of value for practical field application. Center pivot sprinkler irrigation design decisions such as sprinkler flow rate and/or spacing along lateral, operating pressure and sprinkler type could potentially be selected based on relative comparison of kinetic energy values as a means to incorporate potential runoff and erosion hazard in system design. A laser instrument such as the TCLPM used in this study can be used to obtain reliable estimates of moving spray‐plate sprinkler kinetic energy per unit volume of applied water for various sprinkler types and operating conditions. This information could be provided by sprinkler manufactures (or independent third party testing organizations) along with other sprinkler specifications of nozzle flow rate and wetted diameter. A database of kinetic energy values could be used to revise the model of Kincaid (1996) or develop improved models to be incorporated into center pivot sprinkler irrigation system design guides or software.
S
UMMARYANDC
ONCLUSIONSDrop size distributions from moving spray‐plate sprinklers were determined using a Thies Clima Laser Precipitation Monitor (TCLPM) for 10 select sprinklers and compared to drop size distribution data obtained using the flour pellet method. Measured drop size distributions for 8 of the 10 sprinklers were not significantly different. However, the operating conditions when the two methods did not compare well were outside sprinkler manufacturer specifications. Based on this limited study the results from the two drop size measurement methods can be vastly different for sprinklers under operating conditions that produce relatively compact streams of water drops; which method was more accurate for this condition remains unknown.
to obtain reliable estimates of moving spray‐plate sprinkler kinetic energy per unit volume of applied water for various sprinkler types and operating conditions.
R
EFERENCESCarrión, P. J., J. M. Tarjuelo, and J. Montero. 2001. SIRIAS: A simulation model for sprinkler irrigation: I. Description of model. Irrig. Sci. 20(2): 73‐84.
Chen, D., and W. W. Wallender. 1985. Droplet size distribution and water application with low‐pressure sprinklers. Trans. ASAE
28(2): 511‐516.
DeBoer, D. W. 2002. Drop and energy characteristics of a rotating spray‐plate sprinkler. J. Irrig. and Drain. Eng. 128(3): 137‐146. DeBoer, D. W., M. J. Monnens, and D. C. Kincaid. 2001.
Measurement of sprinkler drop size. Applied Eng. in Agric.
17(1): 11‐15.
DeBoer, D. W., and M. J. Monnens. 2001. Application pattern and drop size distribution data sets for a rotating‐plate sprinkler. Research Report, Brooking, S.D.: Department of Agricultural and Biosystems Engineering, South Dakota State University. De Wrachien, D., and G. Lorenzini. 2006. Modelling jet flow and
losses in sprinkler irrigation: Overview and perspective of a new approach. Biosystems Eng. 94(2): 297‐309.
Donnadieu, G. 1980. Comparison of results obtained with the VIDIAZ Specto_Pluviometer and the Joss‐Waldvogel rainfall disdrometer in a ”rain of a thundery type.” J. Appl. Meteor.
19(5): 593‐597.
Edling, R. J. 1985. Kinetic energy, evaporation and wind drift of droplets from low pressure irrigation nozzles. Trans. ASAE
28(5): 1543‐1550.
Hall, M. J. 1970. Use of the stain method in determining the drop‐size distribution of coarse liquid sprays. Trans. ASAE
13(1): 33‐37.
Hauser, D., P. Amayenc, B. Nutten, and P Waldteufel. 1984. A new optical instrument for simultaneous of raindrop diameter and fall speed distributions. J. Atmos. Oceanic Tech. 1(3): 256‐269. Hinkle, S. E. 1991. A modified empirical drag coefficient for water
drop ballistics. Applied Eng. in Agric. 7(1): 75‐80. Kincaid, D. C. 1996. Spraydrop kinetic energy from irrigation
sprinklers. Trans. ASAE 39(3): 847‐853.
Kincaid, D. C., K. H. Solomon, and J. C. Oliphant. 1996. Drop size distributions for irrigation sprinklers. Trans. ASAE 39(3): 839‐845.
Kohl, R. A. 1974. Drop size distribution from a medium sized agricultural sprinkler. Trans. ASAE 17(5): 690‐693.
Kohl, R. A., and D. W. DeBoer. 1984. Drop size distribution for a low pressure spray type agricultural sprinkler. Trans. ASAE
27(6): 1836‐1840.
Kohl, R. A., R. D. von Bernuth, and G. Heubner. 1985. Drop size distribution measurement problems using a laser unit. Trans ASAE 28(1): 190‐192.
Kohl, R. A., and D. W. DeBoer. 1990. Droplet characteristics of a rotating spray plate sprinkler. ASAE Paper No. 902612. St. Joseph Mich.: ASAE.
Li, J., H. Kawano, and K. Yu. 1994. Droplet size distributions from different shaped sprinkler nozzles. Trans. ASAE 37(6): 1871‐1878.
Lorenzini, G. 2004. Simplified modeling of sprinkler droplet dynamics. Biosystems Eng. 87(1): 1‐11.
McCreery, G. E., and C. M. Stoots. 1996. Drop formation
mechanisms and size distributions for spray plate nozzles. Intl. J. Multiphase Flow 22(3): 431‐452.
Mohammad, D., and R. A. Kohl. 1987. Infiltration response to kinetic energy. Trans. ASAE 30(1): 108‐111.
Montero, J., J. M. Tarjuelo, and P. Carrión. 2001. SIRIAS: A simulation model for sprinkler irrigation: II. Calibration and validation of model. Irrig. Sci. 20(2): 85‐98.
Montero, J., J. M. Tarjuelo, and P. Carrión. 2003. Sprinkler droplet size distribution measured with an optical spectropluviometer.
Irrig. Sci. 22(1): 47‐56.
Salles, C., J. D. Creutin, and D. Sempere‐Torres. 1998. The optical spectro pluviometer revisited. J. Atmos. Oceanic. Tech. 15(5): 1216‐1223.
Salles, C., J. Poesen, and L. Borselli. 1999. Measurement of simulated drop size distribution with an optical spectro pluviometer: sample size considerations. Earth Surf. Process. and Landforms 24(6): 545‐556.
Salles, C., and J. Poesen. 1999. Performance of an optical spectro pluviometer in measuring basic rain erosivity characteristics. J. Hydrol. 218(3‐4): 142‐156.
Seginer, I. 1965. Tangential velocity in sprinkler drops. Trans.
ASAE 8(1): 90‐93.
Seginer, I., D. Mir, and R. D. von Bernuth. 1991. Simulation of wind‐distorted sprinkler patterns. J. Irrig. Drain. Eng. 117(2): 285‐305.
Solomon, K. H., D. C. Kincaid, and J. C. Bezdek. 1985. Drop size distributions for irrigation spray nozzles. Trans. ASAE 28(6): 1966‐1974.
Solomon, K. H., D. F. Zoldoske, and J. C. Oliphant. 1991. Laser optical measurement of sprinkler drop sizes. In Automated Agriculture for the 21st Century Proc., 87‐96. St. Joseph,
Mich.: ASAE.
Solomon, K. H., D. F. Zoldoske, and J. C. Oliphant. 1996. Center for Irrigation Technology, Standard Notes, Laser optical measurement of sprinkler drop sizes. CATI Publication #961101. Available at:
http://cati.csufresno.edu/cit/rese/96/961101/index.html. Accessed 9 March 2010.
Steele, R. G. D., and J. H. Torrie. 1980. Principles and Procedures of Statistics. New York, N.Y.: McGraw‐Hill.
Stillmunkes, R. T., and L. G. James. 1982. Impact of water droplets from irrigation sprinklers. Trans. ASAE 25(1): 130‐133. Thompson, A. L., and L. G. James. 1985. Water droplet impact and
its effect on infiltration. Trans. ASAE 28(5): 1506‐1510, 1520. von Bernuth, R. D., and J. R. Gilley. 1984. Sprinkler droplet size
estimation from single leg test data. Trans. ASAE 27(5): 1441‐1453.
Vories, E. D., R. D. von Bernuth, and R. H. Mickelson. 1987. Simulating sprinkler performance in wind. J. Irrig. and Drain.