Adv. Radio Sci., 5, 273–278, 2007 www.adv-radio-sci.net/5/273/2007/ © Author(s) 2007. This work is licensed under a Creative Commons License.
Advances in
Radio Science
Optimized power allocation for iterative multiuser detection for a
SC-CDMA uplink
P. Weitkemper1, K. Zielinski2, K.-D. Kammeyer1, and R. Laur2
1Department of Communications Engineering, University of Bremen, Otto-Hahn-Allee, 28359 Bremen, Germany 2Institute for Electromagnetic Theory and Microelectronics, University of Bremen, Otto-Hahn-Allee, 28359 Bremen, Germany
Abstract. This paper deals with optimization of the re-ceived power profile for iterative parallel and successive in-terference cancellation (PIC/SIC) in coded CDMA systems. For practical implementation additional constraints should be applied. This paper focuses on the maximum tolerable bit error rate. It will be shown that optimized power pro-file can considerably gain the overall system performance. Due to unequal required receive powers an allocation to cer-tain users can be done with respect to their individual power constraints. This is important especially in near-far scenar-ios. Beside these constraints also the maximum number of iterations is implemented due to limiting the computational complexity in the receiver.
1 Introduction
Nonlinear iterative multi-user detection exploiting channel decoding is a well known approach to increase the possible system load while still achieving single-user performance. Analysis of the PIC scheme has been done by different ap-proaches (Schlegel and Shi, 2004; Boutros and Caire, 2002; Kuehn, 2004) and the possibility of power profile optimiza-tion has been shown in e.g. Caire et al. (2004). So far opti-mization of receive power distribution was done with a sim-ple optimization goal and only few constraints. The focus was on minimizing the sum over all received powers which may be feasable for downlink but not for uplink scenarios. The constraint was ensuring all users to have a maximum tolerable bit error rate which is the most interesting point in practicle systems, but single user performance is not re-quired implicitly. If the SINR is still higher than the SNR but sufficiently small for the desired BER, there is no need for increasing the power further only to reach this certain Correspondence to: P. Weitkemper
point. In the uplink of a cellular network, individual power constraints have to be considered. One possibility is to as-sume additional constraints for individual powers of the users which was presented in Weitkemper et al. (2006). A more general approach used in this paper is not to minimize the sum over all powers but the maximum power which results in a more homogeneous distribution. Furthermore some ad-ditional constraints are considered which take practical im-plemetation issues into account e.g. maximum number of it-erations. For successive interference cancellation the analy-sis is more difficult because the statistics of the users differ from each other. The generalization of the analysis to SIC and the basics of power profile optimization were presented in Weitkemper et al. (2005).
The paper is organized as follows: Sect. 2 introduces the system model of the considered CDMA system. In Sect. 3 the analysis based on multi-user efficiency (MUE) (Boutros and Caire, 2002) is described and applied to the parallel inter-ference cancellation. The generalized MUE analysis of SIC is given in Sect. 4. In Sect. 5 power profile optimization is introduced for both detection schemes. Results for different optimization objects and additional constraints are presented and discussed in Sect. 6. A conclusion is given in Sect. 7.
2 System model
In order to simplify derivations and notation we assume a synchronous single carrier- (SC-) CDMA system with a com-plex AWGN channel and pseudo-noise spreading sequences (Verd´u, 1998). The number of active users is denoted byU. The information bit vector of theu-th user is denoted by du,
which is encoded by a convolutional code of rateRc=1/2
that is identical for all users. The coded bit sequence is BPSK-modulated and interleaved by a user-specific random interleaver 5u of length L. Finally the signals are spread
with random spreading codessu(k)∈{−1/
√
N ,+1/
√
274 P. Weitkemper et al.: Optimized power allocation for iterative multiuser detection for a SC-CDMA uplink
! ! !
Fig. 1. Receiver structure of PIC.
denotes the chip andl the symbol index. The lengthN of the sequencessu(k)is called spreading factor andβ=U/N
denotes the system load. b is assumed to be the vector com-prising BPSK symbols of all users at a particular time in-stance and C is theN×U spreading matrix. It contains the vectors of spreading sequences as columns each multiplied with an individual phase term of the channel. The received vector containing the superposition of the spread signals of all users and the noise can be described in vector-matrix no-tation, yielding
y=Cb+n. (1)
For notational simplicity time indices have been dropped. The vector n represents the complex additive white Gaussian noise with covariance matrixσn2I. At the receiver a bank of matched filters (MF) is applied for despreading and the real-valued matched filter output can be written as
r=RenCHyo=RenCHCo | {z }
R
b+RenCHno | {z }
˜ n
. (2)
The elements of R contain the real part of the correlation co-efficients%ij=Reρij between thei-th and thej-th user’s
signature sequence with E{|ρij|}i6=j=1/N. The multi-user
interference characterized by these correlation coefficients degrades the performance significantly even for moderate system loads if individual decoding and hard decision is ap-plied to these matched filter outputs. Interference cancella-tion techniques are able to improve performance significantly by estimating the multi-user interference and cancelling it be-fore detection. Additional gain is achieved by iterative struc-tures.
3 Multi-user efficiency
Figure 1 shows the structure of a parallel interference can-celler. In order to get at least approximated extrinsic log-likelihood-ratiosLe(bu)at low computational cost, the
Max-Log-MAP channel decoder is applied. The soft estimates
0 0.2 0.4 0.6 0.8 1
0 0.1 0.2 0.3 0.4 0.5 0.6 0.7 0.8 0.9 1
Fig. 2. Predicted transfer functions and trajectories for PIC,N=4,
U=10/16,Eb/N0=6 dB.
of the coded symbols b¯ are calculated as b¯=tanh(Le/2).
The signal-to-interference-plus-noise-ratio (SINR) of each branch is a parameter indicating the quality of the interfer-ence cancellation and is defined as SINR=2σd2/(σn2+σMUI2 ). It is equal to the SNR=2Es/N0 in the case of perfect in-terference cancellation which is equivalent to the single-user bound (SUB).σd2andσMUI2 describe the variance of the de-sired signal and of the remaining multi-user interference af-ter cancellation respectively. The lataf-ter can be calculated as
σMUI2 =σd2 ·µ(U−1)/N. The remaining mean squared er-ror of the estimated symbols after decoding is denoted as
µ=E{| ¯b−b|2}which is approximately the same for each user in the case of PIC. The ratio of SINR and SNR is called multi-user efficiency (MUE) and is denoted byη (Boutros and Caire, 2002). Perfect interference cancellation is indi-cated byη=1 and therefore describes the case with no loss compared to the SUB. For the large system limit (N, U→∞)
(U−1)/N≈U/N=β,ηcan be written as
η= SINR
SNR =
2σd2/(σn2+σMUI2 )
2σd2/σ2
n
= 1
1+βµEs/N0
. (3) The parameterη can be used to visualize and predict the behavior of an iterative detection scheme. In the initial it-eration there is no a-priori information available for inter-ference cancellation. The soft bits are initialized with zero, the varianceµis therefore equal to 1 and the MUE becomes
P. Weitkemper et al.: Optimized power allocation for iterative multiuser detection for a SC-CDMA uplink 275
0 2 4 6 8 10 12 14 16 10−6
10−5 10−4 10−3 10−2 10−1
coded uncoded
Fig. 3. Coded and uncoded error rate for a AWGN channel and [7
5] convolutional code.
m-th iteration depends on the SINR at the input
µ(m)=g (SINR)=gη(m−1)SNR (4)
and therefore on the MUE of the previous iterationη(m−1). Becauseη(m)itself depends onµ(m)the behavior of the PIC at iterationmcan be described by η(m)=f η(m−1)
. This function is depicted in a two-dimensional plot in Fig. 2. The transfer function describes the theoretical behavior and the trajectory gives the measured values during simulation. The detection starts in the lower left corner and tends to the upper right corner. This point corresponding toη = 1 describes perfect interference cancellation. It can be seen that the be-havior is predicted very precisely. This plot corresponds to a system with a spreading factor N=4, U=10/16 users, an
Eb/N0of 6 dB and a convolutional code with generator poly-nomials[7, 5]8. The system with 10 users will converge to the SUB within 7 iterations. In the case of 16 users there is an intersection between the transfer function and the bisect-ing line so the detection gets stuck atη≈0.15.
Since multi-user efficiency is a relative quantity, the per-formance assuming the uncoded BER has to be calculated by
Pb= 1
2 ·erfc r
SINR 2
!
=1
2 ·erfc s
P
2σ2
n !
(5)
ηonly includes information about the error probability be-fore channel decoding. As the coded bit error rate is the important parameter for QoS requirements, a connection be-tween these error probabilities have to be considered. The coded and uncoded BER for the [7 5] code is shown in Fig. 3.
0 0.2 0.4 0.6 0.8 1 0
0.2 0.4 0.6 0.8 1
0 0.2 0.4 0.6 0.8 1 0
0.2 0.4 0.6 0.8 1
0 0.2 0.4 0.6 0.8 1 0
0.2 0.4 0.6 0.8 1
0 0.2 0.4 0.6 0.8 1 0
0.2 0.4 0.6 0.8 1
! "$# ! %"&#
! "$# ! %"&# ' "( *) ' "( ,+
' "& *)-) ' "& *)&+
Fig. 4. Predicted and simulated trajectories for SIC,N=8,U=16 andEb/N0=6 dB.
4 Analysis of successive interference cancellation
The difference concerning successive interference cancella-tion is the processing of the users one after another. The parameters change not only after 1 iteration but during the iterations when decoding each individual user. Therefore the prediction in the same manner as for PIC is not possi-ble. While for PIC the error varianceµis the same for all users in the large system limit, this is not the case for SIC. TheU users have different variancesµ(m)u at each iteration m. The remaining errors of the users are assumed to be in-dependent. So a simple addition of their variances weighted with the corresponding correlation coefficient can be applied for calculating the resulting interference on the desired user signal. For that reason the MUE can be calculated by
ηu(m)= 1
1+ 1
N u−1
P
i=1
µ(m)i +
U P
i=u+1
µ(mi −1) !
Es
N0
. (6)
276 P. Weitkemper et al.: Optimized power allocation for iterative multiuser detection for a SC-CDMA uplink
10−4 10−3
10−2 10−1
−10 −5 0 5 10 15
PSfrag replacements
SINR in dB
→
P
b,max→
optimal distribution
equal power
SUB
P
mean(9)
P
min(9)
P
max(9)
P
mean(8)
P
min(8)
P
max(8)
SINR
in
dB
→
P
bmax→
optimal distribution
equal power
user 1
user 2
user 3
user 4
Fig. 5. Required receive power of all users dependent on the
re-quired BER for different expressions to be minimized (Eqs. 8 and 9).
5 Power profile optimization
5.1 Formulation of the optimization problem
Up to now the analysis was based on uniformly distributed powers of the users. To describe an unequal power distribu-tion by multi-user efficiency, a way to calculate a kind of av-erage efficiency is necessary (Schlegel and Shi, 2004). Thus the resulting multi-user efficiency can be calculated more generally as
ηu=
1 1+ E¯s
N0 1
N P
v6=u µv·Pv
, X
v
Pv=U . (7)
¯
Es/N0 is defined as an average value over all users in or-der to get an appropriate criterion for fair comparison with the equal power case. The criterion for convergence is still reaching the point ofη=1 after a finite number of iterations. For the PIC this is fulfilled iff (η)>η , η∈[0,1]. The num-ber of iterations needed depends on the width of the tunnel. Whether the tunnel is open or not depends also on the power distribution. For PIC it turns out that equal power for all users is not the best choice, as presented e.g. in Schlegel and Shi (2004) and Caire et al. (2004). The optimization problem for PIC can be described by Caire et al. (2004)
min
P1,..,PU X
u
Pu s. t. (
f (η)>η+ε , η∈[0;1]
Pu >0 , u=1, ...U
(8) if the sum of all received powers should be minimized and single user performance for all users is claimed. These
con-0 0.2 0.4 0.6 0.8 1 0
0.1 0.2 0.3 0.4 0.5 0.6 0.7 0.8 0.9 1
PSfrag replacements
η
(
m
)→
η(m−1)
→
optimal distribution equal power
user 1
user 2
user 3
user 4
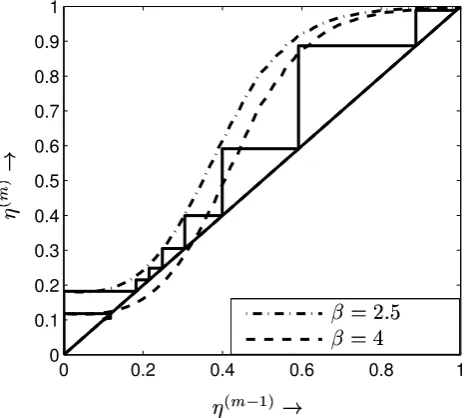
Fig. 6. Transfer function with optimized power profile for
Pbmax=0.2 andβ=4.
ditions can be adapted to the particular need. For example in this work it will be
min
P1,..,PU max
u Pus. t.
Pb(u)6Pbmax∀u=1, ...U
Nit 6Nit max∀u=1, ...U
Pu>0∀u=1, ...U
(9) For taking a maximum number of iterations into account, not the transfer function but the trajectory is used for the first constraint. After each iteration up to the maximum the MUE for all users is calculated and either this value or the corre-sponding BER is considered. For the SIC a similar expres-sion is used although the calculation ofηis different (Eq. 6). 5.2 Differential evolution
P. Weitkemper et al.: Optimized power allocation for iterative multiuser detection for a SC-CDMA uplink 277
10−4 10−3
10−2 10−1
−10 −5 0 5 10 15
PSfrag replacements
η
(m)→
η
(m−1)→
optimal distribution
equal power
P
meanSIC
P
meanPIC
P
minSIC
P
minPIC
P
maxSIC
P
maxPIC
P
minSIC
user 2user 3
user 4
SINR
in
dB
→
P
b,max→
optimal distribution
equal power
SUB
mean minmax
minimum minmax
maximum minmax
mean minsum
minimum minsum
maximum minsum
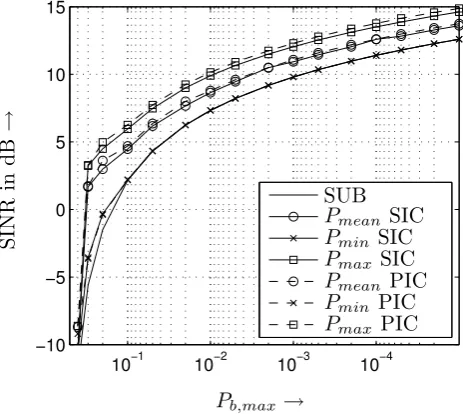
Fig. 7. Required receive power of all users dependent on the
re-quired BER for SIC and PIC,β=4, 20 iterations, mimimized ac-cording to Eq. (9).
due to an adaptive step size. Additionally, it is easy to use because of the few control parameters.
The starting population is generated randomly and should be sufficiently large for a high diversity. In this case a popu-lation size ofNP=80 is used. Standard settings are used for other control parameters (Zielinski et al., 2005a). Popula-tion members of the current populaPopula-tion are combined using the evolutionary operators mutation, recombination and se-lection to generate the next generation until a stopping con-dition is fulfilled. In this case the distribution of population members is monitored and the algorithm terminates when the maximum distance of every individual to the best population member is beneath a threshold (Zielinski et al., 2005b). In Section 6 the number of generations is restricted to 1000 due to limited computational resources.
6 Optimization results
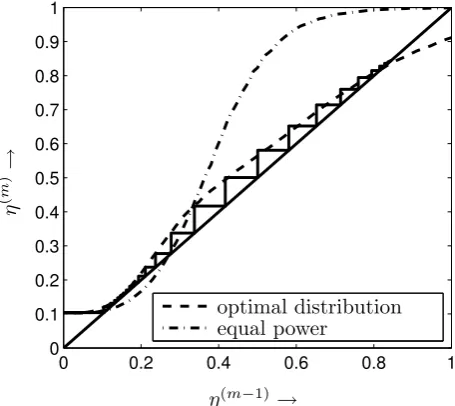
As noted before in this paper not the sum of all powers is minimized but the maximum power. This seems to be more sufficient for cellular networks. Consequently, the overall power maybe increased but in the uplink the individual power constraint is the limiting point. In Fig. 5 are minimum, max-imum and mean powers of the optimized profile depicted, which were optimized for different maximum uncoded BER. The lower bound for the receive power is the single user case. In this figure the difference between the optimization criteria (8) and (9) can be observed. The mean power is lower in the case of Eq. (8) which was the aim of this approach. But the maximum required power is up to 1 dB higher than for approach (9) over the whole BER range.
1e−11e−2
1e−31e−4
1e−5
5
10
15 0
5 10 15 20
Fig. 8. Power profiles for differentPbmaxassuming Eq. (8).
1e−11e−2
1e−31e−4
1e−5
5
10
15 0
5 10 15 20
Fig. 9. Power profiles for differentPbmaxassuming Eq. (9).
278 P. Weitkemper et al.: Optimized power allocation for iterative multiuser detection for a SC-CDMA uplink minimizing the sum of all powers. It can be seen that with
de-creasing error rate the number of users having a higher power than for the single user case gets smaller. But the ammount of power required for these users grows disproportionate to the minimum power. This behavior fulfills the requirement of minimum overall receive power, but in practice these high powers may not be possible. In Fig. 9 the power distribu-tions with minimizing the maximum power can be seen. The number of users having an increased power is much higher than in Fig. 8 but the absolute maximum is smaller. In gen-eral the distribution gets more homogeneous. This distribu-tion is more appropriate to practical cellular networks. In consideration of near-far effects the powers can be allocated to the users depending on their individual power constraint. For PIC the allocation order has no influence on the system performance and for SIC the detection order can be adapted if necessary. But as already observed in Weitkemper et al. (2005) the order of detection has minor influence at these high loads.
Any combination of individual and total power constraint can be implemented very easy. Even specific maximum sup-portable power by certain users can be taken into account.
7 Conclusions
In this paper some aspects of power profile optimization were investigated. The maximum bit error rate was considered as main constraint. At low BER this constraint gives dif-ferent results than claiming convergence to the SUB. Addi-tionally the expression to be minimized was adapted to the scenario of uplink communiaction in cellular networks. Not the overall power but the individual power is strictly limited and should be saved. So the optimization focusses on min-imizing the maximum power. The results differ as well in general shape of the profiles as in the required maximum and mean power. Furthermore limited number of iterations was taken into account due to the limited time and resources for decoding in the base station. All these aspects deliver an op-timization suitable for practicle system requirements.
References
Boutros, J. and Caire, G.: Iterative Multiuser Joint Decoding: Uni-fied Framework and Asymptotic Analysis, IEEE Transactions on Information Theory, 48, 1772–1793, 2002.
Caire, G., Mueller, R., and Tanaka, T.: Iterative Multiuser Joint De-coding: Optimal Power Allocation and Low-Complexity Imple-mentation, IEEE Transactions on Information Theory, 50, 1950– 1973, 2004.
Kuehn, V.: Analysis of Iterative Multi-User Detection Schemes with EXIT Charts, in: IEEE International Symposium on Spread Spectrum Techniques and Applications (ISSSTA), Sydney, Aus-tralia, 2004.
Price, K.: An Introduction to Differential Evolution, in: New Ideas in Optimization, edited by: Corne, D., Dorigo, M., and Glover, F., pp. 79–108, McGraw-Hill, London, 1999.
Schlegel, C. and Shi, Z.: Optimal Power Allocation and Code Selec-tion in Iterative DetecSelec-tion of Random CDMA, in: Zurich Semi-nar on Digital Communications, 2004.
Verd´u, S.: Multiuser Detection, Cambridge University Press, 1998. Weitkemper, P., K¨uhn, V., and Kammeyer, K.-D.: Analysis of It-erative Successive Interference Cancellation in SC-CDMA Sys-tems, in: Fifth International Workshop on Multi-Carrier Spread-Spectrum (MC-SS 2005), Oberpfaffenhofen, Germany, 2005. Weitkemper, P., Zielinski, K., Kammeyer, K.-D., and Laur, R.:
Op-timization of Interference Cancellation in Coded CDMA Sys-tems by Means of Differential Evolution, in: 4th International Symposium on Turbo Codes & Related Topics, Munich, Ger-many, 2006.
Zielinski, K., Peters, D., and Laur, R.: Constrained Multi-Objective Optimization Using Differential Evolution, in: Third Interna-tional Conference on ComputaInterna-tional Intelligence, Robotics and Autonomous Systems, Singapore, 2005a.
![Fig. 3. Coded and uncoded error rate for a AWGN channel and [75] convolutional code.](https://thumb-us.123doks.com/thumbv2/123dok_us/9655935.1948016/3.595.50.287.63.270/fig-coded-uncoded-error-rate-awgn-channel-convolutional.webp)