S H O R T C O M M U N I C A T I O N
Open Access
An experimental phantom study of the
effect of gadolinium-based MR contrast
agents on PET attenuation coefficients
and PET quantification in PET-MR imaging:
application to cardiac studies
Jim O
’
Doherty
1*and Paul Schleyer
2* Correspondence: [email protected] 1PET Imaging Centre, Division of
Imaging Sciences and Biomedical Engineering, King’s College London, King’s Health Partners, St. Thomas’ Hospital, 1st Floor, Lambeth Wing, Westminster Bridge Road, London SE1 7EH, UK
Full list of author information is available at the end of the article
Abstract
Background:Simultaneous cardiac perfusion studies are an increasing trend in PET-MR imaging. During dynamic PET imaging, the introduction of gadolinium-based PET-MR contrast agents (GBCA) at high concentrations during a dual injection of GBCA and PET radiotracer may cause increased attenuation effects of the PET signal, and thus errors in quantification of PET images. We thus aimed to calculate the change in linear attenuation coefficient (LAC) of a mixture of PET radiotracer and increasing concentrations of GBCA in solution and furthermore, to investigate if this change in LAC produced a measurable effect on the image-based PET activity concentration when attenuation corrected by three different AC strategies.
Findings:We performed simultaneous PET-MR imaging of a phantom in a static scenario using a fixed activity of 40 MBq [18 F]-NaF, water, and an increasing GBCA concentration from 0 to 66 mM (based on an assumed maximum possible
concentration of GBCA in the left ventricle in a clinical study). This simulated a range of clinical concentrations of GBCA. We investigated two methods to calculate the LAC of the solution mixture at 511 keV: (1) a mathematical mixture rule and (2) CT imaging of each concentration step and subsequent conversion to LAC at 511 keV. This comparison showed that the ranges of LAC produced by both methods are equivalent with an increase in LAC of the mixed solution of approximately 2% over the range of 0–66 mM.
We then employed three different attenuation correction methods to the PET data: (1) each PET scan at a specific millimolar concentration of GBCA corrected by its corresponding CT scan, (2) each PET scan corrected by a CT scan with no GBCA present (i.e., at 0 mM GBCA), and (3) a manually generated attenuation map, whereby all CT voxels in the phantom at 0 mM were replaced by LAC = 0.1 cm−1. All attenuation correction methods (1–3) were accurate to the true measured activity concentration within 5%, and there were no trends in image-based activity concentrations upon increasing the GBCA concentration of the solution. (Continued on next page)
(Continued from previous page)
Conclusion:The presence of high GBCA concentration (representing a worst-case scenario in dynamic cardiac studies) in solution with PET radiotracer produces a minimal effect on attenuation-corrected PET quantification.
Keywords:PET-MR, Attenuation correction, Cardiac PET
Introduction
Gadolinium-based contrast agents (GBCA) represent the most common types of magnetic resonance contrast agents, used primarily as a T1 contrast agent. GBCA con-sist of transitional (i.e., heavy) metal Gd ions bound by chelating agents to form a stable complex of relatively low toxicity [1]. Many GBCA have different molecular structures yet similar pharmacokinetic properties, and therefore, few differences can be discerned in clinical practice [2]. Paramagnetic ions such as Gd3+ in GBCA dissolved in an aqueous solution act as microscopic magnets in the local environment causing water protons to“feel”a large magnetic moment and thus a local change in the average relax-ation time. They are most commonly employed due to a predominant shortening of T1 relaxation time, which results in an increased signal intensity on a T1-weighted image (known as positive enhancement).
The use of simultaneous PET-MR (positron emission tomography-magnetic reson-ance) in cardiology opens up the potential for the simultaneous injection of a PET per-fusion tracer (such as [15O]-H2O, [13N]-NH3, or [82Rb]-Cl) with GBCA for parallel myocardial perfusion quantification using both methodologies. Also, as cardiac MR im-aging is prone to scanner-dependent calibration curves and saturation effects [3, 4], this quantification methodology could also allow direct comparison between calculated PET and MR perfusion variables and quantification techniques [5].
Previous investigations of the effect of GBCA in clinical PET-MR imaging have shown that MR-based attenuation maps acquired via a two-point VIBE-based DIXON sequence (whereby an automated segmentation algorithm provides four different tissue classes: fat, soft tissue, lung, and air) may be affected only by orally administered iron-oxide-based contrast agent and that neither intra-venous injec-tions nor orally administered GBCA significantly affect the attenuation of the PET emission data [6]. This group’s work looked at clinically relevant concentrations of GBCA for static whole-body imaging, determining a worst-case scenario for the concentration in the blood. However, not yet investigated are the technical consid-erations for a dynamic simultaneous PET-MR acquisition, such as those required for calculation of an image-derived input function and myocardial uptake curves in PET cardiology studies.
Material and methods Solution preparation
In order to simulate a “worst-case scenario” of the maximum possible GBCA concen-tration in the left ventricle of the heart during clinical imaging, an assumption was made that an entire bolus of GBCA can be present in the left ventricle. Thus, we as-sumed a maximum bolus volume of 20 ml being diluted in an average end diastolic left ventricle volume (EDV) of 150 ml (142 ± 21 ml is a reported EDV range [7]). Assuming 20 ml of 0.5 mmol/ml solution GBCA in the left ventricle, the molar concentration of GBCA (from Table 1) can reach a potential maximum of approximately 70 mM. After ejection of the GBCA from the heart, the concentration in the left ventricle then quickly reduces (over approximately 30–50 s) as it distributes into a larger blood vol-ume. Thus, our static experiments aimed to cover the minimum to potential maximum range of GBCA concentrations in the left ventricle during the times that both MR and PET arterial input functions are measured on resulting reconstructed images.
A thin plastic bottle (max volume = 160 ml, d= 5 cm, h= 8.5 cm) was filled with 120 ml of distilled water together with 40 MBq of [18F]-NaF in 0.2 ml (as measured in a standard dose calibrator with ±5% accuracy) in order to provide measurements of PET activity concentration.
We then added DOTAREM 0.5 mmol/l [8]—a GBCA utilized throughout our hospital—in incremental 3-mM steps until a 30-mM solution was reached (ten concentration steps). After reaching 30 mM, 4-mM steps (ten steps in total) were added to make a solution with final concentration of 66 mM. At each concentration step, the solution was scanned on a CT scanner followed by a PET-MRI scanner.
Scanning
CT images were acquired only for calculation of the LAC of the solution on a GE Discovery 710 PET-CT scanner (140 kV, 20 mA, 0.5-s rotation, 40-mm collimation). No PET scanning was performed on the PET-CT scanner. PET-MR scans were performed on a simultaneous whole-body PET-MR scanner (Siemens Biograph mMR, Siemens Health-care, Erlangen, Germany) located next door to the PET-CT scanner. Each PET-MR scan lasted 3 min, and all PET data was decay corrected to a common time point.
By default, during PET scanning, an MR-based attenuation correction (MRAC) se-quence was performed with each PET-MR scan at each GBCA concentration step. This
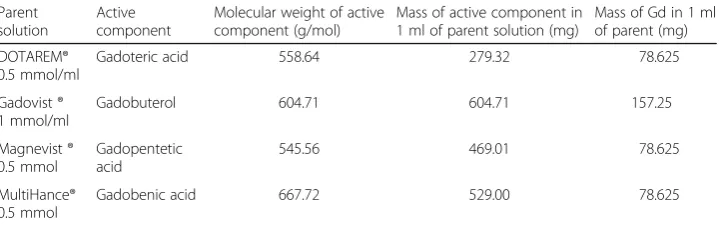
Table 1The composition of common MR contrast agents in terms of the amount of Gadolinium present in the solution from the summary of product characteristics datasheets
Parent solution
Active component
Molecular weight of active component (g/mol)
Mass of active component in 1 ml of parent solution (mg)
Mass of Gd in 1 ml of parent (mg)
DOTAREM® 0.5 mmol/ml
Gadoteric acid 558.64 279.32 78.625
Gadovist ® 1 mmol/ml
Gadobuterol 604.71 604.71 157.25
Magnevist ® 0.5 mmol
Gadopentetic acid
545.56 469.01 78.625
MultiHance® 0.5 mmol
Gadobenic acid 667.72 529.00 78.625
was generated using the standard dual-point VIBE T1-weighted Dixon sequence pro-vided by the manufacturer on the scanner.
Mixture rule for calculation of LAC
In order to understand how the introduction of GBCA can affect the image-based PET activity concentration during simultaneous PET-MR, it is important to understand the attenuation properties of the different components at 511 keV. Data for the mass at-tenuation coefficient (MAC—characterizes how easily the material is penetrated by gamma radiation) of Gd and water are shown in Fig. 1 [9]. At 150 kV (close to the CT energy of 140 kV), markedly different MACs of 1.1 and 0.1505 cm2/g for Gd and water, respectively can be observed. However, at 500 kV (close to PET gamma energy of 511 keV), these MACs are more similar, 0.1139 and 0.0969 cm2/g for Gd and water, re-spectively. The measured LAC of other tissues of the body at 511 keV are also similar at this energy [9] (skeletal muscle = 0.1010 cm−1[10], adipose tissue = 0.09 cm−1[11], and whole blood = 0.0905 cm−1[11]).
The MAC of a homogenously mixed solution can be approximated by Hubbell’s weighted average mixture rule for homogenous solutions with photon energies >10 keV [9]:
μM solnð Þ¼
X
iμMð Þiwð Þi ð1Þ
whereμM(soln)represents the MAC of the total solution andμM(i)andw(i)represent the
MAC (cm2/g) and fractional weight of the ithcomponents of the mixture. Given that
the solution of GBCA can be approximated to a mixture of gadolinium (Gd) and water (wa), this can be written as:
μM solnð Þ¼μMð Þwawð Þwa þμM Gdð Þwð ÞGd ð2Þ
Thus assuming that the measured values of MAC at 500 keV are representative of those at 511 keV, in order to determine the MAC, and hence, the LAC (LAC = MAC * solution density), the total mass of solution and fractional weights of water and gadolinium are re-quired. Given thatμM(wa)andμM(Gd)at 511 keV are 0.9687 and 0.1139 cm2/g, respectively (from Fig. 1), the final mixture will haveμM(soln)confined toμM(Gd)>μM(soln)>μM(wa).
Image reconstruction and analysis
Investigation of LAC
All CT images were reconstructed on the PET-CT scanner using a filtered back-projection (FBP) algorithm as standard on the scanner software. Transformation from Hounsfield units (HU) to LAC at 511 keV was performed offline using a bi-linear calibration curve (140 kVp) as implemented on the PET-CT scanner. LAC values applied to the images by the MRAC segmentation procedure (each voxel in the image represents LAC × 10,000) were obtained from the MR attenuation map by viewing the images on the scanner software and noting down the common LAC value applied to each voxel of the solution in the phantom.
PET quantification
In order to quantify any effect, a change in GBCA concentration (and hence a change in LAC) of the solution may have on final PET image data, attenuation correction of the PET data is required. All PET data were reconstructed on the PET-MR scanner using standard clinical reconstruction parameters (OSEM, 3 iterations, 21 subsets, 344 image matrix). PET data was not reconstructed using the default MRAC algorithm provided on the scanner of each GBCA step, instead PET emission sinograms were attenuation corrected with three different methods:
1. AC1—Each PET image corrected by its corresponding CT-derived attenuation map. Each CT-derived attenuation map was registered to the MR-derived attenuation map using a rigid registration through Niftyreg software [12] and subsequently uploaded to the PET-MR scanner for attenuation correction of PET data.
2. AC2—A CT-derived attenuation map with LAC values resulting from a CT scan of the phantom at 0 mM (i.e., no GBCA present). The dataset was registered and uploaded to the scanner as described for method AC1.
3. AC3—A manually generated attenuation map whereby all CT voxels in the phantom were manually set to 0.1 cm−1.
tissue” LAC value as would be assigned by the MRAC segmentation algorithm on clinical scanning.
All PET and CT image analyses were performed in OsiriX [Pixmeo SARL, Geneva, Switzerland]. A rectangular volume of interest (VOI) corresponding to a central portion of the solution was drawn on the phantom (volume = 75 cm3) at each concen-tration step. The average HU, image-based PET activity concenconcen-tration (kBq/ml), and VOI standard deviations were obtained from the relevant slices (28 CT slices, 50 PET slices). Resulting PET data were decay corrected to a common time point and were also corrected for the increasing volume of the solution in order to visualize differences from the true activity concentration and from the LAC of the solution at 0-mM concentration.
Results
Investigation of LAC
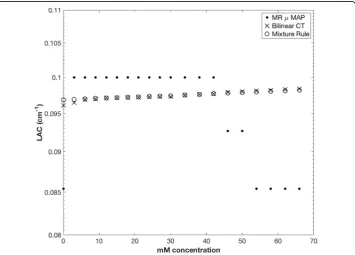
Figure 2 shows a comparison of LAC with increasing GBCA concentration for the mix-ture rule (Eq.2) and resulting LAC from CT scanning (bi-linear conversion from HU to LAC at 511 keV). LACs as generated by the MRAC segmentation are also shown for comparison only. LACs of the solution generated from CT imaging show a maximum increase of approximately 2% over the range of 0 and 66 mM, which correlates well with the increase predicted from the mixture model as described above.
Effect on PET quantification
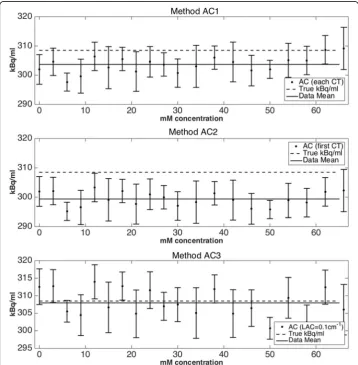
Figure 3 shows the effect of the different attenuation correction strategies (AC1, AC2, and AC3) on the quantification of PET data. The true activity concentration in the phantom was calculated at each time point from the knowledge of the original activity placed in the phantom, compensated for decay, and also the increasing volume at each concentration step. The image-based activity concentra-tion is comparable across all three attenuaconcentra-tion correcconcentra-tion methods, and no trends are visible with increasing GBCA. Error bars in the activity concentration represent the mean kBq/ml ± one standard deviation of the mean, in order to indicate the level of noise present in the resulting images. It should be noted that in dynamic imaging a higher level of noise is likely to be obtained due to short frame times (potentially as short as 5–10 s depending on the imaging protocol), and low noise here indicates good count statistics only.
Discussion
Our primary goal in these experiments was to evaluate the change in LAC of a mixture of PET radiotracer and increasing concentrations of GBCA, and also to investigate if this change produces a measurable effect on the image-based PET activity concentration.
Investigation of LAC
As proposed by Fig. 1, the effect of increasing concentrations of GBCA on quantification of image-based PET activity concentration should be limited to a very small range between the MAC of water and gadolinium at a photon energy of 511 keV.
As detailed in Fig. 2, LAC comparisons via bi-linear CT closely match the LAC values resulting from the mixture rule calculations (Eq.2) with an increase of approximately 2% in LAC over the increasing GBCA range of 0 to 66 mM. This details that, in general, the mixture model can be utilized to predict the LAC of a solution of water and GBCA for phantom studies. Erroneous values of LAC derived from the MRAC segmentation procedure are shown in Fig. 2 for comparison to the data derived from the mixture model and from CT imaging only. Studies have shown in vivo the T1- and T2-shortening effects due to the use of GBCA in contrast enhancement studies, with a range from 30 to 68% shortening of T1 post administration of 0.1 mmol/kg body weight [13]. The effect of GBCA on clinically derived MR attenuation maps has recently been demonstrated [14], showing an overestimation of image-based activity concentration due to an assignment of part of the lung tissue to the soft tissue by the MRAC due to the presence of GBCA. This produced a measurable effect due to the large difference in LAC between the lung and soft tissue. In a simultaneous PET-MRI clinical cardiac acquisition, the AC procedure would be free from the influences of GBCA if the MRAC scan were performed before the administration of GBCA. However, if additional MRAC are performed after GBCA administration, effects of GBCA on the segmentation algorithm have to be taken into account.
Effects on PET quantification
important to note also that the solution in our study was water mixed with tracer and GBCA, rather than blood (MACBLOOD= 0.0959 cm2/g at 511 keV), which may produce a different effect on LAC determination from the automatic segmentation routine.
Our assumption of all of the GBCA pooling in the left ventricle together with the radiotracer is likely to be an overestimation of the true scenario. In practical circumstances, the GBCA in cardiac MR studies is injected at a rate of 3 ml/s. With a standard heart rate of 60 bpm, GBCA would be cleared rapidly from the ventricle, indicating that the true GBCA concentration during a dynamic acquisition is likely to be a lot lower that 66 mM. However, we have addressed a broad concentration range of GBCA up to this maximum point.
Static imaging, in order to investigate the effects of GBCA on image-based activity concentration, was performed in order to control all parameters except GBCA concentration rather than the use of a dynamic phantom whereby concentrations of both GBCA and PET radiotracer are both changing rapidly. The use of a dynamic cardiac perfusion phantom for investigations into quantification of MR cardiac perfu-sion studies [15] would allow the investigation of the attenuation effects on dynamically acquired PET and MR input functions. Use of such high concentration of GBCA (66 mM) may lead to effects of signal saturation (itself potentially corrected for by adjustment of the magnetization flip angle in gradient echo sequences [16]) in the derivation of an MR input function, the effects of which could also be investigated with a phantom. Furthermore, the use of an anthropomorphic torso phantom with cardiac insert could provide a more realistic comparison to a clinical scenario (i.e., such as scattering of gamma ray photons). This would have required regular access to the cardiac chamber of the phantom which was impractical with the amount of steps of increasing concentration used in this study. Also, the study was concerned mainly with a carefully controlled study of the quantitative accuracy of PET when mixed in solution with GBCA, and thus, a true patient representation was not required.
In order to avoid the potential confounding effects of dead time on the PET scanner when all of the radiotracer is placed in the field of view of the scanner, we utilized a PET activity of [18 F]-NaF of 40 MBq. This represents an activity far lower than that usually received by patients at our center undergoing [13 N]-NH3 cardiac imaging. The effect of dead time has been quantified on previous cardiac studies on PET-CT systems, for example, the effect on myocardial perfusion quantification [17], and also the limit of dead time losses by weight-based activity administration protocols [18]. Dead time effects have yet to be investigated in cardiac PET-MR imaging. As this work investigated the effect of GBCA on image-based measurements of PET activity concentration, the total activity in the phantom is not an important factor, as any GBCA effect would have the same contribution regardless of the total activity. We also aimed to reduce the radiation dose to the operator as much as possible due to multiple handling, filling, and transport steps performed.
Conclusion
2% over the 0–66 mM range. The quantitative accuracy of the resulting reconstructed PET images when attenuation corrected by CT data, and also a manually applied attenu-ation map is minimally affected by the presence of the GBCA.
Acknowledgements
JOD acknowledges financial support from the Department of Health through the National Institute for Health Research (NIHR) comprehensive Biomedical Research Centre award to Guy’s and St Thomas’NHS Foundation Trust in partnership with King’s College London and King’s College Hospital NHS Foundation Trust and The Centre of Excellence in Medical Engineering funded by the Wellcome Trust and EPSRC under grant number WT 088641/Z/09/Z. The views expressed are those of the authors and not necessarily those of the NHS, the NIHR, the DoH, EPSRC, or the Wellcome Trust.
PS is an employee of Siemens Healthcare UK.
The authors are grateful to the two anonymous reviewers for their constructive comments on the drafts of this manuscript.
Author’s contributions
JOD and PS both designed the study. JOD carried out phantom preparations, acquisitions, and reconstructions on both PET-CT and PET-MR scanning. JOD and PS analyzed and interpreted the resulting data, and drafted and revised the manuscript. Both authors approved the final manuscript.
Competing interest
The authors declare that they have no competing interest.
Author details
1
PET Imaging Centre, Division of Imaging Sciences and Biomedical Engineering, King’s College London, King’s Health Partners, St. Thomas’Hospital, 1st Floor, Lambeth Wing, Westminster Bridge Road, London SE1 7EH, UK.2Siemens
Healthcare Limited, Frimley, Camberley, UK.
Received: 22 May 2016 Accepted: 7 January 2017
References
1. Hao D, Ai T, Goerner F, Hu X, Runge VM, Tweedle M. MRI contrast agents: basic chemistry and safety. J Magn Reson Imaging. 2012;36(5):1060–71.
2. Pintaske J, Martirosian P, Graf H, et al. Relaxivity of gadopentetate dimeglumine (Magnevist), gadobutrol (Gadovist), and gadobenate dimeglumine (MultiHance) in human blood plasma at 0.2, 1.5, and 3 tesla. Invest Radiol. 2006;41(3):213–21.
3. Jerosch-Herold M. Quantification of myocardial perfusion by cardiovascular magnetic resonance. J Cardiovasc Magn Reson. 2010;12:57.
4. Keenan K, Stupic KF, Boss MA, Russek SE. Standardized phantoms for quantitative cardiac MRI. J Cardiovasc Magn Reson. 2015;17 Suppl 1:W36.
5. Morton G, Chiribiri A, Ishida M, et al. Quantification of absolute myocardial perfusion in patients with coronary artery disease: comparison between cardiovascular magnetic resonance and positron emission tomography. J Am Coll Cardiol. 2012;60(16):1546–55.
6. Lois C, Bezrukov I, Schmidt H, et al. Effect of MR contrast agents on quantitative accuracy of PET in combined whole-body PET/MR imaging. Eur J Nucl Med Mol Imaging. 2012;39(11):1756–66.
7. Maciera AM, Prasad SK, Pennell DJ. Normalized left ventricular systolic and diastolic function by steady state free precession cardiovascular magnetic resonance. J Cardiovasc Magn Reson. 2006;8(3):417–26.
8. DOTAREM ® summary of product characteristics. http://www.guerbet-us.com/products/dotarem.html. Available at: http://braccoimaging.com/sites/braccoimaging.com/files/technica_sheet_pdf/MultiHance.pdf Prescribing Information.pdf. Accessed 10 Feb2016.
9. Hubbell JH, Seltzer SM. Tables of X-ray mass attenuation coefficients and mass energy-absorption coefficients from 1 keV to 20 MeV for elements Z = 1 to 92 and 48 additional substances of dosimetric interest (version 1.4) [Online]. NIST Physical Reference Data [2004; https://www.nist.gov/pml/x-ray-mass-attenuation-coefficients. Accessed 13 Feb 2016.
10. Hubbell JH. Photon cross sections, attenuation coefficients, and energy absorption coefficients from 10 keV to 100 GeV. Washington, DC: National Bureau of Standards; 1969.
11. International Committee on Radiation Units & Measurements. Tissue substitutes in radiation dosimetry and measurement. Bethesda: ICRU; 1989.
12. Ourselin S, Roche A, Subsol G, Pennec X, Ayache N. Reconstructing a 3d structure from serial histological sections. Image Vis Comput. 2001;19(1–2):25–31.
13. Yamada S, Kubota R, Yamada K, et al. T1 and T2 relaxation times on gadolinium-diethylenetriaminepentaacetic acid enhanced magnetic resonance images of brain tumors. Tohoku J Exp Med. 1990;160:145–8.
14. Rischpler C, Nekolla SG, Kunze KP, Schwaiger M. PET/MRI of the heart. Semin Nucl Med. 2015;45(3):234–47. 15. Chiribiri A, Schuster A, Ishida M, et al. Perfusion phantom: an efficient and reproducible method to simulate myocardial
first-pass perfusion measurements with cardiovascular magnetic resonance. Magn Reson Med. 2013;69(3):698–707. 16. De Naeyer D, Verhulst J, Ceelen W, Segers P, De Deene Y, Verdonck P. Flip angle optimization for dynamic
contrast-enhanced MRI-studies with spoiled gradient echo pulse sequences. Phys Med Biol. 2011;56(16):5373–95. 17. O’Doherty J, Schleyer P, Pike L, Marsden P. Effect of scanner dead time on kinetic parameters determined from