Allah Haafiz
1, Yuan-Xiang Pan
2, Donald Novak
1*
Placental Amino Acid Transport System A
– an Assessment of SNAT1 and SNAT2 Expression
in F1 and F2 Placentas in a Rat Model of Gestational
Protein Restriction*
System A łożyskowego transportu aminokwasów
– ocena ekspresji SNAT1 i SNAT2 w łożyskach pokolenia F1 i F2
na szczurzym modelu ograniczenia podaży białka w ciąży
1 Department of Pediatrics, University of Florida College of Medicine, USA
2 Department of Food Science & Human Nutrition, University of Illinois at Urbana-Champaign, USA
Abstract
Background. Gestational protein restriction (GPR) can program a fetal phenotype prone to develop metabolic
syn-drome in successive generations. Although mechanisms are not well characterized, placental amino acid transport system A (SysA) activity is depressed in the setting of GPR.
Objectives. To determine mechanisms of GPR-induced SysA-adaptations in F1 and F2 placentas.
Material and Methods. Rats (F0) were pair-fed either a 19% normal protein diet (NPD) or an 8% low protein diet (LPD)
through pregnancy and lactation. F1 placentas were studied for SNAT1 and SNAT2 mRNA and SNAT1 protein. Male and female offspring (F1) were bred to control animals and allowed to deliver at term at which time placentas were col-lected for the same studies. Transient transfection of HEK 293 cells was done using p-CMV-FLAG-SNAT2 or the control vector. After 36 hours of transfection, MeAIB transport, expression of SNAT2 mRNA and proteins were assessed.
Results. In F1 placentas, steady-state mRNA content of SNAT1 (140 ± 13 vs. 99 ± 11 arbitrary mRNA units;
p ≤ 0.01) and SNAT2 (81 ± 6, n = 10 vs. 104 ± 9 arbitrary mRNA units; p ≤ 0.001) were higher in LPD than NPD group. An opposite but non-significant trend in mRNA expression of both isoforms was evident in F2 placentas. Despite up-regulation of mRNA in F1 placentas, SNAT1 immunoblot bands were comparable from placental-apical-membranes (0.62 ± 0.13 vs. 0.63 ± 0.13 arbitrary units; p = 0.9), basal-membranes (0.9 ± 0.14 vs. 1 ± 0.06 arbitrary units; p = 0.6) and placental-homogenates (0.5 ± 0.16 vs. 0.7 ± 0.1 arbitrary units; p = 0.3) between LPD and NPD group. Similar results were seen in F2 placental SNAT1 protein expressions. SNAT2- mRNA over-expression by transient transfection with pLPCX-FLAG-SNAT2 construct vs. control vector in HEK 293 cells resulted in up-regulation of both SNAT2 protein and Na+ dependent MeAIB transport (1243 ± 137 vs. 390 ± 27 pmole .1mg .1 min; p ≤ 0.0008).
Conclusions. 1. Although GPR-induced SysA repression is associated with up-regulation of SNAT1 and SNAT2
mRNA in F1 placentas, the protein content is unchanged suggesting post-transcriptional regulation of SysA expres-sion and function. Up-regulation of SNAT2 protein and transport activity following SNAT2-mRNA-over-expresexpres-sion noted in our tissue culture studies support this conclusion. 2. If maternal nutrition is optimized, GPR-induced SysA F1 placental abnormalities are not replicated in F2 placentas (Adv Clin Exp Med 2010, 19, 5, 563–572).
Key words: nutrient gene interaction, fetal programming, fetal origins of adult disease, metabolic syndrome, amino
acid transport system A.
Streszczenie
Wprowadzenie. Ograniczenie podaży białka w ciąży (GPR) może zaprogramować u płodu fenotyp skłonności do
wystąpienia zespołu metabolicznego w kolejnych pokoleniach. Chociaż mechanizmy tego zjawiska nie są dobrze poznane, wiadomo, że w warunkach GPR aktywność łożyskowego systemu A transportu aminokwasów (SysA) jest ograniczona.
Adv Clin Exp Med 2010, 19, 5, 563–572 ISSN 1230-025X
ORIGINAL PAPERS
© Copyright by Wroclaw Medical University
Compromised intrauterine growth is well rec-ognized for its relationship with subsequent insulin resistance, a prime biochemical aberration linked to adulthood metabolic syndrome (MetS) [1–4]. MetS and the related cardiovascular complications are emerging global health hazards affecting 30–35% of Americans [5, 6] and comparable European popu-lations [7]. Although intra-uterine growth-retar-dation (IUGR) can result from distinct etiologies, maternal malnutrition continues to be the most important preventable cause of IUGR, especially in developing countries. Underlying genomic changes linking IUGR and subsequent evolution to insulin resistance remain elusive. To elucidate these mech-anisms, rodents are commonly utilized to model IUGR, often through gestational protein restric-tion (GPR). Indeed low-protein diet (LPD) during rodent-pregnancy induces IUGR, proportional to the degree of protein deprivation [8]. As such the link between maternal-GPR and evolution of typi-cal biochemitypi-cal and phenotypic displacements in subsequent generations is well established [9, 10]. In addition, more recently, using similar rodent model, we have documented that MetS-prone phe-notype can be transmitted by paternal-GPR as well [11], expanding the scope of possible fetal metabol-ic changes (a.k.a “fetal programming”) destined to emerge as MetS in successive generations.
Whereas these developments firmly establish the link between GPR and fetal metabolic pro-gramming, fundamental questions remain: what is the scope of placental-fetal adaptations in the
setting of GPR; how do these adaptations impact fetal metabolic programming; can we utilize these adaptations to assign a relative risk of developing MetS-prone-phenotype in a given infant with IU-GR; and if so, what are the most critical time-frames and interventions necessary to interrupt the meta-bolic and phenotypic evolution. Concerted efforts encompassing both basic and translational studies are required to answer these complicated and inter-twined questions. The critical initial steps to answer these questions are tied to elucidating placental-fetal adaptive changes in the setting of GPR. Us-ing a rat model of GPR, we have documented that placental amino acid transport System A (SysA) expression and function is regulated in response to GPR [12, 13]. Furthermore, most recently, we have documented the evolution of MetS-prone pheno-type in F2 animals descending from both males and females subjected to GPR [11]. The most re-markable placental adaptation noted in this study was the significant down-regulation of SysA activ-ity in first generation placentas, which was briskly restored when maternal diet was optimized in sec-ond generation pregnancies. The aim of the work presented here was to understand the mechanisms of placental-SysA repression in the setting of GPR. Using the same model and protocol involving two generations, we have investigated the placental so-dium-coupled neutral amino acid transporter gene member 1 (SNAT1) protein and mRNA expression of SNAT1 and SNAT2, the two ubiquitous SysA-isoforms. Quite interestingly, as reported in the
Cel pracy. Ocena mechanizmów przystosowania się SysA pod wpływem GPR w łożyskach pokoleń F1 i F2. Materiał i metody. U szczurów (F0) podczas ciąży i laktacji zastosowano dietę z 19% odpowiednią zawartością
białka (NPD) i z 8% małą zawartością białka (LPD). W łożyskach F1 badano zawartość białek SNAT1 i SNAT2 mRNA i SNAT1. Potomstwo płci męskiej i żeńskiej (F1) krzyżowano ze zwierzętami z grupy kontrolnej. Młode rodziły się o czasie, wtedy pobierano łożyska do badań. Wykonano przejściową transfekcję komórek HEK 293 za pomocą p-CMV-FLAG-SNAT2 lub wektora kontrolnego. Po 36 godzinach transfekcji oceniono transport MeAIB, ekspresję SNAT2 mRNA i białka.
Wyniki. W łożyskach F1, zawartość SNAT1 w stanie równowagi mRNA (140 ± 13 vs 99 ± 11 umownych jednostek mRNA, p ≤ 0,01) i SNAT2 (81 ± 6, n = 10 vs 104 ± 9 umownych jednostek mRNA, p ≤ 0,001) była większa w gru-pie LPD niż w grugru-pie NPD. Odwrotna, ale nieistotna tendencja w ekspresji mRNA obu izoform była widoczna w łożyskach F2. Mimo zwiększonej aktywacji mRNA w łożyskach F1, prążki SNAT1 błon szczytowych łoży-ska (0,62 ± 0,13 vs 0,63 ± 0,13 umownych jednostek, p = 0,9), błon podstawnych (0,9 ± 0,14 ± 0,06 vs 1 umownych jednostek, p = 0,6) i homogenat łożyska (0,5 ± 0,16 vs 0,7 ± 0,1 umownych jednostek p = 0,3) były porównywalne między LPD a grupy NPD. Podobne wyniki obserwowano w ekspresji białka SNAT1 w łożyskach F2. Nadekspresja SNAT2 w mRNA przez przejściową transfekcję pLPCX-FLAG-SNAT2 vs wektor kontrolny w komórkach HEK 293 powodowała zwiększoną regulację zarówno białka SNAT2, jak i Na+
zależnego transportu MeAIB (1243 ± 137 vs 390 ± 27 pmol jednostki; p ≤ 0,0008).
Wnioski. Chociaż ograniczenie SysA wywołane przez GPR jest związane z nadmierną aktywacją SNAT1 i SNAT2 w
mRNA w łożyskach F1, zawartość białka nie zmienia się, co sugeruje potranskrypcyjną regulację ekspresji i czynno-ści SysA. Nadmierna aktywacja białka SNAT1 i transport zachodzący pod wpływem nadekspresji SNAT2-mRNA wykryte w badanych tkankach potwierdza ten wniosek. Jeśli stan odżywienia matki jest optymalny, to zaburzenia SysA wywołane przez GPR w łożyskach F1 nie są replikowane w łożyskach F2 (Adv Clin Exp Med 2010, 19, 5,
563–572).
Słowa kluczowe: interakcja gen żywienie, programowanie płodu, płodowe pochodzenie chorób dorosłych, zespół
result section, contrary to SysA function, transcrip-tional activity of both SNAT1 and SNAT2 were up-regulated in first generation placentas, indicating a post-transcriptional control of SysA activity in the setting of GPR. Using tissue culture system, we then addressed the most logical next question: in biologi-cal systems, without feedback inhibitions, how ef-ficiently is the transcriptional over-expression of SysA genes translated into enhanced SysA-activity? We addressed this question by transient transfec-tion of highly transfectable HEK 293 cells with a FLAG-containing vector by inserting SNAT2-full-coding-sequence in the construct.
Material and Methods
Animal Studies
Study Design
All studies were approved by the Institutional Animal Care Committee at the University of Flori-da. Timed-pregnant Sprague-Dawley (Harlan) rats were obtained on day 5 of gestation and weight matched into low protein (8% protein diet, n = 22) and control (19% protein diet, n = 22) groups. An-imals were pair-fed throughout pregnancy as we have described [14]. Maternal animals and pups (F1) were continued on their respective diets until day 21, at which time standard rat chow was given
ad libitum. On approximately day 70 of life, both control (N = 9) and experimental F1 females (N = 10) were mated with “outside” Sprague-Dawley males; whereas, control (N = 12) and experimental males (N = 10) were mated with “outside” primipa-rous females of approximately the same age. These animals were offered normal diet and allowed to deliver at term when placentas were collected for the downstream analysis. All animals were housed with ad libitum access to water and 12 hour light-dark cycles.
Diets
Diets were purchased from Purina Inc (India-napolis, IN). First generational experimental ani-mals (LPD) received an 8% protein diet that con-sisted of 71.4% carbohydrate, 8% protein, 10% fat, 4.3% fiber. The control animals (NPD) received an isocaloric 19% protein diet that contained 60.6% carbohydrates, 19.3% protein, 10% fat and 4.3% fiber.
Sample preparation
Preparation of placental apical and basal pre-dominant membrane vesicle/protein and enzyme determinations: Apical and basal enriched
mem-brane preparations were prepared as previously de-scribed [15]. Similarly, activities of alkaline phos-phatase, a markerfor the apical membrane (AM), and [3H] dihydroalprenolol binding, a marker for
the basal membrane (BM), weredetermined by methods used previously [15]. Membrane protein content was determined by Lowry’s method utiliz-ing bovine serum albumin as standard.
RNA isolation from placenta: Total cellu-lar RNA was isolated from single placentas using the Qiagen RNeasy Kit (Qiagen, Valencia, CA) according to the manufacturer’s instructions. Briefly, 20–30 mg of placenta was homogenized under liquid nitrogen and 600 µL of the manu-facturer’s RLT buffer (containing 10 µL/mL of β-mercapthoethanol) was added to the homog-enate. The mixture was loaded onto a QIAshred-der spin column and centrifuged for 2 minutes at 13,000 × g for 2 min at room temperature. The lysate was then mixed with an equal volume of 70% ethanol and passed through an RNeasy col-umn by centrifugation at 10,000 × g for 1 minute. The column was washed once with 700 µL of the manufacturer’s RW1 buffer and twice with 500 µL of Qiagen’s RPE buffer, each wash consisted of a 1 min centrifugation at 10,000 × g. The column was centrifuged again for 1 min at 13,000 × g to re-move any residual wash buffer. For elution of the RNA, 50 µL of RNase-free water was added to the column and incubated at room temperature for 1 minute before centrifuging the column for 1 min at 10,000 × g to collect the eluted RNA.
Immunoblotting
Proteins were isolated from placental mem-brane preparations as noted before. Protein aliquots (50 µg/lane) were separated on 10% SDS-PAGE using standard techniques and electrotransferred to a 0.45-µm nitrocellulose membrane. Immu-no-blotting was performed by using anti-SNAT1
polyclonal (primary) antibody as described by Va-roqui [16]. Immunoreactive bandswere detected with goat anti-mouse antibody conjugated to horseradish peroxidase(HRP) and detected by enhanced chemiluminescence. Bands were ana-lyzed by densitometry using Quantity One (Bio-Rad) software.
Measurement of Steady-state mRNA
Expression
hundred ng of total RNA was used in each reac-tion. The reactions were first incubated at 50°C for 30 min followed by 95°C for 15 min and then amplification of 35 cycles of each at 95°C for 15 s, 60°C for 60 s for SNAT2 and 62.5°C for 60 s for SNAT1. The primers utilized were SNAT1: (for-ward 5’-3’ TCAGCCTGGTACGTCGATGG, re-verse 5’-3’ CCAGGTTCTTCAAGAGACACAG), SNAT2: (forward 5’-3’ AGAGCAATTCCAG-TATTAGC, and reverse 5’-3’ TTAATCTGAG-CAATGCGATTGTG). After PCR, melting curves were acquired by stepwise increase of the tem-perature from 55°C to 95°C to ensure that a single product was amplified in the reaction. For an en-dogenous control, separate reactions were done for rat β-actin and asparagine synthetase mRNA. There was no difference in the expression of these genes between control and experimental placen-tas.
Tissue Culture Studies
Generation of FLAG-SNAT2 Vectors
pCMV-Tag2c (Stratagene) was used to gener-ate a pCMV-FLAG-SNAT2 construct. A 2.5 kb cDNA fragment of rat SNAT2 containing the en-tire coding region and 900 bp of 3’-untranslated region was generated by XhoI restriction enzyme digest from a 2.7 kb cDNA fragment cloned in plasmid pcDNA3.1. The 2.5 kb fragment was then sub-cloned into the XhoI site in the multiple cloning region of the pCMV-Tag2c vector. The FLAG tag was oriented to be upstream to and in frame with the SNAT2 translation start codon. To eliminate a stop codon (TGA) that existed at 22 nt upstream of the SNAT2 ATG start codon, site-directed mutagenesis was conducted to mutate T to G to make GGA (Gly). The FLAG-orientation and proper alignment with SNAT2 was confirmed by DNA sequencing. Similar steps were performed to generate pLPCX-FLAG-SNAT2 construct. Pre-liminary studies confirmed comparable transfec-tion efficiencies of both SNAT2 containing vec-tors and were therefore used interchangeably for transcriptional and transport studies. In each case, concordant FLAG-containing empty vectors were used as controls.
Transient Transfection
with FLAG-SNAT2 Constructs
Typically HEK 293 cells (1.5 × 10⁶) were
plat-ted on 60 mm dishes and grown to 50% confluence. Transfections were then carried out in triplicate either using p-CMV-FLAG-SNAT2 or the control vector using Fugene 6 (Roche, Indianapolis, IN) according to the manufacturers guidelines. The cells were grown for 36 hours at 37°C in a
humidi-fied atmosphere of 5%CO2/95% air before
down-stream protein or mRNA analysis (vide infra).
RNA Isolation
Total cellular RNA was isolated from cells us-ing the Qiagen RNeasy Kit (Qiagen, Valencia, CA) according to the manufacturer’s instructions. For 60 mm dishes medium was aspirated and 600 µL of the manufacturer’s RLT buffer containing 10 µL/mL of β-mercapthoethanol was added to each dish. The rest of the steps were identical to description in RNA isolation noted in previous section.
Protein Extraction
and Immunoblotting
At completion of 36 hours of transfection the media was discarded and cells resuspended in 1 mL of lysis buffer and proteins isolated. Proteins were separated on a 7.5% SDS/PAGE and electrotrans-ferred to a polyvinylidene difluoride (PVDF) membrane. The membranes were incubatedwith 3% blocking solution (3% (w/v non-fat dry milk, 50 mM Tris-base, 0.138 M NaCl, 2.7 mM Kcl, pH 8) at room temperature for 30 minutes with 50–60 rpm agitation. Immunoblotting was performedusing anti-FLAG M2 monoclonal antibody (Sigma) at 1:1000 dilutions with TBS and 3% nonfat dry milk at room temperature for 30 minutes. The blots were washed 1 × 5 min in TBS on a shaker and then incubated with peroxidase-conjugatedgoat anti-mouse secondary antibody (Life technolo-gies, Gaithersburg, MD) at a 1:20000 dilution for 30 min at room temperature.The blots were then washed for 5 × 4 min in Tris-buffered saline/Tween (50 mM Tris-base, 0.138 M NaCl, 2.7 mM Kcl, pH 8 plus 0.05% tween 20).The bound secondary antibodywas detected by using an enhanced che-miluminescence kit (AmershamBiosciences) and exposed to Biomax MR film(Kodak).
Transport Studies
Wells were coated with acid soluble calf skin collagen (Sigma ac-3511) at 10 µg in 0.5 ml water/ /well and left on room temperature under ultra-violet light overnight. Next day the fluid was aspi-rated and the wells were air dried for 4 hours un-der ultraviolet light. 393 T cells were seeded at 0.05 million cells/well. At 24 hours when the cells were 60–70% confluent, transfections were performed in 6 wells with 0.2 ug DNA/well containing either pCMV-Tag2c-SNAT2 or pCMV-Tag2c control vector using Fugene 6 transfection reagent. Cells in six wells were grown with out transfection as a negative control.
Krebs-Ring-ers phosphate buffer (choline-KRP). To initiate transport,[³Η]-MeAIB in 250 µl of either NaKRP (sodium-containing Krebs-Ringers phosphate buffer) or choline-KRP (37°C) was added simulta-neouslyto each of the wells for 1 min. The trans-portmeasurement was terminated by discarding the radioactivity andrapidly washing the cells five times with 2 ml of ice-cold choline-KRP.The Na+-dependent transport is taken as the
differ-ence between uptakein NaKRP and choline-KRP. After air drying, cellular protein was precipitated with 10% TCA, and the supernatant radioactivity analyzed by liquid scintillation counting. Proteins were solubilized in 0.2 N NaOH/0.2% SDS and analyzed for total cellular protein. The data are ex-pressed as pmol·mg1 protein·min1 and presented
as the averages of at least four assays.
Statistical Analyses
For both animal and tissue culture studies, two-tailed paired Student’s t-test was used to deter-mine the statistical significance. A P value ≤ 0.05 was considered significant. Results are given as the
means ± standard error of the mean (SEM). The placental mRNA from first generation as well as the densitometric analysis of immunoblot bands from both generations were compared between LPD and the NPD group. F2 placental mRNA content was compared according to F1 parental lineage such that the offspring of F1 female ani-mals were compared to the offspring of random control females. Similarly, offspring of F1 male animals were compared to offspring of random control males. Likewise, using two-tailed Student’s t-test, mRNA, and Na+ dependent MeAIB trans-port were compared after transient transfection of HEK 293 cells with SNAT2-containg vs. respective base (empty vector).
Results
Placental SysA
mRNA Expression
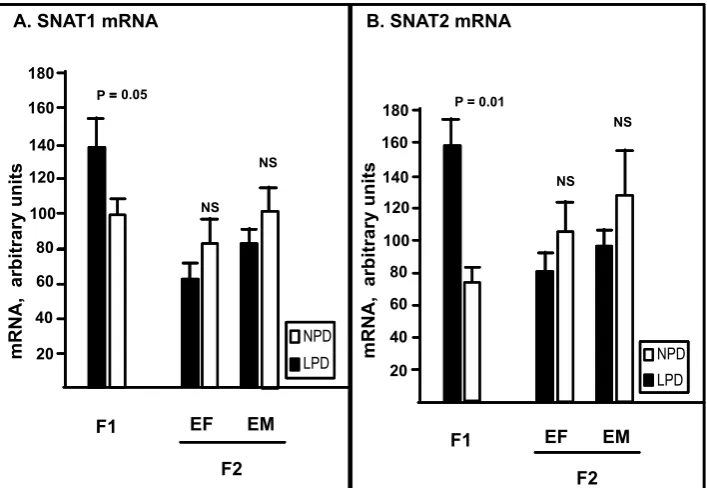
As noted in Figure 1A, in F1 placentas, ex-pressed in arbitrary mRNA units, the steady-state
Fig. 1. Placental SysA isoform specific mRNA content determined by real time RT-PCR. Panel A depicts steady-state
mRNA content of SNAT1 and panel B for SNAT2 isoform (y-axis). Respective gestations are shown on x-axis as labeled. In F1 placentas, mRNA content of both isoforms were significantly higher from LPD group (solid black bars, N = 22) than the NPD group (empty bars, N = 22). As detailed in Method’s section, a reversed but non-significant trend is noted in F2 generation-placentas from both maternal and paternal-GPR descent. EM – experimental male; EF – experimental female
Ryc. 1. Zawartość swoistej izoformy mRNA w łożysku oceniona w czasie rzeczywistym za pomocą RT-PCR: Panel
A przedstawia zawartość SNAT1 mRNA w stanie równowagi, a panel B izoformę SNAT2 (oś y). Odpowiednie ciąże są zaznaczone na osi x zgodnie z etykietami. W łożyskach F1 zawartość obu izoform w mRNA była istotnie większa w grupie LPD (czarne słupki, N = 22) niż w grupie NPD (puste słupki, N = 22). Jak przedstawiono w rozdziale Metody, odwrotną, ale nieistotną tendencję odnotowano w łożyskach z pokolenia F2 pochodzących od matki i ojca z GPR. EM – doświadczalny samiec; EF – doświadczalna samica
F1 EF EM
F2
NPD LPD
mRNA, arbitrary unit
s
P = 0.05
NS NS
40 60 80 100 120 140 160
20 180
F1 EF EM
F2
NPD LPD
mRNA, arbitrary unit
s
NS NS
A. SNAT1 mRNA B. SNAT2 mRNA
40 60 80 100 120 140 160
20 180
NPD LPD NPD LPD =
mRNA content of SNAT1 was higher in LPD than NPD group (140 ± 13 vs. 99 ± 11; p ≤ 0.01, N = 22). A non-significant decrease in mRNA expression of SNAT1 is seen in second generation placentas of animals from LPD decent (both genders, Figure 1A). For example, steady-state mRNA contents of SNAT1 in F2 generation placentas from maternal GPR-background (EF) was relatively lower in LPD than NPD group (61 ± 12, n = 10 vs. 82 ± 11; p = 0.2, n = 9). Similar but more pronounced depression of SNAT1 mRNA content (nearly reaching statis-tical significance) is noted in F2 placentas of pa-ternal (EM) descent (81 ± 6, n = 10 vs.104 ± 12; p = 0.052, n = 9). As noted in Figure 1B, the results for SNAT2 mRNA for both-generation-placentas closely resemble the results seen for SNAT1. For example, in F1 placentas SNT2 mRNA was high-er in LPD than NPD group (81 ± 6, n = 10 vs.
104 ± 9; p ≤ 0.001, n = 12). Similarly, SNAT2 mRNA content in F2 placentas from EF origin (83 ± 10, n = 10 vs.102 ± 16; p = 0.31, n = 9) as well as from paternal (EM) descent (99 ± 8, n = 10 vs. 130 ± 11; p = 0.20, n = 9) were depressed as com-pared to the control group, although the difference was not statistically different.
Placental SysA Protein
Expression
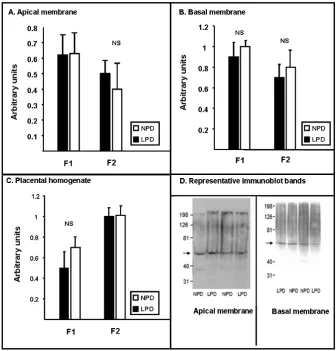
Although SNAT1 mRNA was up-regulated in F1 placentas, densitometric analysis of im-munoblot bands (depicted in Fig. 2) revealed no significant difference in the expression of SNAT1-protein on AM (0.62 ± 0.13 vs. 0.63 ± 0.13 arbi-trary units; p = 0.9, n = 6) between LPD and NPD membrane preparations. Similar results were seen
Fig. 2. Placental SNAT1 protein expression. Shown are the quantitative assessment of immunoblot bands determined
by densitometry analysis from apical membranes (A), basal membranes (B), and placental homogenates (C). In panel D, a representative immunoblot from F1 apical membrane (left panel) and F2 basal membrane (right panel) are shown. As noted SNAT1 expression was comparable between LPD (solid black bars) and NPD group (empty bars) in both generation placental-membranes and placental-homogenates
Ryc. 2. SNAT1 w łożysku. Ilościowa ocena prążków immunoblot ustalona na podstawie analizy densytometrycznej
for BM-preparations (0.9 ± 0.14 vs. 1 ± 0.06 arbi-trary units; p = 0.6, n = 4) and placental homog-enate preparations (0.5 ± 0.16 vs. 0.7 ± 0.1 arbi-trary units; p = 0.3, n = 4). Furthermore, analysis of immunoblot bands from F2 placentas were also comparable for SNAT1-expression between LPD and NPD placental-AM-preparations (0.5 ± 0.08, n = 6 vs. 0.4 ± 0.16 arbitrary units; p = 0.6, n = 3); BM-preparations (0.7 ± 0.12, n = 4 vs. 0.8 ± 0.16 arbitrary units; p = 0.8, n = 3); and placental-homogenate-preparations (1 ± 0.08 vs. 1.1 ± 0.09 arbitrary units; p = 0.5, n = 8). SNAT2 immunob-lotting was not performed because of a lack of suit-able antibody when these studies were performed.
SNAT2-over-expression
by Transient Transfection
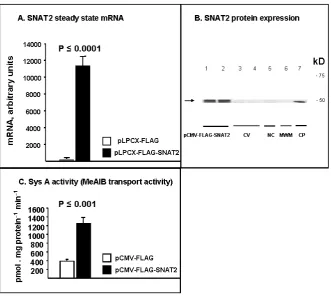
As shown in Fig. 3, transient transfection of HEK 293 cells with pLPCX-FLAG-SNAT2 con-struct resulted in more than 100-fold induction of SNAT2 mRNA over control (11227 ± 1126 vs. 81 ± 11; p ≤ 0.0001, n = 4). A commensurate SNAT2 protein over-expression is noted by strong bands detected by anti-FLAG antibodies at the site of detection of control protein (CP, Fig. 3C). Simi-larly, in line with SNAT2 mRNA and protein over-expression, Na+ dependent MeAIB (specific SysA substrate) transport was significantly enhanced by
Fig. 3. SysA functional up-regulation by SNAT2-over-expression by transient transfection. Separate experiments were
performed for mRNA by q-PCR, western analysis and transport studies. Typically HEK 293 cells grown to 50% con-fluence when transfection was carried out using either pLPCX-FLAG-SNAT2 or p-CMV-FLAG-SNAT2 (as shown). After 36 hours total RNA and proteins were isolated or transport studies performed. Panel A depicts significant induction of SNAT2 steady-state mRNA with transfection of the vector construct containing SNAT2 whole length coding sequence (solid black bar) vs. base FLAG vector without SNAT2 component. Panel B shows over-expression of SNAT2 protein depicted by anti-FLAG antibodies. Panel C highlights significant higher MeAIB (specific SysA sub-strate) transport in cells treated with vector construct containing SNAT2 whole length coding sequence (solid black bar) vs. base FLAG vector without SNAT2 component
Ryc. 3. Czynnościowa nadmierna aktywacja SysA przez nadekspresję SNAT2 przez przejściową transfekcję.
Przeprowadzono oddzielne badania dla mRNA za pomocą q-PCR, techniki western blot i badań transportu.
transfection with SNAT2-containing vs. control vector 1243 ±137 vs. 390 ± 27 pmole .1mg .1 min;
p ≤ 0.0008, n = 4). Collectively, these results sug-gest that in biological systems, without any feed-back modulation, transcriptional over-expression of SNAT-isoforms increase protein and functional activity of SysA.
Discussion
In this work, we sought to determine the mo-lecular mechanisms of down-regulation of placen-tal SysA activity in the setting of GPR. We docu-ment the following interesting observations: 1) GPR-induced SysA repression is associated with up-regulation of SNAT1 and SNAT2 mRNA in F1 placentas. 2) Despite the transcriptional up-regulation, the protein contents of SNAT1 in api-cal and basal membranes were not over-expressed. 3) Transient transfection of highly transfectable HEK-293 cells with SNAT2-containing vector resulted in more than 100-fold-up-regulation of SNAT2 mRNA; SNAT2 protein over-expression, and a commensurate enhancement in SysA trans-port activity. 4) When next-generation maternal nutritional protein intake is optimized placental-SysA-activity is normalized.
The rat is commonly utilized to study mater-nal-fetal effects of GPR and is well known to pro-duce abnormal fetal growth. Although the precise patterns of fetal involvement depend upon the timing, severity and the duration of GPR, the most commonly affected systems include cardiovascu-lar, renal and endocrine systems [17]. Placental amino acid transport and its regulation, particu-larly in the setting of GPR is an important deter-minant of the fetal nutritional environment. In this regard, SysA bears special significance, because, it transports a wide range of amino acids (including alanine, asparagine, cysteine, glutamine, glycine, methionine, and serine) and its function is exten-sively regulated through hormonal inputs [18, 19]. Over the years, we and others have consistently documented that in the pregnant rat dams, di-etary protein restriction reduces the transfer of
14C-labeled MeAIB, a specific substrate of SysA,
from the maternal blood into the fetus. As such a consensus has emerged that placental SysA activ-ity is down-regulated in the setting of GPR [11]. The work presented here is the first step address-ing the mechanisms of this repression. We report that contrary to SysA repression, SNAT1 protein contents of placental homogenates as well as both apical and basal membranes are comparable be-tween LPD and NPD group (Fig. 2). Conversely, the transcriptional activities of placental SNAT1
and SNAT2, two of the most important SysA iso-forms are up-regulated (Fig. 1). Further work will be needed to decipher the molecular basis of this dichotomy. Possible mechanisms include regula-tion of post-transcripregula-tional mRNA processing, nuclear export, stability andtranslation of ma-ture mRNAs, and altered quantity or interaction of cytoplasmic mRNA-binding proteins. It is im-portant to realize that although a feedback post-transcriptional-control of SysA proteins is logical and is supported by our work involving tissue cul-ture studies (Fig. 3), an explanation purely based on feed-back-inhibition of transcription appears too simplistic: because, the exchange of amino ac-ids from the mother to the fetus involves not only placental uptake and excretion by transport sys-tems (such as SysA), but also an extensive amino acid metabolism within the placenta. Similarly, in growth-restricted pregnancies such as those due to GPR, substantial alterations in the maternal neu-roendocrine milieu are known to occur which can modulate maternal-fetal transfer of nutrients [20]. When viewed from this (limited) perspective, our finding of increased SNAT1 and SNAT2 mRNA may indicate an attempt by the syncytiotrophoblast to enhance the uptake of SysA substrates in the face of maternal substrate deprivation, a phenomenon well known cell culture models [21]. Again, given the complexity of maternal-placental-fetal interac-tions, extrapolations from culture models are not adequate to explain these observations.
pathways will facilitate the understanding of the mechanism(s) by which the supply of SysA sub-strates (small neutral amino acids) affect the ac-tions of growth/trophic factors at the translational level under conditions such as gestational protein restriction. Our ongoing work is focused at inves-tigation of the maternal and fetal hormonal fac-tors involved in SysA post-transcriptional regu-lation in GPR-pregnancies. Important questions
emerging from this work include: 1) what are the cellular targets of post-transcriptional regulation of SysA proteins in the setting of GPR; what are the maternal and fetal adaptations linked to post-transcriptional regulation of SysA proteins; and can the placental, fetal and maternal adaptations predict the latter evolution of MetS-prone pheno-type. These questions are the focus of our ongoing investigations.
Acknowledgements. Authors thank Helene Varoqui and Jeffrey D. Erickson of Louisiana State University Health
Science Center, New Orleans, LA., for providing antibody against SNAT1.
References
[1] Keijzer-Veen MG, Finken MJ, Nauta J, Dekker FW, Hille ET, Frolich M, et al.: Is blood pressure increased
19 years after intrauterine growth restriction and preterm birth? A prospective follow-up study in The Netherlands. Pediatrics 2005,116(3), 725–731.
[2] Hofman PL, Cutfield WS, Robinson EM, Bergman RN, Menon RK, Sperling MA et al.: Insulin resistance in short children with intrauterine growth retardation. J Clin Endocrinol Metab 1997 Feb, 82(2), 402–406.
[3] Stocker CJ, Arch JR, Cawthorne MA: Fetal origins of insulin resistance and obesity. Proc Nutr Soc 2005, 64(2), 143–151.
[4] Barker DJ: The fetal and infant origins of disease. Eur J Clin Invest 1995 Jul, 25(7), 457–463.
[5] Meigs JB, Wilson PW, Nathan DM, D’Agostino RB, Sr., Williams K, Haffner SM: Prevalence and characteris-tics of the metabolic syndrome in the San Antonio Heart and Framingham Offspring Studies. Diabetes 2003 Aug, 52(8), 2160–2167.
[6] Wilson PW, Grundy SM: The metabolic syndrome: practical guide to origins and treatment: Part I. Circulation 2003, 23, 108 (12), 1422–1424.
[7] Balkau B, Charles MA, Drivsholm T, Borch-Johnsen K, Wareham N, Yudkin JS et al.: Frequency of the WHO metabolic syndrome in European cohorts, and an alternative definition of an insulin resistance syndrome. Diabetes Metab 2002, 28(5), 364–376.
[8] Kim HL, Picciano MF, O’Brien W: Influence of maternal dietary protein and fat levels on fetal growth in mice. Growth 1981, 45(1), 8–18.
[9] Hales CN, Ozanne SE: For Debate: Fetal and early postnatal growth restriction lead to diabetes, the metabolic syndrome and renal failure. Diabetologia 2003, 46(7), 1013–1019.
[10] Desai M, Hales CN: Role of fetal and infant growth in programming metabolism in later life. Biol Rev Camb Philos
Soc 1997, 72(2), 329–348.
[11] Haafiz A, Bernstein HM, Beveridge M, Novak DA: Both Genders Can Propagate Obesity-Prone-Phenotype
Impacting Placental Amino Acid Transport System A Activity in a Rat Model of Gestational Protein Restriction. Adv Clin Exp Med 2010, 19(3), 301–312.
[12] Malandro MS, Beveridge MJ, Kilberg MS: Effect of a low-protein diet induced intrauterine growth retardation in
rat placental amino acid transport. Am J Physiol 1996, 271, C295–C303.
[13] Novak DA, Beveridge MJ, Malandro M, Seo J: Ontogeny of amino acid transport system A in rat placenta.
Placenta 1996, 17, 643–651.
[14] Malandro MS, Beveridge MJ, Kilberg MS, Novak DA: Effect of low-protein diet-induced intrauterine growth
retardation on rat placental amino acid transport. Am J Physiol Cell Physiol 1996, 1, 271(1), C295–C303.
[15] Malandro MS, Beveridge MJ, Kilberg MS, Novak DA: Ontogeny of cationic amino acid transport in rat placenta.
Am J Physiol 1994, 266, C804–C811.
[16] Varoqui H, Zhu H, Yao D, Ming H, Erickson JD: Cloning and functional identification of a neuronal glutamine
transporter. J Biol Chem 2000 Feb 11, 275(6), 4049–4054.
[17] Gluckman PD, Hanson MA: The developmental origins of the metabolic syndrome. Trends Endocrinol Metab
2004 May, 15(4), 183–187.
[18] Kilberg MS, Barber EF, Handlogten ME: Characteristics and hormonal regulation of amino acid transport system
A in isolated rat hepatocytes. Topics in Cell Regulation 1985, 25, 133–63.
[19] Kilberg MS, Haussinger D: Mammalian Amino Acid Transporter: Mechanisms and Control. New York: Plenum
Press; 1992.
[20] Cetin I: Placental transport of amino acids in normal and growth-restricted pregnancies. European J Obstet
Gynecol Reprod Biol 2003 Sep 22, 110, Suppl. 1, S50–S54.
[21] Kilberg MS, Han HP, Barber EF, Chiles TC: Adaptive regulation of neutral amino acid transport system A in rat
H4 hepatoma cells. J Cell Physiol 1985, 122, 290–298.
[22] Palii SS, Thiaville MM, Pan YX, Zhong C, Kilberg MS: Characterization of the amino acid response element
[23] Bolster DR, Vary TC, Kimball SR, Jefferson LS: Leucine regulates translation initiation in rat skeletal muscle via
enhanced eIF4G phosphorylation. J Nutr 2004, 134(7), 1704–1710.
[24] Kimball SR, Antonetti DA, Brawley RM, Jefferson LS: Mechanism of inhibition of peptide chain initiation by
amino acid deprivation in perfused rat liver. J Biol Chem 1991, 266, 1969–1976.
[25] Kimball SR: Regulation of global and specific mRNA translation by amino acids. J Nutr 2002,132 (5), 883–886. [26] Kimball SR, Jefferson LS: Role of amino acids in the translational control of protein synthesis in mammals. Semin
Cell Dev Biol 2005 Feb, 16, 21–27.
[27] Kimball SR, Jefferson LS: Molecular mechanisms through which amino acids mediate signaling through the
mammalian target of rapamycin. Curr Opin Clin Nutr Metab Care 2004, 7(1), 39–44.
[28] Kimball SR, Jefferson LS: Molecular mechanisms through which amino acids mediate signaling through the
mammalian target of rapamycin. Curr Opin Clin Nutr Metab Care 2004, 7(1), 39–44.
[29] Pham PT, Heydrick SJ, Fox HL, Kimball SR, Jefferson LS, Jr., Lynch CJ: Assessment of cell-signaling pathways
in the regulation of mammalian target of rapamycin (mTOR) by amino acids in rat adipocytes. J Cell Biochem 2000, 7, 79(3), 427–441.
Address for correspondence:
Donald Novak Box 100296
Department of Pediatrics
University of Florida College of Medicine Gainesville, FL 32610-0296
Tel.: 352 392 64 10
E-mail: [email protected]
Conflict of interest: None declared