Turkish Journal of Fisheries and Aquatic Sciences 17: 451-459 (2017)
www.trjfas.org ISSN 1303-2712 DOI: 10.4194/1303-2712-v17_3_01
RESEARCH PAPER
© Published by Central Fisheries Research Institute (CFRI) Trabzon, Turkey in cooperation w ith Japan International Cooperation Agency (JICA), Japan
Fatty Acid Composition of Gilthead Sea Bream (
Sparus aurata
) Fillets as
Affected by Current Changes in Aquafeed Formulation
Introduction
The steady decline in catch of wild fish used in the fish mea l (FM) and fish oil (FO) industry and the rise of aquaculture, which is the larger user of FM and FO, are c reating a lack o f availability of these two raw materia ls and the gradual increase of their price. In 2012, 16.3 million tons of wild fish were used in the production of FM and FO (FAO, 2014); this a mount re mains static and its increase is not e xpected. In the same year, aquaculture consumed about 68% of global production of FM and 74% of FO (Tacon & Metian, 2015). The g lobal aquafeed production shows a continuously increasing trend; in 2025, aquaculture will consume 87.1 million tons of feed (Tacon & Metian, 2015) and naturally, the FM and FO content of feed are going to decrease.
FM and FO are the basic co mponent of fish feed, in particula r for carn ivorous species like salmonids and marine fish. The raw materia ls cost covers the 75% of total cost of aquafeeds for the salmon feed production (Rana, Siriwardena & Hasan, 2009), and in general the cost of aquafeed accounts for more than 50% of the e xpenses for a fish farmer. FM price reached its ma ximu m value of 2,388$/ton in Dece mber 2014 and this continuous rise leads the use
of cheaper feed ingredients, such as plant products, which would allow the aquafeed industry to maintain the feed price low and stable. Further, sustainability of aquaculture is beco ming a de manded prio rity for consumers and public opinion, and the overexp loitation of ocean resources is one of the critica l point of the thorny debate (Byelashov & Griffin, 2014).
The aquafeed industry is ma king efforts to reduce the dietary inclusion of marine derivate ingredients, searching alternative dietary proteins and lip id sources and formu lating more e fficient eco -friendly feeds. Widely cultivated terrestrial plant, like soya, corn, wheat and sunflower, provide protein mea ls and oils that have been largely introduced in fish diet fo rmulat ion (Glencross, Booth & Allan, 2007; Sa les, 2009; Tu rchini & Torstensen, 2009). Processed anima l protein (PAP), obtained fro m the rendering industry, are another notable alternative protein sources, and their recent re-admission in aquafeeds (REG CE 56/ 2013), after the bans caused by the transmissible spongiform encephalopathies crisis, could represent an important resource for the European aquafeed industry. Several other protein and oil sources have been studied and proposed by several authors for replac ing FM and FO, like algae
Mauro Vasconi
1,*, Fabio Caprino
1, Federica Bellagamba
1, Vittorio Maria Moretti
11
The University of M ilan, Department of Health, Animal Science and Food Safety Via Trentacoste 2, 20134 M ilano, Italy.
* Corresponding Author: Tel.:+39.025 0315759 ; Fax: +39.025 0315746; E-mail: [email protected]
Received 10 February 2016 Accepted 08 November 2016
Abstract
The aquafeed industry is facing the lack of availability of fish meal and oil. The need of an economic and environmental sustainability has increased the use of plant -derived oils. In order to provide an overview of which ingredients are the most frequently used in GSB diet and as they affect the lipid composition of aquafeeds , we analyzed 26 feed samples collected from farmers. At the same time, 44 farmed GSB were analyzed to compare the fatty acid (FA) composition with 21 wild GSB and 46 GSB farmed in 2005. Twenty -four different ingredients were declared in the analyzed feeds. Fish meal and oil were present in all samples, even if they were not the principal protein and lipid source in the analyzed feeds. If we consider the FA n-3/n-6 ratio, feeds presented a range from the lowest value of 0.35, to the maximum of 2.26. Concern ing fish FA, 2014-farmed GSB presented an increased difference with wild GSB, if compared with those reared in 2005, due to the higher presence of oleic and linoleic acid. Our study confirms the increase of use of plant ingredients in aquafeeds and the decrease of the fish meal and oil inclusion in feeds.
452
(He ma iswarya, Ra ja, Ravi Ku mar, Ganesan, & Anbazhagan, 2011; Chauton, Reitana, Norske r, Tveterås & Kleivdal, 2015) or insects’ meal (Hanry, Gasco, Piccolo & Fountoulaki, 2015). Nevertheless, the high price and the scarce availability of some of these new ingredients have limited their use in commercial feeds.
Gilthead sea brea m (Sparus aurata) (GSB) is one of the most important farmed species in the Mediterranean area. Its production has a positive trend, and reached a volu me of 173000 t in 2013. It is ma inly reared in the Mediterranean, with Greece being the largest producer, followed by Turkey and Spain (FAO FishStat, 2015). As a consequence of the progressive increase of GSB production, farme rs had to face a decline in sale price and a diminution in profitability. The only way that GSB fa rmers have to ma intain a profit marg in is to reduce the cost of feeding, with diets that include cheaper ingredients (Martine z-Llorens, To mas-Vida l & Jover Cerda, 2012). Plant oils are rich in 18-carbon (18:2n -6 and 18:3n-3) polyunsaturated fatty acid (PUFA) but are deficient in n-3 long chain PUFA (LC-PUFA) (Sargent, Tocher & Bell, 2002). The substitution of FO with plant oils, causes alteration of muscle fatty acid profile of GSB, reducing the a mount of n -3 LC-PUFA and consequently their nutritional value, since fish is the principa l source of these fatty acids, recognized as fundamental for hu man health (Grigora kis, 2007). In addition, long periods of
feeding soybean oil may result into
immunosuppression in seabream (Montero et al., 2003). Italian GSB farmers report an increase of disease incidents in their fish and diet rich in vegetable oils is considered a possible cause of these phenomena.
The aim of present study was to determine the e xtent and type of ingredients that are used at present in co mmerc ia l feeds for GSB and their fatty acid composition. Furthermo re, two fatty acid datasets of a total of 90 fillet samples fro m farmed ma rket-sized GSB during the last decade were used to discuss the consequences of the substitution of FM and FO with alternative ingredients on the lipid and FA composition of GSB fillets.
Material and Methods
Standards and Reagents
Analytical grade reagents and chemica ls were purchased from Sig ma-A ldrich (Milan, Italy ). De mineralized water was obtained from an Elga purification system (Veolia Water Solutions and Technologies, Italy). Standards of individual fatty acids were purchased fro m Sig ma -Aldrich (Milan, Italy). Stock solutions of standard compounds were prepared in hexane at a concentration of 10 mg ml-1 and stored at -20°C. Further standard dilutions were prepared in he xane indiv idually or in mixtures to
reduce the concentration to 0.2-1 mg ml-1 before GC analysis. A 37 Fatty acids methyl esters (FAME) mixtu re in dic loro methane and standard Menhaden fish oil we re obtained from Supelco (Supelco, Be lla fonte, PA, USA) and were used as reference standard.
Feed and Fish Sampling
Two sa mpling ca mpa igns of GS B we re organized on Italian ma rket, through distributors, retaile rs and fish markets during the winter season. The first sampling was done during 2005, in which 46 farmed fish of co mme rcia l size (400-600 g) and 19 wild fish were sa mpled. Fa rmed fish were obtained fro m Greece (18), Italy (15), Croatia (10) and Turkey (3), according to their labels.
The second campaign was organized in 2014. Forty-four samp les of farmed GSB of the same size were purchased: Fish were fa rmed in Italy (18), Greece (14), Turkey (6), Croatia (3) and Malta (3). In addition, other 2 wild GSB ware collected.
During the same period (2014) t wenty-six aquafeed samples were collected directly fro m GSB farme rs on Italian territory. Our sa mpling strategy was focused on grow-out diets used at that mo ment by farme r, as these are the diets used for the greatest proportion of time under culture.
Lipid Extraction and Fatty Acids Analysis
The ext raction and determination of total lip ids was performed according to the Folch (1957) method with ch loroform:methanol (2:1), using 500 mg of feed and 1.5 g of GSB muscle collected fro m dorsal, ventral and caudal regions of fillets. The preparation of fatty acid methyl esters was performed accord ing to Christie (2003). Briefly, the lipid samp le (20 mg ) was dissolved 10% methanolic hydrogen chloride (2 ml). A 1 ml solution of tricosanoic acid (1 mg ml−1) in toluene was added as internal standard. The sa mple was sealed and heated at 50°C overnight; then, 2 ml of a 1 M potassium carbonate solution and 5 ml of 5% NaCl were added to each sample. The FAM Es were extracted with 2×2 ml of hexane and the mixture was evaporated under nitrogen. The sample was dissolved in 1 ml he xane and 1 µl sa mple was injected into the gas-chromatograph, in split mode (split rat io 1:100). Fatty acid analysis was carried out on an Agilent gas -chromatograph (Model 6890 Se ries GC) fitted with an automatic sa mpler (Model 7683) and FID detector. The carrie r gas was helium with a flow rate of 1.0 ml min-1 and an inlet pressure of 16.9 psi. A HP-Innowa x fused silica cap illary co lu mn (30 m×0.25 mm I.D., 0.25 µm film thickness; Agilent Technologies) was used to separate fatty acid methyl esters. The oven temperature progra m for separation was fro m 100 to 180°C at 3°C min-1, then from 180 to 250°C at 2.5°C
453
identified re lative to known e xterna l standards and were expressed as percentage of total fatty acids.
Statistical Analysis
Norma l distribution and homogeneity of variance was confirmed and comparison between means was performed by analysis of variance. The Student Newman Keu ls was used as post hoc test for comparison of the means a mong d iffe rent GSB origins. Significance was accepted at probabilit ies of 0.05 or less.
Principal co mponent analysis was performed using fatty acid profiles in order to co mpare diffe rent samples and to detect the most important fatty acids affecting the distribution of GSB sa mples. All the statistical analysis we re performed by SPSS version 22.0 (SPSS Inc. Ch icago, Illinois) and The Unscrambler version 10.0 (Camo, Norway).
Results
Feed samp les collected in 2014 originated fro m four diffe rent manufacturers, a mong the major
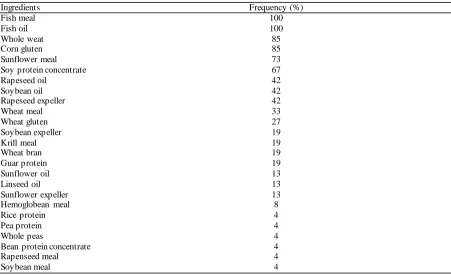
companies in the aquafeed ma rket of the Mediterranean basin. Feed e xt rude dia meter were between 3-6 mm. The pro ximate co mposition (Table 1) of the 26 feeds, as declared in label, showed a common pattern with minor variations. Feed used in the grow-out phase of farming was rich in protein (43%) and fat (20%). These values match to the actual grow out GSB nutritional require ment (Koven, 2002). Feed ingredients used in feed preparation a re reported in Table 2. According to the Reg CE 767/2009 feed’s ingredients were listed in labe l in descending order by weight ca lculated on the moisture contents of the feed compound. Twenty-five different ingredients were found in GSB feeds. So me of the m we re obtained fro m the same ra w materia l; for instance, soybean was present as protein concentrate, expeller, mea l and oil. Fish mea l was used in all the feeds, but it was not the ma in protein source of a ll GSB d iets, being the main protein source in only 4 out of the 26 feeds. Krill mea l, the other marine mea l found in feed samples, was reported in 5 feeds. Corn gluten, soybean and sunflower protein mea l or e xpe ller are the most common plant protein source found in GSB feed, while rapeseed, pea, bean, guar and rice were present
Table 1. Proximate composition (g /100 g) of the 26 gilthead sea bream feed as reported in label (mean ± St Dev)
Protein 42.9 ±2.49
Lipid 19.7 ±1.75
Fiber 2.8 ±0.66
Ash 6.2 ±1.03
Table 2. Raw material used in gilthead sea breams feed a their relative frequency
Ingredients Frequency (%)
Fish meal 100
Fish oil 100
Whole weat 85
Corn gluten 85
Sunflower meal 73
Soy protein concentrate 67
Rapeseed oil 42
Soybean oil 42
Rapeseed expeller 42
Wheat meal 33
Wheat gluten 27
Soybean expeller 19
Krill meal 19
Wheat bran 19
Guar protein 19
Sunflower oil 13
Linseed oil 13
Sunflower expeller 13
Hemoglobean meal 8
Rice protein 4
Pea protein 4
Whole peas 4
Bean protein concentrate 4
Rapenseed meal 4
454
in only few sa mples. Fish oil was the first pure lipid ingredient in most of the samp les and it was present in all the feed sa mples. We have no direct evidence about the fish species utilized as raw materials to produce the fish oil used in our study. Rapeseed and soybean were the plant oils present in higher proportions, followed by linseed and sunflower o ils. Other ingredients, like e xpellers, can possible also contribute with considerable a mount of lipid in feed. The dietary starch was provided main ly as wheat, which was present, in different form, in all feeds.
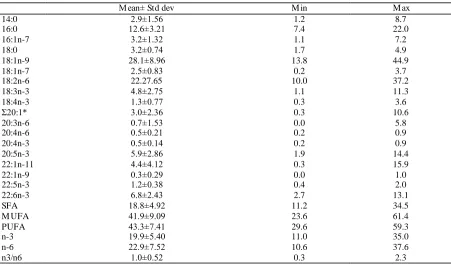
The fatty acid co mposition of feeds is shown in Table 3. Saturated fatty acid (SFA) we re the fatty acids present in smalle r a mounts, with the exception of one feed where they were in ba lance with monounsaturated fatty acid (MUFA). Palmit ic acid (PA 16:0) was the most representative SFA in all samples. A mong MUFAs , wh ich were dominant in half of the feeds, oleic acid (OA 18:1 n-9) was the fatty acid with the h ighest relative concentration in 18 of the 26 samp les; rema ining feeds presented linoleic acid (LA 18:2 n-6) as dominant fatty acid. Long chain monounsaturated fatty acids, like gadoleic (GA 20:1 n-11) and cetoleic (CA 22:1 n-11) ac ids, were more abundant in five feeds. The α linolenic acid (A LA 18:3 n -3) was more abundant in three feeds, that were the ones which contain linseed oil in their formulat ion. PUFA were dominant in half of feeds. Among PUFA, eicosapentaenoic acid (EPA, 20:5 n-3) and docosahexaenoic ac id (DHA, 22:6 n -3) were particularly present in four feeds, characterized a lso by having the highest n3/n6 ratio, reaching the
maximu m value of 2.26.
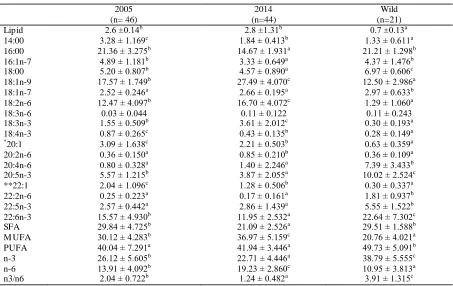
Table 4 shows the results of lipid content and fatty acid analys is of GSB fillets. Fa rmed GSB were fatter than wild fish, whilst no significant difference was found between 2005 and 2014 farmed fish. Wild fish did not show any statistical difference between 2005 and 2014 and they were me rged in a one group. They were characterized by a higher content of PUFA, followed by SFA and MUFA. DHA was the dominant fatty ac id, followed by PA and OA. LA was present by only in limited a mounts; 20 - 22 C M UFAs were present only in traces. The n-3/n-6 FA ratio resulted 3.91, due to the high a mount of n-3 and the poor presence of n-6. The most representative n-6 FA was arachidonic acid (ARA, 20:4 n-6).
Fillets FA composition of GSB fa rmed in 2014 diffe red statistically fro m that of 2005 fish. There was an increase of MUFA, ma inly due to the raise of OA (fro m 17.6 % in 2005 to 27.5% in 2014). The increase of MUFA was counterbalanced by the decrease of SFA. A mong MUFA, 20:1 and 22:1 FA showed a decrease from 2005 to 2014. Total PUFA we re similar between the two groups, but their composition varied among years. In fact, in 2005 there was a predominance of LC-PUFA such as DHA, EPA and ARA, while in 2014 the ma in PUFA were LA and ALA. n-3/n-6 ratio decreased fro m the value of 2.04 in 2005 to the value 1.24 of GSB fa rmed in 2014. This difference was due ma inly to the decrease of EPA and DHA, only part ially co mpensated by the increase of ALA, and to the simu ltaneous increase of LA from 12.5% to 16.7%.
Table 3. Fatty acid composition (percentage of total fatty acid) of 26 gilthead sea bream feeds (mean ± St Dev)
Mean± Std dev M in M ax
14:0 2.9±1.56 1.2 8.7
16:0 12.6±3.21 7.4 22.0
16:1n-7 3.2±1.32 1.1 7.2
18:0 3.2±0.74 1.7 4.9
18:1n-9 28.1±8.96 13.8 44.9
18:1n-7 2.5±0.83 0.2 3.7
18:2n-6 22.27.65 10.0 37.2
18:3n-3 4.8±2.75 1.1 11.3
18:4n-3 1.3±0.77 0.3 3.6
Σ20:1* 3.0±2.36 0.3 10.6
20:3n-6 0.7±1.53 0.0 5.8
20:4n-6 0.5±0.21 0.2 0.9
20:4n-3 0.5±0.14 0.2 0.9
20:5n-3 5.9±2.86 1.9 14.4
22:1n-11 4.4±4.12 0.3 15.9
22:1n-9 0.3±0.29 0.0 1.0
22:5n-3 1.2±0.38 0.4 2.0
22:6n-3 6.8±2.43 2.7 13.1
SFA 18.8±4.92 11.2 34.5
M UFA 41.9±9.09 23.6 61.4
PUFA 43.3±7.41 29.6 59.3
n-3 19.9±5.40 11.0 35.0
n-6 22.9±7.52 10.6 37.6
n3/n6 1.0±0.52 0.3 2.3
455
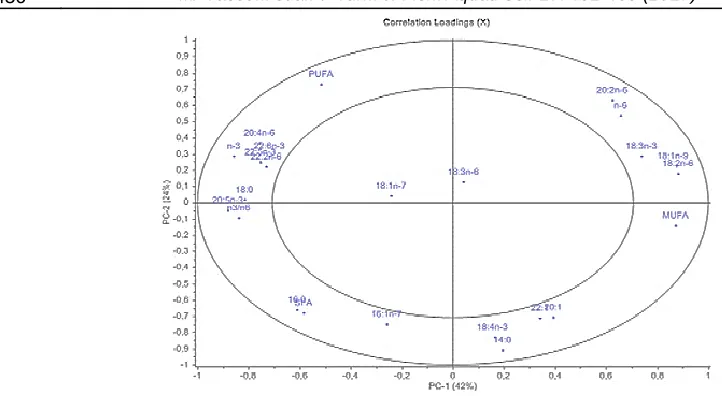
The FA profile o f wild, farmed in 2005 and 2014 GSB has been submitted to princ ipal co mponent analysis (PCA) wh ich is presented in Figure 1 and 2. PCA was performed using 24 fatty acid variables. PCA e xp lained the 66% of the variance with PC1 accounting for 42% and PC2 for 24% of the total variance. GSB appeared well separated according
their d iet/year. Wild GSB, sa mpled in 2005 and 2014, were grouped in the upper-left part of graph (Figure 1), being characterized ma inly by A RA, PUFA, and n-3 PUFA. GSB farmed during 2014 were a lso well diffe rentiated and grouped in a s ma ll part o f graph, the area where M UFA, OA, LA and A LA are abundant. GSB farmed in 2005 occupy an
Table 4.Lipid content (g/100g) and fatty acid composition (percentage of total fat ty acid) of gilthead sea bream muscle. Data are expressed as mean ± standard deviation.
2005 2014 Wild
(n= 46) (n=44) (n=21)
Lipid 2.6 ±0.14b 2.8 ±1.31b 0.7 ±0.13a
14:00 3.28 ± 1.169c 1.84 ± 0.413b 1.33 ± 0.611a
16:00 21.36 ± 3.275b 14.67 ± 1.931a 21.21 ± 1.298b
16:1n-7 4.89 ± 1.181b 3.33 ± 0.649a 4.37 ± 1.476b
18:00 5.20 ± 0.807b 4.57 ± 0.890a 6.97 ± 0.606c
18:1n-9 17.57 ± 1.749b 27.49 ± 4.070c 12.50 ± 2.986a
18:1n-7 2.52 ± 0.246a 2.66 ± 0.195a 2.97 ± 0.633b
18:2n-6 12.47 ± 4.097b 16.70 ± 4.072c 1.29 ± 1.060a
18:3n-6 0.03 ± 0.044 0.11 ± 0.122 0.11 ± 0.243
18:3n-3 1.55 ± 0.509b 3.61 ± 2.012c 0.30 ± 0.193a
18:4n-3 0.87 ± 0.265c 0.43 ± 0.135b 0.28 ± 0.149a
*20:1 3.09 ± 1.638c 2.21 ± 0.503b 0.63 ± 0.359a
20:2n-6 0.36 ± 0.150a 0.85 ± 0.210b 0.36 ± 0.109a
20:4n-6 0.80 ± 0.328a 1.40 ± 2.246a 7.39 ± 3.433b
20:5n-3 5.57 ± 1.215b 3.87 ± 2.055a 10.02 ± 2.524c
**22:1 2.04 ± 1.096c 1.28 ± 0.506b 0.30 ± 0.337a
22:2n-6 0.25 ± 0.223a 0.17 ± 0.161a 1.81 ± 0.937b
22:5n-3 2.57 ± 0.442a 2.86 ± 1.439a 5.55 ± 1.522b
22:6n-3 15.57 ± 4.930b 11.95 ± 2.532a 22.64 ± 7.302c
SFA 29.84 ± 4.725b 21.09 ± 2.526a 29.51 ± 1.588b
M UFA 30.12 ± 4.283b 36.97 ± 5.159c 20.76 ± 4.021a
PUFA 40.04 ± 7.291a 41.94 ± 3.446a 49.73 ± 5.091b
n-3 26.12 ± 5.605b 22.71 ± 4.446a 38.79 ± 5.555c
n-6 13.91 ± 4.092b 19.23 ± 2.860c 10.95 ± 3.813a
n3/n6 2.04 ± 0.722b 1.24 ± 0.482a 3.91 ± 1.315c
Value within the same raw not sharing a common letter are significantly different (P<0.05) * Sum of 20:1 n-7, 20:1 n-9 and 20:1 n-11
** Sum of 22:1 n-9 and 22:1 n-11
456
intermediate position between wild GSB and farmed GSB sa mpled in 2014; they show the higher spatial spread; only some of them were characterized by 20:1 and 22:1 FA.
Discussion
The composition of analyzed feed was found constituted by a limited range of ingredients if we consider the total of potential ingredients suggested by the research community for the nutrition of GSB.
Several authors proposed alternative protein (Robaina, Moyano, Izquierdo, Socorro, Vergara , & Montero, 1995; Robaina et al., 1997; Kissil, Lupatsch, Higgs & Ha rdy, 2000; Pere ira & Oliva-Teles, 2003; Pere ira & Oliva-Te les, 2004; Go mez-Requeni et al., 2004; De Francesco et al., 2007; Sanchez-Lo zano et al., 2007; Emre , Sevgili, & Sanli, 2008; Martìnez-Llorens et al., 2008; Picc inno et al., 2013) and oil sources (Montero et al., 2003; Montero
et al., 2008; Benedito-Pa los et al., 2008; Fountoulaki
et al., 2009; Pérez, Rodríguez, Bolaños, Cejas &
Loren zo, 2014; Castro et al., 2015) for the feeding of GSB. Even if the research provided a wide range of raw materia ls and ingredients for feed formulat ion and manufacture, only fe w economic and largely available p lant ingredients like soybean, sunflower and rapeseed are commonly us ed to replace FM and FO. Even after the processed animal proteins (PAPs) were re-a llowed by the Eu ropean regulations fro m the June 2013 (Reg CE 56/2013) we didn’t found any PAP in our samp les. He moglobin meal has never been banned from use in feed for aquaculture but it was present only in two samples of 26. Ma rtinez – Llorens
et al. (2012) proposed a new tool for determining the optimu m fish mea l and vegetable mea l inc lusion in GSB in order to ma ximize the profitably. Their study consider the price of ra w material and the feed
conversion rate of fish fed with the use of the same ingredients as substitute of FM, proposing two inde x to evaluate the economic pro fitability of substitution. According to their study, a pea-rice mixture was the most profitable a lternative vegetable source in GSB nutrition. In our survey only two diets contained rice or pea, and none of them their mixture.
The analysis of feeds fatty acid composition is an important tool to understand the source of the raw materia ls used and it could give an idea of the proportion of the ingredients used in feed.
Monoenoic long chain fatty acids, like CA and GA , could considered as a ma rke r of the use of Northern hemisphere fish oils in feeds, since they are present in fish, like herrings and capelin, orig inating fro m North Atlantic, where they eat with copepods rich in these fatty acids (Pascal & Ackman, 1976). Otherwise, these MUFAs are not common in the Mediterranean Sea food chain (Özogul, Özogul, Çiçek, Po lat, & Kuley, 2009). This is also confirmed by the analysis of the present study wild GSB, that were caught in the Mediterranean and didn’t present considerable a mounts of these fatty acids. The presence of CA and GA was apparent in only five feeds. The presence of these fatty acids in GSB muscle decrease fro m 2005 to 2014, suggesting a reduction of the use of fish oil coming fro m North Atlantic. The aquafeed industry is now pre ferably using fish oil fro m different origins or sources, as for e xa mple the South A merican fish oil or the oil obtained from the processing of farmed fish.
Some feeds have a relevant content of ALA. These feed were formulated using linseed oil, which is the principal source of α linoleic acid used in fish nutrition (Castro et al., 2015). EPA and DHA are considered essential fatty acids for marine fish species so they must be included their fish diets. Marine fish evolved in an environ ment naturally rich in EPA and
457
DHA, produced by phytoplankton, and they lost the ability of conversion of ALA to EPA and DHA (Tocher, 2003). Fish oil is the principa l source of EPA and DHA for fish nutrit ion and even if its inclusion is strongly decreased during last 20 years, it re ma ins an irreplaceable ingredient fo r co mme rcia l aquatic feeds (Shepherd & Jackson, 2013).
The FA composition of lip ids ext ract fro m GSB mirrored the presence of FA of the commerc ial feeds used in the Mediterranean area. OA and LA were the dominant fatty ac ids in both fish and feeds sampled in 2014; the ma in sources of these two FAs are soybean and rapeseed (Tacon, Metian & Hasan, 2009), that were included in almost all the feeds we analyzed. Even though we did not have data about the feed’ composition and the FA profile used in 2005, we can assume that their formu lation affected the 2005 farmed GSB FA co mposition. The use of fish oil, especially the one made fro m Northern Atlantic fish, was higher in 2005 than 2014. Though all the 2014 -feeds contained fish oil, it see ms that its amount was limited just to the quantity needed to satisfy the EPA and DHA require ment of GSB, (EPA + DHA : 0.7 to 0.9% of DM, according to Benedito-Palos, Navarro, Kaushik & Pérez-Sánchez, (2010).
The PCA analysis of fatty acid profile suggests that the difference in fatty acid profiles of wild and farmed GSB during the last 10 years has increased. The 2014-GSB group presented higher diffe rence to the wild counterparts than 2005-GSB. Analy zing the spatial spread of samp les displayed in Figure 1, PCA showed a decrease of intragroup variability in farmed GSB fatty acid profile a mong years. 2014-fish were very close to each other, indicating a sma ll variat ion among group while 2005- fish presented a higher variability. The FA profile of fish is strongly related to the one of the diet (Kirsh, Iverson, Bowen, Kerr, & Ackman, 1998; Budge, Penney & Lall, 2012). The FA signature of GSB farmed in 2014 suggested that all fish were fed with feeds with a similar fatty acid composition. This similitude increased between the two sampling, since 2005-farmed GSB showed a higher spatial spread in the PCA plot, compared to 2014 fish.
We found higher variability in feed fatty acids profile than we e xpected observing the results of 2014-fillet FA profile. Th is phenomenon could be e xpla ined with the attitude of fish farme rs that are used to utilize more than one feed during the production cycle of fish, switching between feed comme rcia l lines but also between aquafeed company.
Conclusions
The data presented confirm that the use of ma rine-de rivate ingredients in the formulat ion of GSB feeds has been reduced in the last decade. Although the research has proposed several alternative ingredients to substitute FM and FO in aquafeed, only
soybean, cereal gluten, sunflower and rapeseed meals and oils are co mmonly used. The 2014-GSB present a more similitude between samples, indicat ing a standardization trend, co mmon to all the countries where GSB a re fa rmed, if they are co mpared with 2005-fish. Farmed GSB present a modified FA profile, with the prevalence of OA and LA and a decrease of EPA and DHA, co mpared with wild GSB and the gap has increased over the period 2005-2014.
References
Asche, F., Oglend, A. & Tveteras, S. (2013). Regime Shifts in the Fish Meal ⁄ Soybean Meal Price Ratio. Journal of Agricultural Economics, 64, 97–11. doi: 10.1111/j.1477-9552.2012.00357.x
Byelashov, O.A. & Griffin, M .E. (2014). Fish In, Fish Out: Perception of Sustainability and Contribution to Public Health, Fisheries, 39, 531-535. doi 10.1080/03632415.2014.967765
Benedito-Palos, L., Navarro, J.C., Sitjà-Bobadilla, A., Bell, J.G., Kaushik, S. & Pérez-Sánchez, J. (2008). High levels of vegetable oils in plant protein-rich diets fed to gilthead sea bream (Sparus aurata L.): growth performance, muscle fatty acid profiles and histological alterations of target tissues. The British Journal of Nutrition, 100, 992-1003. doi: 10.1017/S0007114508966071
Benedito-Palos, L., Navarro, J. C., Kaushik, K. & Pérez-Sánchez, J. (2010). Tissue-specific robustness of fatty acid signatures in cultured gilthead sea bream (Sparus aurata L.) fed practical diets with a combined high replacement of fish meal and fish oil. Journal of Animal Science, 88, 1759–1770. doi:10.2527/jas. 2009-2564
Budge, S.M ., Penney, S.N. & Lall, S.P. (2012). Estimating diets of Atlantic salmon (Salmo salar) using fatty acid signature analyses; validation with controlled feeding studies. Canadian Journal of Fisheries and Aquatic Sciences, 69, 1033-1046. doi: 10.1139/F2012-039 Castro, P.L., Caballero, M .J., Gines, R., Penedo, J.C.,
M ontero, D., Lastilla, M .T. & Izquierdo, M .S. (2015). Linseed oil inclusion in sea bream diets: effect on muscle quality and shelf life. Aquaculture Research, 46, 75–85. doi: 10.1111/are.12161
Chauton, M.S., Reitana, K.I., Norsker, N.H., Tveterås, R. & Kleivdal, H.T. (2015). A techno-economic analysis of industrial production of marine microalgae as a source of EPA and DHA-rich raw material for aquafeed: Research challenges and possibilities. Aquaculture, 436, 95–103. doi: 10.1016/j.aquaculture.2014.10.038 Christie, W.W. (2003). Preparation of derivatives of fatty
acid. In: W.W. Christie (Ed.), Lipid Analysis Isolation, Separation, Identification and Structural Analysis of Lipids, Bridgwater, England, The Oily Press.
De Francesco, M ., Parisi, G., Perez-Sanchez, J., Gomez-Requeni, P., M edale, F., Kaushik, S., M ecatti, M . & Poli, B.M . (2007). Effect of high-level fish meal replacement by plant proteins in gilthead sea bream (Sparus aurata) on growth and body/fillet quality traits. Aquaculture Nutrition, 13, 361–372. doi: 10.1111/j.1365-2095.2007.00485.x
458
for Juvenile Gilthead Sea bream (Sparus aurata). The
Israeli Journal of Aquaculture – Bamidgeh, 6, 198 -204.
Food and Agriculture Organization of the United Nations (FAO). (2014). The State of World Fisheries and Aquaculture Opportunities and challenges. Rome. http://www.fao.org/3/a-i3720e.pdf. (accessed January 23, 2016).
Folch, J. Lees, M . & Sloane Stanley, G.H. (1957). A simple method for the isolation and purification of total lipids from animal tissues. The Journal of Biological Chemistry, 226, 497-509.
Fountoulaki, E., Vasilaki, A., Hurtado, R., Grigorakis, K., Karacostas, I., Nengas, I., Rigos, G., Kotzamanis, Y., Venou, B. & Alexis, M .N. (2009). Fish oil substitution by vegetable oils in commercial diets for gilthead sea bream (Sparus aurata L.); effects on growth performance, flesh quality and fillet fatty acid profile. Recovery of fatty acid profiles by a fish oil finishing diet under fluctuating water temperatures.
Aquaculture, 289, 317–326.
doi: 10.1016/j.aquaculture.2009.01.023
Glencross, B.D., Booth, M . & Allan, G.L. (2007). A feed is only as good as its ingredients–a review of ingredient evaluation strategies for aquaculture feeds.
Aquaculture Nutrition, 13, 17–34. doi: 10.1111/j.1365-2095.2007.00450.x
Gomez-Requeni, P., M ingarro, M ., Calduch-Giner, J.A., M edale, F., M artin, S.A.M ., Houlihan, D.F., Kaushik, S. & Perez-Sanchez, J. (2004). Protein growth performance, amino acid utilisation and somatotropic axis responsiveness to fish meal replacement by plant protein sources in gilthead sea bream (Sparus aurata).
Aquaculture, 232, 493–510. doi: 10.1016/S0044-8486(03)00532-5
Grigorakis, K. (2007). Composition and organoleptic quality of farmed and wild gilthead sea bream (Sparus aurata) and sea bass (Dicentrarchus labrax) and factors affecting it: A review. Aquaculture, 272, 55-75. doi: 10.1016/S0044-8486(03)00283-7
Henry, M ., Gasco, L., Piccolo, G. & Fountoulaki, E. (2015). Review on the use of insects in the diet of farmed fish: Past and future. Animal Feed Science and Technology, 203, 1-22. doi: 10.1016/j.anifeedsci. 2015.03.001 Hemaiswarya, S., Raja, R., Ravi Kumar, R., Ganesan, V. &
Anbazhagan, C. (2011). M icroalgae: a sustainable feed source for aquaculture. World Journal of Microbiology and Biotechnology, 27, 1737–1746. doi: 10.1007/s11274-010-0632-z
Kirsch, P.E., Iverson, S.J., Bowen, W.D., Kerr, S.R. & Ackman, G.R. (1998). Dietary effects on the fatty acid signature of whole Atlantic cod (Gadus morhua).
Canadian Journal of Fisheries and Aquatic Sciences, 55, 1378-1386. doi: 10.1139/cjfas-55-6-1378
Kissil, G.W., Lupatsch, I., Higgs, D.A. & Hardy, R.W. (2000). Dietary substitution of soy and rapeseed protein concentrates for fish meal, and their effects on growth and nutrient utilization in gilthead sea bream
Sparus aurata L. Aquaculture Research, 31, 595–601. http://dx.doi.org/10.1046/j.1365-2109.2000.00477.x Koven, W. (2002). Gilt-head Sea Bream, Sparus aurata. In
Nutrient requirements and Feeding of Finfish for Aquaculture edited by Webster and Lim. CABI Publishing, New York, USA.
Martìnez-Llorens, S., Tomas, A., Monino, A.V., Gomez, J.A., Pla, M ., & Jover, M . (2008). Blood and haemoglobin meal as a protein source in gilthead sea
bream (Sparus aurata L.): effects on growth, nutritive efficiency and fillet sensory differences. Aquaculture Research, 39, 1028–1037. doi: 10.1111/j.1365-2109.2011.02977.x
Martìnez-Llorens, S., Tomas-Vidal, A. & Jover Cerda, M. (2012). A new tool for determining the optimum fish meal and vegetable meals in diets for maximizing the economic profitability of gilthead sea bream (Sparus aurata, L.) feeding. Aquaculture Research, 43, 1697– 1709. doi: 10.1111/j.1365-2109.2011.02977.x M ontero, D., Kalinowski, T., Obach, A., Robaina, L., Tort,
L., Caballero, M .J. & Izquierdo, M .S. (2003). Vegetable lipid sources for gilthead seabream (Sparus aurata): effects on fish health. Aquaculture, 225, 353– 370. doi: 10.1016/S0044-8486(03)00301-6
M ontero, D., Grasso, V., Izquierdo, M .S., Ganga, R., Real, F., Tort, L., Caballero, M .J. & Acosta, F. (2008). Total substitution of fish oil by vegetable oils in gilthead sea bream (Sparus aurata) diets: Effects on hepatic M x expression and some immune parameters.
Fish Shellfish Immunology, 24, 147-155. doi: 10.1016/j.fsi.2007.08.002
Özogul, Y., Özogul, F., Çiçek, E., Polat, A. & Kuley, E. (2006). Fat content and fatty acid compositions of 34 marine water fish species from the M editerranean Sea.
International Journal of Food Sciences and Nutrition, 60, 464-475. doi: 10.1080/09637480701838175 Pascal, J-C. & Ackman, R.G. (1976). Long chain
monoethylenic alcohol and acid isomers in lipids of copepods and capelin. Chemistry and Physics of Lipids, 16, 219-223. doi: 10.1016/0009-3084(76)90029-3
Pereira, T.G. & Oliva-Teles, A. (2003). Evaluation of corn gluten meal as a protein source in diets for gilthead sea bream (Sparus aurata L.) juveniles. Aquaculture Research, 34, 1111–1117. doi: 10.1046/j.1365-2109.2003.00909.x
Pereira, T.G. & Oliva-Teles, A. (2004). Evaluation of micronized lupin seed meal as an alternative protein source in diets for gilthead sea bream (Sparus aurata) juveniles. Aquaculture Research, 35, 828–835. doi: 10.1111/j.1365-2109.2004.01073.x
Pérez, J.A., Rodríguez, C., Bolaños, A., Cejas, J.R. & Lorenzo, A. (2014). Beef tallow as an alternative to fish oil in diets for gilthead sea bream (Sparus aurata) juveniles: Effects on fish performance, tissue fatty acid composition, health and flesh nutritional value.
European Journal of Lipid Science and Technology, 116, 571–583. doi:10.1002/ejlt.201300457
Piccinno, M ., Schiavone, R., Zilli, L., Sicuro, B., Storelli, C. & Vilella, S. (2013). Sea Cucumber M eal as Alternative Protein Source to Fishmeal in Gilthead Sea Bream (Sparus aurata) Nutrition: Effects on Growth and Welfare. Turkish Journal of Fisheries and Aquatic Sciences, 13, 305-313. doi: 0.4194/1303-2712-v13_2_12
Rana, K.J., Siriwardena, S. & Hasan, M .R. (2009). Impact of rising feed ingredient prices on aquafeeds and aquaculture production. FAO Fisheries and Aquaculture Technical Paper. No. 541. Rome, FAO. 63 pp. http://www.fao.org/docrep/012/i1143e/i1143e 00.htm
459
Aquaculture, 130, 219–233. doi: 10.1016/0044-8486(94)00225-D
Robaina, L., M oyano, F.J., Izquierdo, J.M ., Socorro, J., Vergara, J.M . & M ontero, D. (1997). Corn gluten and meat and bone meals as protein sources in diets for gilthead seabream (Sparus aurata): nutritional and histological implications. Aquaculture, 157, 347–359. doi: 10.1016/S0044-8486(03)00301-6
Sales, J. (2009). The effect of fish meal replacement by soybean products on fish growth: a meta-analysis.
British Journal of Nutrition, 102, 1709-1722. http://dx.doi.org/10.1017/S0007114509991279 Sanchez-Lozano, N.B., Tomas, A., M artìnez-Llorens, S.,
Nogales, S., Espert, J. M onino Lopez, A. Pla, M . & Cerda, M . (2007). Growth and economic profit of gilthead sea bream (Sparus aurata, L.) fed sunflower meal. Aquaculture, 272, 528-534. doi: 10.1016/j.aquaculture.2007.07.221
Sargent, J.R., Tocher, D.R., Bell, J.G., (2002). The lipids, In: Halver, J.E., Hardy, R.W. (Eds.), Fish Nutrition, 3rd edition. (pp. 181–257), Academic Press, San Diego.
Shepherd, C.J. & Jackson, A.J. (2013). Global fishmeal and fish-oil supply: inputs, outputs and markets. Journal of Fish Biology, 83, 1046–1066. doi:
10.1111/jfb.12224
Tacon, A.G., M etian, M . & Hasan, M .R. (2009). Feed ingredients and fertilizers for farmed aquatic animals: Sources and composition. FAO Fisheries and Aquaculture Technical Paper, Roma, Italy. http://www.fao.org/docrep/012/i1142e/i1142e.pdf Tacon, A.G. & M etian, M . (2015). Feed M atters: Satisfying
the feed demand of Aquaculture. Reviews in Fisheries Science & Aquaculture, 23, 1-10. doi:10.1080/ 23308249.2014.987209
Tocher, D.R. (2003). M etabolism and Functions of lipids and fatty acids in teleost fish. Reviews in Fisheries Science, 11, 107-184. doi: 10.1080/713610925 Turchini, G., Torstensen, B.E. & Ng, W.K. (2009). Fish oil
replacement in finfish nutrition. Reviews in Aquaculture, 1, 10-57. doi: 10.1111/j.1753-5131.2008.01001.x