Published by Central Fisheries Research Institute (SUMAE) Trabzon, Turkey in cooperation with Japan International Cooperation Agency (JICA), Japan
R E S E A R C H P A P E R
The Diet Composition of European Anchovy,
Engraulis
encrasicolus
(Linnaeus, 1758) in İzmir Bay, Aegean Sea
Sencer Akalin
1,*, Tuncay Murat Sever
1, Dilek Ilhan
1, Aydın Unluoglu
21Ege University, Faculty of Fisheries, 35100, Bornova, İzmir, Turkey.
2Dokuz Eylül University, Institute of Marine Sciences and Technology, 35340, İnciraltı, İzmir, Turkey.
Article History
Received 11 December 2017 Accepted 14 May 2018 First Online 16 May 2018
Corresponding Author Tel.: +90.232 3115341
E-mail: sencer.akalin@ege.edu.tr
Keywords Engraulidae Stomach Content IRI
Zooplankton Copepoda
Abstract
In this study, seasonal and size related variations in the diet composition of European anchovy (Engraulis encrasicolus) were studied. A total of 545 European anchovy individuals were collected from commercial purse-seine catches in İzmir Bay (Aegean Sea, Turkey) during 2005-2006. Overall, 498 of the stomachs were found with food items and 47 were empty. A total of 19 different prey groups were identified belonging to eight major systematic groups, i.e. Siphonophora, Polychaeta, Crustacea, Mollusca, Echinodermata, Chaetognatha, Appendicularia and Actinopterygii in the stomachs. Crustaceans (especially Copepoda) were the most important preys in terms of IRI% at all seasons and size groups. According to the Bray Curtis similarity index, while there were no significant differences in the diet composition among seasons, only the fishes bigger than 12 cm were seen different from other size groups. This study represents the most detailed information on the organisms in the diet of European anchovy from the Turkish coast of the Aegean Sea.
Introduction
The European anchovy (Engraulis encrasicolus L., 1758) is a small pelagic fish species distributed in the Mediterranean Sea (including the Black and the Azov Seas), and also along the eastern Atlantic coast from Norway to the South Africa. This small-sized fish generally forms large schools at the coastal marine areas (Whitehead, Nelson, & Wongratana, 1988). Due to its abundance in pelagic environments, european anchovy is one of the highly commercial target species of the Mediterranean fishery (Lleonart & Maynou, 2003; Palomera, Olivar, Salat, Sabatés, Coll, García, & Morales-Nin, 2007; Giannoulaki, Valavanis, Palialexis, Tsagarakis, Machias, Somarakis, & Papaconstantinou, 2008). European anchovy is the most important small pelagic fish species for the Turkish fisheries and alone comprises almost 65% of the overall marine fish catch
(Cihangir & Ünlüoğlu, 2015). The average of total anchovy production in Turkey is 203 501 tonnes during last decade and the contribution of the Aegean Sea is about 5% (TUIK, 2006-2016).
The anchovy is also ecologically important in pelagic ecosystems because of playing a major role either a prey or a consumer in establishing a fundamental link between the lower and upper trophic levels (Bulgakova, 1992; Tudela & Palomera, 1997; Palomera et al., 2007). As a prey, anchovy is the main food resource for some highly commercial pelagic and/or demersal fishes such as Scomber scombrus, Thunnus thynnus, Thunnus alalunga, Xiphias gladius, Merluccius merluccius (Karachle and Stergiou, 2017).
rate and feeding periodicity of anchovy have been investigated in the Black Sea (Bulgakova, 1993), in the Catalan Sea (Tudela & Palomera, 1995; 1997), in the Gulf of Lions (Plounevez & Champalbert, 2000; Costalago, Palomera & Tirelli, 2014) in the Adriatic Sea (Borme, Tirelli, Brandt, Fonda Umani & Arneri, 2009), on the Algerian coast (Bacha & Amara, 2009), in the North-western Mediterranean (Morote, Olivar, Villate & Uriarte, 2010), in the North and Baltic Seas (Raab, Nagelkerke, Boerée, Rijnsdorp, Temming, & Dickey-Collas, 2011; Schaber, Petereit & Paulsen, 2010), in the North Aegean Sea (Karachle & Stergiou, 2014) and in waters of Mauritania (Gushchin & Corten, 2015). However, data on food and feeding of the anchovy are scarce in Turkish Seas. Although season related variations in stomach contents of anchovy have been taken into consideration in two studies conducted in the Aegean Sea, limited information has been provided by these studies since the food organisms have been identified to the general taxonomic level such as copepods, cladocerans, molluscs, fish etc (Uçkun, Sever, & Toğulga, 2003; Ünlüoğlu & Benli, 2004).
The aim of this study is to present a more comprehensive diet description for the anchovy in İzmir Bay (the eastern Aegean Sea). Unlike two previous studies had been done in the region, specially copepods and cladocerans were identified as much as possible at species level in this study. The other objective is to evaluate the season and size related variations in the stomach contents.
Materials and Methods
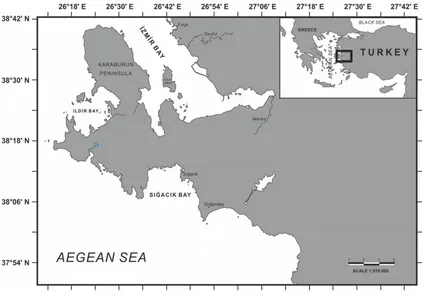
The fish samples were collected by montly from commercial catches during between January and December 2005 in the İzmir Bay (Figure 1). Specimens were preserved in buffered 10% formalin solution and taken to the laboratory for subsequent analysis. The fork length (FL) of each specimen was measured to the nearest mm and after dissection the stomach of each fish was removed and stored in 10% formalin solution until identification. Later the stomachs were cut longitudinally and the contents of each stomach were transferred to a petri dish and identified to the lowest possible taxonomic level under a binocular microscope. All food items were enumerated and weighed wet with a precision of ±0.0001 g after the removal of excess fluid. Food remains, which were not recognizable due to an advanced stage of digestion, were recorded as unidentified.
In order to provide a quantitative description of stomach contents and also to evaluate the relative importance of various prey types in the diet, three common measures, percentage frequency of occurrence (F%), percentage composition by number (N%), and percentage composition by weight (W%) were used (Hyslop, 1980). The index of relative importance (IRI) was also calculated for each prey item by incorporating of these percentage measures (Pinkas, Oliphant & Iverson, 1971). IRI values were expressed as
a percent basis to obtain a robust estimate of relative importance of each prey in the diet of studied fish and, to promote consistency and facilitate comparison among studies (Cortés, 1998).
To assess for possible changes in diet with respect to size of the anchovy, the sampled fish were grouped arbitrarily into 4 fork length classes, which were arranged as < 8.0 cm and 8.0-9.9 cm, 10.0-11.9 cm and ≥12.0 cm.
Subsequently, food items were grouped into categories of preference using the method proposed by Morato-Gomes (1995). The categories were defined as follows:
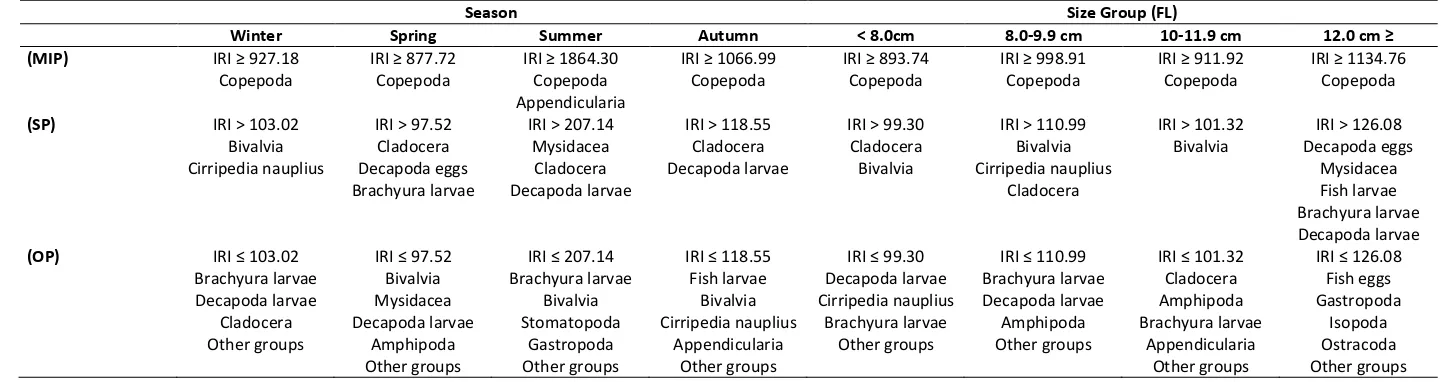
IRI≥30 × (0.15 × ΣF%) main important prey (MIP) 30 × (0.15 × ΣF%)>IRI>10 × (0.05 × ΣF%) secondary prey (SP) IRI≤10 × (0.05 × ΣF%) occasional prey (OP)
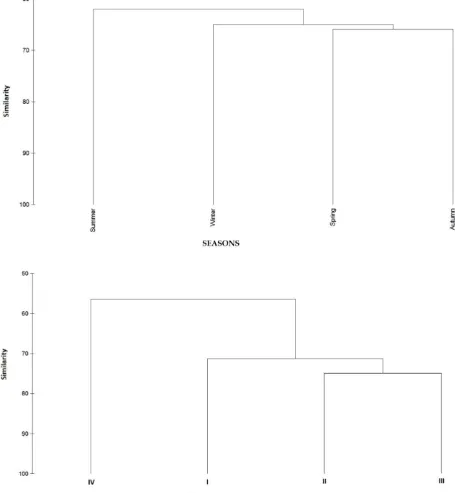
Bray-Curtis similarity index on the basis of the percentage number of the food items (N%) were analysed by seasons and size groups (Washington, 1984).
Results
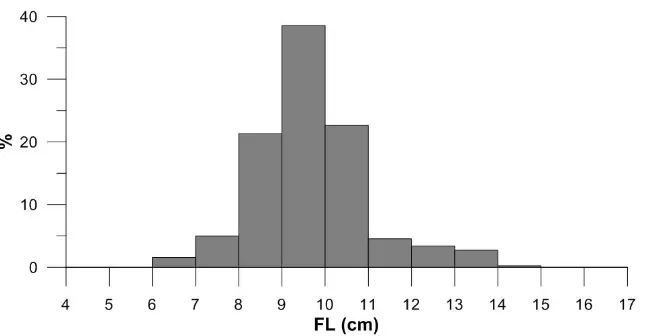
A total of 545 anchovy specimens between 6.0 and 14.4 cm FL were sampled in the study and most of the samples were in 8.0-11.0 cm size group (82.5%) (Figure 2). 47 of the stomachs were empty (8.62%) and the numbers of the empty stomachs varied by seasons as 24 in winter (12.01%), 9 in spring (8.18%), 1 in summer (27.77%) and 13 in autumn (11.81%), respectively. The diet of European anchovy consisted of a wide variety of zooplanktonic organisms and comprised mainly copepods and cladoceras. Organisms found in the stomachs of anchovy were grouped in the 19 different prey category: siphonophora, polychaeta, crustacea, ostracoda, cladocera, copepoda, isopoda, euphausiacea larvae, amphipoda, mysidacea, chaetognatha, appendicularia, decapod crustacean
eggs and larvae, brachyura larvae, cirripedia, gastropoda, bivalvia, echinodermata, fish larvae and eggs (Table 1).
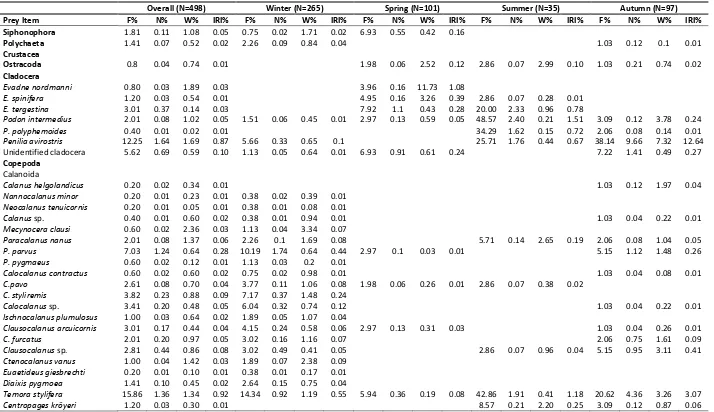
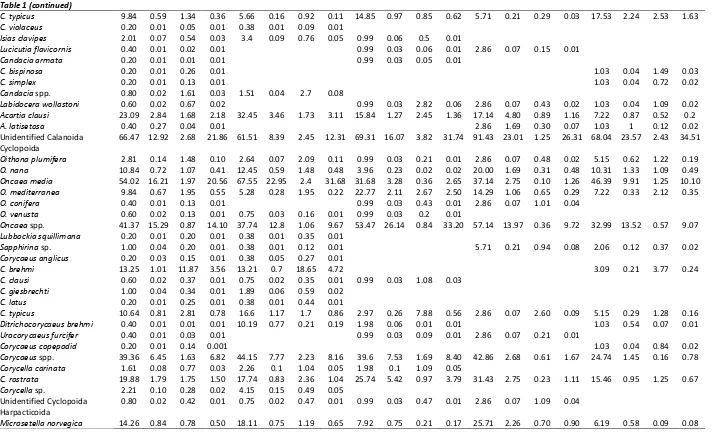
Copepods (82.86%IRI) were the main prey group in the diet and almost 49 copepod species were identified. The major copepods were respectively: Onceae media (20.56%IRI), Euterpina acutifrons (7.03%IRI), Corycaeus brehmi (3.56%IRI), Acartia clausi (2.18%IRI), Corycella rostrata (1.50%IRI). Copepods followed by Bivalvia larvae (29.52% F; 8.78%IRI). Other prey groups such as appendicularia, polychaeta, amphipoda, gastropoda, echinodermata etc. contributed to diet relatively low percentages. Pelagic copepods dominated the diet of anchovy in all seasons, but their percentage contributions showed variations by the seasons. While Oncaea media (31.68%IRI), Euterpina acutifrons (6.75%IRI) and Acartia clausi (3.11%IRI) were predominant in winter, Corycella rostrata (3.79%IRI), O. media (2.65%IRI), Oncea mediterranea (2.50%IRI) and E. acutifrons (0.57%IRI) were in spring, E. acutifrons (9.16%IRI), A. clausi (1.16%IRI), O. media (1.26%IRI), C.rostrata (1.11%IRI), Microsetella norvegica (0.90%IRI)and Temora stylifera (1.18%IRI) were in summer, E. acutifrons (12.41%IRI), O. media (10.10%IRI), T. stylifera (3.07%IRI) and Centropages typicus (1.63%IRI).were in autumn (Table 1). The secondary preys in the diet of anchovy were also changed by seasons: bivalvia (12.35%IRI) in winter, decapod crustacean eggs (4.31%IRI), brachyura larvae (2.85%IRI) and cladoceras (2.31%IRI) in spring, unidentified appendicularia (27.25%IRI) in summer, a cladocera species Penilia avirostris (12.64%IRI) in autumn (Table 1).
Copepods were constituted the majority of the diet of anchovy in all size-classes (Table 2). Anchovy specimens smaller than 8 cm mostly preyed upon calanoid and cyclopoid copepods and mainly Oncea media at species level. In the diet of < 8.0 cm size class, the contribution of the other prey organisms was comparatively lower and of less importance than other
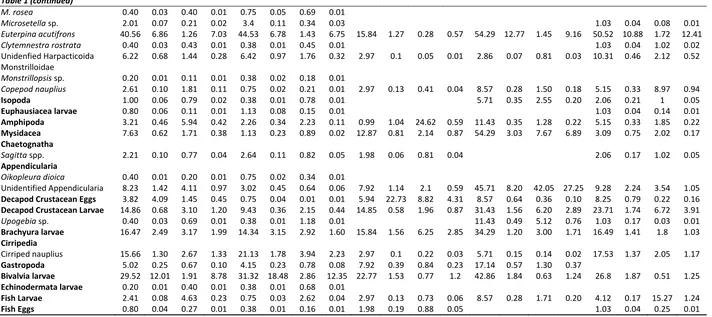
Table 1. Overall and seasonal diet composition of Engraulis encrasicolus in İzmir Bay
Overall (N=498) Winter (N=265) Spring (N=101) Summer (N=35) Autumn (N=97)
Prey Item F% N% W% IRI% F% N% W% IRI% F% N% W% IRI% F% N% W% IRI% F% N% W% IRI%
Siphonophora 1.81 0.11 1.08 0.05 0.75 0.02 1.71 0.02 6.93 0.55 0.42 0.16
Polychaeta 1.41 0.07 0.52 0.02 2.26 0.09 0.84 0.04 1.03 0.12 0.1 0.01
Crustacea
Ostracoda 0.8 0.04 0.74 0.01 1.98 0.06 2.52 0.12 2.86 0.07 2.99 0.10 1.03 0.21 0.74 0.02
Cladocera
Evadne nordmanni 0.80 0.03 1.89 0.03 3.96 0.16 11.73 1.08
E. spinifera 1.20 0.03 0.54 0.01 4.95 0.16 3.26 0.39 2.86 0.07 0.28 0.01
E. tergestina 3.01 0.37 0.14 0.03 7.92 1.1 0.43 0.28 20.00 2.33 0.96 0.78
Podon intermedius 2.01 0.08 1.02 0.05 1.51 0.06 0.45 0.01 2.97 0.13 0.59 0.05 48.57 2.40 0.21 1.51 3.09 0.12 3.78 0.24
P. polyphemoides 0.40 0.01 0.02 0.01 34.29 1.62 0.15 0.72 2.06 0.08 0.14 0.01
Penilia avirostris 12.25 1.64 1.69 0.87 5.66 0.33 0.65 0.1 25.71 1.76 0.44 0.67 38.14 9.66 7.32 12.64 Unidentified cladocera 5.62 0.69 0.59 0.10 1.13 0.05 0.64 0.01 6.93 0.91 0.61 0.24 7.22 1.41 0.49 0.27 Copepoda
Calanoida
Calanus helgolandicus 0.20 0.02 0.34 0.01 1.03 0.12 1.97 0.04
Nannocalanus minor 0.20 0.01 0.23 0.01 0.38 0.02 0.39 0.01
Neocalanus tenuicornis 0.20 0.01 0.05 0.01 0.38 0.01 0.08 0.01
Calanus sp. 0.40 0.01 0.60 0.02 0.38 0.01 0.94 0.01 1.03 0.04 0.22 0.01
Mecynocera clausi 0.60 0.02 2.36 0.03 1.13 0.04 3.34 0.07
Paracalanus nanus 2.01 0.08 1.37 0.06 2.26 0.1 1.69 0.08 5.71 0.14 2.65 0.19 2.06 0.08 1.04 0.05
P. parvus 7.03 1.24 0.64 0.28 10.19 1.74 0.64 0.44 2.97 0.1 0.03 0.01 5.15 1.12 1.48 0.26
P. pygmaeus 0.60 0.02 0.12 0.01 1.13 0.03 0.2 0.01
Calocalanus contractus 0.60 0.02 0.60 0.02 0.75 0.02 0.98 0.01 1.03 0.04 0.08 0.01
C.pavo 2.61 0.08 0.70 0.04 3.77 0.11 1.06 0.08 1.98 0.06 0.26 0.01 2.86 0.07 0.38 0.02
C. styliremis 3.82 0.23 0.88 0.09 7.17 0.37 1.48 0.24
Calocalanus sp. 3.41 0.20 0.48 0.05 6.04 0.32 0.74 0.12 1.03 0.04 0.22 0.01
Ischnocalanus plumulosus 1.00 0.03 0.64 0.02 1.89 0.05 1.07 0.04
Clausocalanus arcuicornis 3.01 0.17 0.44 0.04 4.15 0.24 0.58 0.06 2.97 0.13 0.31 0.03 1.03 0.04 0.26 0.01
C. furcatus 2.01 0.20 0.97 0.05 3.02 0.16 1.16 0.07 2.06 0.75 1.61 0.09
Clausocalanus sp. 2.81 0.44 0.86 0.08 3.02 0.49 0.41 0.05 2.86 0.07 0.96 0.04 5.15 0.95 3.11 0.41
Ctenocalanus vanus 1.00 0.04 1.42 0.03 1.89 0.07 2.38 0.09
Euaetideus giesbrechti 0.20 0.01 0.10 0.01 0.38 0.01 0.17 0.01
Diaixis pygmoea 1.41 0.10 0.45 0.02 2.64 0.15 0.75 0.04
Temora stylifera 15.86 1.36 1.34 0.92 14.34 0.92 1.19 0.55 5.94 0.36 0.19 0.08 42.86 1.91 0.41 1.18 20.62 4.36 3.26 3.07
Table 1 (continued)
C. typicus 9.84 0.59 1.34 0.36 5.66 0.16 0.92 0.11 14.85 0.97 0.85 0.62 5.71 0.21 0.29 0.03 17.53 2.24 2.53 1.63
C. violaceus 0.20 0.01 0.05 0.01 0.38 0.01 0.09 0.01
Isias clavipes 2.01 0.07 0.54 0.03 3.4 0.09 0.76 0.05 0.99 0.06 0.5 0.01
Lucicutia flavicornis 0.40 0.01 0.02 0.01 0.99 0.03 0.06 0.01 2.86 0.07 0.15 0.01
Candacia armata 0.20 0.01 0.01 0.01 0.99 0.03 0.05 0.01
C. bispinosa 0.20 0.01 0.26 0.01 1.03 0.04 1.49 0.03
C. simplex 0.20 0.01 0.13 0.01 1.03 0.04 0.72 0.02
Candacia spp. 0.80 0.02 1.61 0.03 1.51 0.04 2.7 0.08
Labidocera wollastoni 0.60 0.02 0.67 0.02 0.99 0.03 2.82 0.06 2.86 0.07 0.43 0.02 1.03 0.04 1.09 0.02
Acartia clausi 23.09 2.84 1.68 2.18 32.45 3.46 1.73 3.11 15.84 1.27 2.45 1.36 17.14 4.80 0.89 1.16 7.22 0.87 0.52 0.2
A. latisetosa 0.40 0.27 0.04 0.01 2.86 1.69 0.30 0.07 1.03 1 0.12 0.02 Unidentified Calanoida 66.47 12.92 2.68 21.86 61.51 8.39 2.45 12.31 69.31 16.07 3.82 31.74 91.43 23.01 1.25 26.31 68.04 23.57 2.43 34.51 Cyclopoida
Oithona plumifera 2.81 0.14 1.48 0.10 2.64 0.07 2.09 0.11 0.99 0.03 0.21 0.01 2.86 0.07 0.48 0.02 5.15 0.62 1.22 0.19
O. nana 10.84 0.72 1.07 0.41 12.45 0.59 1.48 0.48 3.96 0.23 0.02 0.02 20.00 1.69 0.31 0.48 10.31 1.33 1.09 0.49
Oncaea media 54.02 16.21 1.97 20.56 67.55 22.95 2.4 31.68 31.68 3.28 0.36 2.65 37.14 2.75 0.10 1.26 46.39 9.91 1.25 10.10
O. mediterranea 9.84 0.67 1.95 0.55 5.28 0.28 1.95 0.22 22.77 2.11 2.67 2.50 14.29 1.06 0.65 0.29 7.22 0.33 2.12 0.35
O. conifera 0.40 0.01 0.13 0.01 0.99 0.03 0.43 0.01 2.86 0.07 1.01 0.04
O. venusta 0.60 0.02 0.13 0.01 0.75 0.03 0.16 0.01 0.99 0.03 0.2 0.01
Oncaea spp. 41.37 15.29 0.87 14.10 37.74 12.8 1.06 9.67 53.47 26.14 0.84 33.20 57.14 13.97 0.36 9.72 32.99 13.52 0.57 9.07
Lubbockia squillimana 0.20 0.01 0.20 0.01 0.38 0.01 0.35 0.01
Sapphirina sp. 1.00 0.04 0.20 0.01 0.38 0.01 0.12 0.01 5.71 0.21 0.94 0.08 2.06 0.12 0.37 0.02
Corycaeus anglicus 0.20 0.03 0.15 0.01 0.38 0.05 0.27 0.01
C. brehmi 13.25 1.01 11.87 3.56 13.21 0.7 18.65 4.72 3.09 0.21 3.77 0.24
C. clausi 0.60 0.02 0.37 0.01 0.75 0.02 0.35 0.01 0.99 0.03 1.08 0.03
C. giesbrechti 1.00 0.04 0.34 0.01 1.89 0.06 0.59 0.02
C. latus 0.20 0.01 0.25 0.01 0.38 0.01 0.44 0.01
C. typicus 10.64 0.81 2.81 0.78 16.6 1.17 1.7 0.86 2.97 0.26 7.88 0.56 2.86 0.07 2.60 0.09 5.15 0.29 1.28 0.16
Ditrichocorycaeus brehmi 0.40 0.01 0.01 0.01 10.19 0.77 0.21 0.19 1.98 0.06 0.01 0.01 1.03 0.54 0.07 0.01
Urocorycaeus furcifer 0.40 0.01 0.03 0.01 0.99 0.03 0.09 0.01 2.86 0.07 0.21 0.01
Corycaeus copepodid 0.20 0.01 0.14 0.001 1.03 0.04 0.84 0.02
Corycaeus spp. 39.36 6.45 1.63 6.82 44.15 7.77 2.23 8.16 39.6 7.53 1.69 8.40 42.86 2.68 0.61 1.67 24.74 1.45 0.16 0.78
Corycella carinata 1.61 0.08 0.77 0.03 2.26 0.1 1.04 0.05 1.98 0.1 1.09 0.05
C. rostrata 19.88 1.79 1.75 1.50 17.74 0.83 2.36 1.04 25.74 5.42 0.97 3.79 31.43 2.75 0.23 1.11 15.46 0.95 1.25 0.67
Corycella sp. 2.21 0.10 0.28 0.02 4.15 0.15 0.49 0.05
Unidentified Cyclopoida 0.80 0.02 0.42 0.01 0.75 0.02 0.47 0.01 0.99 0.03 0.47 0.01 2.86 0.07 1.09 0.04 Harpacticoida
Table 1 (continued)
M. rosea 0.40 0.03 0.40 0.01 0.75 0.05 0.69 0.01
Microsetella sp. 2.01 0.07 0.21 0.02 3.4 0.11 0.34 0.03 1.03 0.04 0.08 0.01
Euterpina acutifrons 40.56 6.86 1.26 7.03 44.53 6.78 1.43 6.75 15.84 1.27 0.28 0.57 54.29 12.77 1.45 9.16 50.52 10.88 1.72 12.41
Clytemnestra rostrata 0.40 0.03 0.43 0.01 0.38 0.01 0.45 0.01 1.03 0.04 1.02 0.02 Unidenfied Harpacticoida 6.22 0.68 1.44 0.28 6.42 0.97 1.76 0.32 2.97 0.1 0.05 0.01 2.86 0.07 0.81 0.03 10.31 0.46 2.12 0.52 Monstrilloidae
Monstrillopsis sp. 0.20 0.01 0.11 0.01 0.38 0.02 0.18 0.01
Copepod nauplius 2.61 0.10 1.81 0.11 0.75 0.02 0.21 0.01 2.97 0.13 0.41 0.04 8.57 0.28 1.50 0.18 5.15 0.33 8.97 0.94
Isopoda 1.00 0.06 0.79 0.02 0.38 0.01 0.78 0.01 5.71 0.35 2.55 0.20 2.06 0.21 1 0.05
Euphausiacea larvae 0.80 0.06 0.11 0.01 1.13 0.08 0.15 0.01 1.03 0.04 0.14 0.01
Amphipoda 3.21 0.46 5.94 0.42 2.26 0.34 2.23 0.11 0.99 1.04 24.62 0.59 11.43 0.35 1.28 0.22 5.15 0.33 1.85 0.22 Mysidacea 7.63 0.62 1.71 0.38 1.13 0.23 0.89 0.02 12.87 0.81 2.14 0.87 54.29 3.03 7.67 6.89 3.09 0.75 2.02 0.17 Chaetognatha
Sagitta spp. 2.21 0.10 0.77 0.04 2.64 0.11 0.82 0.05 1.98 0.06 0.81 0.04 2.06 0.17 1.02 0.05 Appendicularia
Oikopleura dioica 0.40 0.01 0.20 0.01 0.75 0.02 0.34 0.01
Unidentified Appendicularia 8.23 1.42 4.11 0.97 3.02 0.45 0.64 0.06 7.92 1.14 2.1 0.59 45.71 8.20 42.05 27.25 9.28 2.24 3.54 1.05 Decapod Crustacean Eggs 3.82 4.09 1.45 0.45 0.75 0.04 0.01 0.01 5.94 22.73 8.82 4.31 8.57 0.64 0.36 0.10 8.25 0.79 0.22 0.16 Decapod Crustacean Larvae 14.86 0.68 3.10 1.20 9.43 0.36 2.15 0.44 14.85 0.58 1.96 0.87 31.43 1.56 6.20 2.89 23.71 1.74 6.72 3.91
Upogebia sp. 0.40 0.03 0.69 0.01 0.38 0.01 1.18 0.01 11.43 0.49 5.12 0.76 1.03 0.17 0.03 0.01 Brachyura larvae 16.47 2.49 3.17 1.99 14.34 3.15 2.92 1.60 15.84 1.56 6.25 2.85 34.29 1.20 3.00 1.71 16.49 1.41 1.8 1.03 Cirripedia
Cirriped nauplius 15.66 1.30 2.67 1.33 21.13 1.78 3.94 2.23 2.97 0.1 0.22 0.03 5.71 0.15 0.14 0.02 17.53 1.37 2.05 1.17 Gastropoda 5.02 0.25 0.67 0.10 4.15 0.23 0.78 0.08 7.92 0.39 0.84 0.23 17.14 0.57 1.30 0.37
Bivalvia larvae 29.52 12.01 1.91 8.78 31.32 18.48 2.86 12.35 22.77 1.53 0.77 1.2 42.86 1.84 0.63 1.24 26.8 1.87 0.51 1.25 Echinodermata larvae 0.20 0.01 0.40 0.01 0.38 0.01 0.68 0.01
Fish Larvae 2.41 0.08 4.63 0.23 0.75 0.03 2.62 0.04 2.97 0.13 0.73 0.06 8.57 0.28 1.71 0.20 4.12 0.17 15.27 1.24
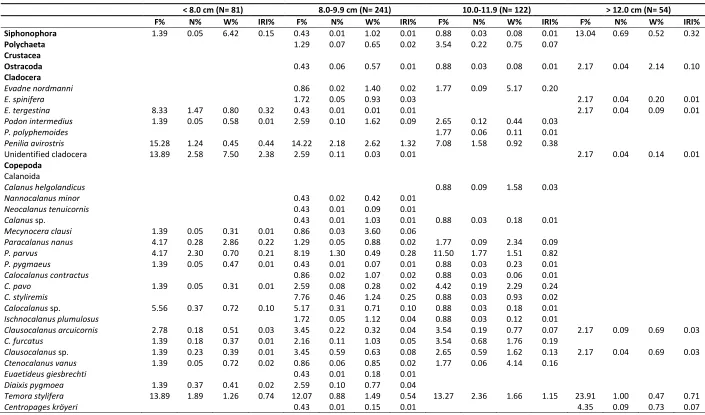
Table 2. Diet composition of Engraulis encrasicolus according to the size groups
< 8.0 cm (N= 81) 8.0-9.9 cm (N= 241) 10.0-11.9 (N= 122) > 12.0 cm (N= 54)
F% N% W% IRI% F% N% W% IRI% F% N% W% IRI% F% N% W% IRI%
Siphonophora 1.39 0.05 6.42 0.15 0.43 0.01 1.02 0.01 0.88 0.03 0.08 0.01 13.04 0.69 0.52 0.32
Polychaeta 1.29 0.07 0.65 0.02 3.54 0.22 0.75 0.07
Crustacea
Ostracoda 0.43 0.06 0.57 0.01 0.88 0.03 0.08 0.01 2.17 0.04 2.14 0.10
Cladocera
Evadne nordmanni 0.86 0.02 1.40 0.02 1.77 0.09 5.17 0.20
E. spinifera 1.72 0.05 0.93 0.03 2.17 0.04 0.20 0.01
E. tergestina 8.33 1.47 0.80 0.32 0.43 0.01 0.01 0.01 2.17 0.04 0.09 0.01
Podon intermedius 1.39 0.05 0.58 0.01 2.59 0.10 1.62 0.09 2.65 0.12 0.44 0.03
P. polyphemoides 1.77 0.06 0.11 0.01
Penilia avirostris 15.28 1.24 0.45 0.44 14.22 2.18 2.62 1.32 7.08 1.58 0.92 0.38
Unidentified cladocera 13.89 2.58 7.50 2.38 2.59 0.11 0.03 0.01 2.17 0.04 0.14 0.01
Copepoda Calanoida
Calanus helgolandicus 0.88 0.09 1.58 0.03
Nannocalanus minor 0.43 0.02 0.42 0.01
Neocalanus tenuicornis 0.43 0.01 0.09 0.01
Calanus sp. 0.43 0.01 1.03 0.01 0.88 0.03 0.18 0.01
Mecynocera clausi 1.39 0.05 0.31 0.01 0.86 0.03 3.60 0.06
Paracalanus nanus 4.17 0.28 2.86 0.22 1.29 0.05 0.88 0.02 1.77 0.09 2.34 0.09
P. parvus 4.17 2.30 0.70 0.21 8.19 1.30 0.49 0.28 11.50 1.77 1.51 0.82
P. pygmaeus 1.39 0.05 0.47 0.01 0.43 0.01 0.07 0.01 0.88 0.03 0.23 0.01
Calocalanus contractus 0.86 0.02 1.07 0.02 0.88 0.03 0.06 0.01
C. pavo 1.39 0.05 0.31 0.01 2.59 0.08 0.28 0.02 4.42 0.19 2.29 0.24
C. styliremis 7.76 0.46 1.24 0.25 0.88 0.03 0.93 0.02
Calocalanus sp. 5.56 0.37 0.72 0.10 5.17 0.31 0.71 0.10 0.88 0.03 0.18 0.01
Ischnocalanus plumulosus 1.72 0.05 1.12 0.04 0.88 0.03 0.12 0.01
Clausocalanus arcuicornis 2.78 0.18 0.51 0.03 3.45 0.22 0.32 0.04 3.54 0.19 0.77 0.07 2.17 0.09 0.69 0.03
C. furcatus 1.39 0.18 0.37 0.01 2.16 0.11 1.03 0.05 3.54 0.68 1.76 0.19
Clausocalanus sp. 1.39 0.23 0.39 0.01 3.45 0.59 0.63 0.08 2.65 0.59 1.62 0.13 2.17 0.04 0.69 0.03
Ctenocalanus vanus 1.39 0.05 0.72 0.02 0.86 0.06 0.85 0.02 1.77 0.06 4.14 0.16
Euaetideus giesbrechti 0.43 0.01 0.18 0.01
Diaixis pygmoea 1.39 0.37 0.41 0.02 2.59 0.10 0.77 0.04
Temora stylifera 13.89 1.89 1.26 0.74 12.07 0.88 1.49 0.54 13.27 2.36 1.66 1.15 23.91 1.00 0.47 0.71
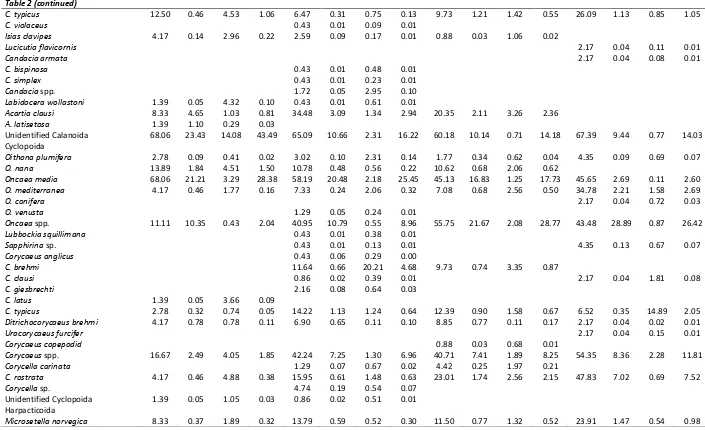
Table 2 (continued)
C. typicus 12.50 0.46 4.53 1.06 6.47 0.31 0.75 0.13 9.73 1.21 1.42 0.55 26.09 1.13 0.85 1.05
C. violaceus 0.43 0.01 0.09 0.01
Isias clavipes 4.17 0.14 2.96 0.22 2.59 0.09 0.17 0.01 0.88 0.03 1.06 0.02
Lucicutia flavicornis 2.17 0.04 0.11 0.01
Candacia armata 2.17 0.04 0.08 0.01
C. bispinosa 0.43 0.01 0.48 0.01
C. simplex 0.43 0.01 0.23 0.01
Candacia spp. 1.72 0.05 2.95 0.10
Labidocera wollastoni 1.39 0.05 4.32 0.10 0.43 0.01 0.61 0.01
Acartia clausi 8.33 4.65 1.03 0.81 34.48 3.09 1.34 2.94 20.35 2.11 3.26 2.36
A. latisetosa 1.39 1.10 0.29 0.03
Unidentified Calanoida 68.06 23.43 14.08 43.49 65.09 10.66 2.31 16.22 60.18 10.14 0.71 14.18 67.39 9.44 0.77 14.03 Cyclopoida
Oithona plumifera 2.78 0.09 0.41 0.02 3.02 0.10 2.31 0.14 1.77 0.34 0.62 0.04 4.35 0.09 0.69 0.07
O. nana 13.89 1.84 4.51 1.50 10.78 0.48 0.56 0.22 10.62 0.68 2.06 0.62
Oncaea media 68.06 21.21 3.29 28.38 58.19 20.48 2.18 25.45 45.13 16.83 1.25 17.73 45.65 2.69 0.11 2.60
O. mediterranea 4.17 0.46 1.77 0.16 7.33 0.24 2.06 0.32 7.08 0.68 2.56 0.50 34.78 2.21 1.58 2.69
O. conifera 2.17 0.04 0.72 0.03
O. venusta 1.29 0.05 0.24 0.01
Oncaea spp. 11.11 10.35 0.43 2.04 40.95 10.79 0.55 8.96 55.75 21.67 2.08 28.77 43.48 28.89 0.87 26.42
Lubbockia squillimana 0.43 0.01 0.38 0.01
Sapphirina sp. 0.43 0.01 0.13 0.01 4.35 0.13 0.67 0.07
Corycaeus anglicus 0.43 0.06 0.29 0.00
C. brehmi 11.64 0.66 20.21 4.68 9.73 0.74 3.35 0.87
C. clausi 0.86 0.02 0.39 0.01 2.17 0.04 1.81 0.08
C. giesbrechti 2.16 0.08 0.64 0.03
C. latus 1.39 0.05 3.66 0.09
C. typicus 2.78 0.32 0.74 0.05 14.22 1.13 1.24 0.64 12.39 0.90 1.58 0.67 6.52 0.35 14.89 2.05
Ditrichocorycaeus brehmi 4.17 0.78 0.78 0.11 6.90 0.65 0.11 0.10 8.85 0.77 0.11 0.17 2.17 0.04 0.02 0.01
Urocorycaeus furcifer 2.17 0.04 0.15 0.01
Corycaeus copepodid 0.88 0.03 0.68 0.01
Corycaeus spp. 16.67 2.49 4.05 1.85 42.24 7.25 1.30 6.96 40.71 7.41 1.89 8.25 54.35 8.36 2.28 11.81
Corycella carinata 1.29 0.07 0.67 0.02 4.42 0.25 1.97 0.21
C. rostrata 4.17 0.46 4.88 0.38 15.95 0.61 1.48 0.63 23.01 1.74 2.56 2.15 47.83 7.02 0.69 7.52
Corycella sp. 4.74 0.19 0.54 0.07 Unidentified Cyclopoida 1.39 0.05 1.05 0.03 0.86 0.02 0.51 0.01 Harpacticoida
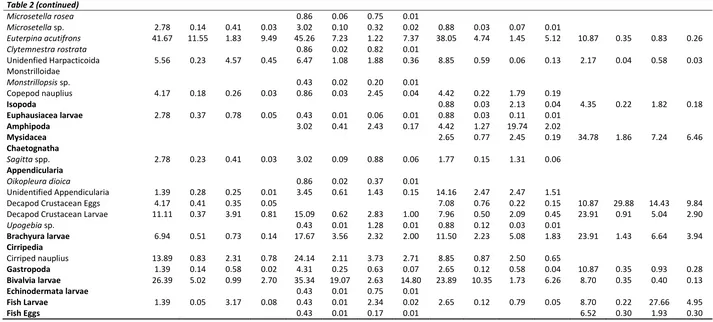
Table 2 (continued)
Microsetella rosea 0.86 0.06 0.75 0.01
Microsetella sp. 2.78 0.14 0.41 0.03 3.02 0.10 0.32 0.02 0.88 0.03 0.07 0.01
Euterpina acutifrons 41.67 11.55 1.83 9.49 45.26 7.23 1.22 7.37 38.05 4.74 1.45 5.12 10.87 0.35 0.83 0.26
Clytemnestra rostrata 0.86 0.02 0.82 0.01
Unidenfied Harpacticoida 5.56 0.23 4.57 0.45 6.47 1.08 1.88 0.36 8.85 0.59 0.06 0.13 2.17 0.04 0.58 0.03 Monstrilloidae
Monstrillopsis sp. 0.43 0.02 0.20 0.01
Copepod nauplius 4.17 0.18 0.26 0.03 0.86 0.03 2.45 0.04 4.42 0.22 1.79 0.19
Isopoda 0.88 0.03 2.13 0.04 4.35 0.22 1.82 0.18
Euphausiacea larvae 2.78 0.37 0.78 0.05 0.43 0.01 0.06 0.01 0.88 0.03 0.11 0.01
Amphipoda 3.02 0.41 2.43 0.17 4.42 1.27 19.74 2.02
Mysidacea 2.65 0.77 2.45 0.19 34.78 1.86 7.24 6.46
Chaetognatha
Sagitta spp. 2.78 0.23 0.41 0.03 3.02 0.09 0.88 0.06 1.77 0.15 1.31 0.06 Appendicularia
Oikopleura dioica 0.86 0.02 0.37 0.01
Unidentified Appendicularia 1.39 0.28 0.25 0.01 3.45 0.61 1.43 0.15 14.16 2.47 2.47 1.51
Decapod Crustacean Eggs 4.17 0.41 0.35 0.05 7.08 0.76 0.22 0.15 10.87 29.88 14.43 9.84
Decapod Crustacean Larvae 11.11 0.37 3.91 0.81 15.09 0.62 2.83 1.00 7.96 0.50 2.09 0.45 23.91 0.91 5.04 2.90
Upogebia sp. 0.43 0.01 1.28 0.01 0.88 0.12 0.03 0.01
Brachyura larvae 6.94 0.51 0.73 0.14 17.67 3.56 2.32 2.00 11.50 2.23 5.08 1.83 23.91 1.43 6.64 3.94
Cirripedia
Cirriped nauplius 13.89 0.83 2.31 0.78 24.14 2.11 3.73 2.71 8.85 0.87 2.50 0.65
Gastropoda 1.39 0.14 0.58 0.02 4.31 0.25 0.63 0.07 2.65 0.12 0.58 0.04 10.87 0.35 0.93 0.28
Bivalvia larvae 26.39 5.02 0.99 2.70 35.34 19.07 2.63 14.80 23.89 10.35 1.73 6.26 8.70 0.35 0.40 0.13
Echinodermata larvae 0.43 0.01 0.75 0.01
Fish Larvae 1.39 0.05 3.17 0.08 0.43 0.01 2.34 0.02 2.65 0.12 0.79 0.05 8.70 0.22 27.66 4.95
Table 3. Morato Index food preference of Engraulis encrasicolus in İzmir Bay
Season Size Group (FL)
Winter Spring Summer Autumn < 8.0cm 8.0-9.9 cm 10-11.9 cm 12.0 cm ≥
(MIP) IRI ≥ 927.18 IRI ≥ 877.72 IRI ≥ 1864.30 IRI ≥ 1066.99 IRI ≥ 893.74 IRI ≥ 998.91 IRI ≥ 911.92 IRI ≥ 1134.76
Copepoda Copepoda Copepoda Copepoda Copepoda Copepoda Copepoda Copepoda
Appendicularia
(SP) IRI > 103.02 IRI > 97.52 IRI > 207.14 IRI > 118.55 IRI > 99.30 IRI > 110.99 IRI > 101.32 IRI > 126.08
Bivalvia Cladocera Mysidacea Cladocera Cladocera Bivalvia Bivalvia Decapoda eggs
Cirripedia nauplius Decapoda eggs Cladocera Decapoda larvae Bivalvia Cirripedia nauplius Mysidacea
Brachyura larvae Decapoda larvae Cladocera Fish larvae
Brachyura larvae
Decapoda larvae
(OP) IRI ≤ 103.02 IRI ≤ 97.52 IRI ≤ 207.14 IRI ≤ 118.55 IRI ≤ 99.30 IRI ≤ 110.99 IRI ≤ 101.32 IRI ≤ 126.08
Brachyura larvae Bivalvia Brachyura larvae Fish larvae Decapoda larvae Brachyura larvae Cladocera Fish eggs Decapoda larvae Mysidacea Bivalvia Bivalvia Cirripedia nauplius Decapoda larvae Amphipoda Gastropoda Cladocera Decapoda larvae Stomatopoda Cirripedia nauplius Brachyura larvae Amphipoda Brachyura larvae Isopoda Other groups Amphipoda Gastropoda Appendicularia Other groups Other groups Appendicularia Ostracoda
Other groups Other groups Other groups Other groups Other groups
size-classes of anchovy. Bivalvia followed the copepods in 8.0-9.9 cm and 10.0-11.9 cm size classes with 14.80%IRI and 6.26%IRI, respectively (Table 2). However, the importance of the mysidacea, decapoda crustacean eggs and larvae, fish and brachyura larvae were increased in the diets of anchovy specimens bigger than 12 cm (Table 2).
As a result of Morato index values Copepoda were found to be the main important prey group (MIP) in the diet for all seasons and size groups. However, Appendicularia was evaluated in the samecategory with copepods for summer. Secondary prey groups (SP)
were bivalvia, cladocera, decapoda larvae and eggs, brachyura larvae, mysidacea, cirripedia and fish larvae, and it has been found that the importance of their abundance changed by seasons and size groups. In addition, the occurence of the specimens of the groups Amphipoda, Isopoda, Stomatopoda, Gastropoda were rare and evaluated as occasional prey groups (OP) (Table 3).
the highest Bray-Curtis Index values (65.89%), the lowest similarity value was found in summer (62.01%). The similarity index values based on size classes were found higher than the similarities on the basis of seasons. Bray-Curtis index values varied between 56.38% and 74.86% according to size classes. While size classes II and III formed a group, the size class IV showed lowest similarity between other size classes (Figure 3).
Discussion
In this study, the diet of the European anchovy in Izmir Bay (the eastern Aegean Sea) were examined owing to the seasons and the size groups. Anchovy entirely fed on zooplankton and mainly pelagic copepods. These findings (Table 4) are in line with many other studies conducted in the Mediterranean (Tudela & Palomera, 1995; 1997; Plounevez & Champalbert, 2000; Uçkun et al., 2003; Bacha & Amara,
2009; Raab et al. 2011; Costalago et al., 2014). However, Bulgakova (1993) in Black Sea, Borme et al. (2009) in the northern Adriatic Sea, Schaber et al. (2010) in the Baltic Sea, Gushchin and Corten, (2015) in the waters of Mauritania were also determined phytoplankton together with the zooplankton in the anchovy’s diet. Bulgakova (1993) and Schaber et al. (2010) interpreted that copepods were observed in very low abundances in their plankton samplings in the studied regions. Unlike present and other studies in the Mediterranean Sea, Karachle and Stergiou (2014) found brachyura and euphausiaceae larvae as the most important prey groups for E. encrasicolus in the North Aegean Sea because they evaluated only the wet weight of stomach contents.
By considering the results of the Morato index values of this study, the European anchovy is a zooplanktivorous species. Similarly, Bulgakova (1993) found that the species is omnivorous and it is tended to prefer zooplankton (mainlycopepoda and cladocera). Table 4. Important prey items of Engraulis encrasicolus from different localities
Study area LR (cm) LT Main Prey Items Method References
NW Black Sea
7.7-13.0 Phytoplankton, Cladocera, Copepoda
N, W, VC Bulgakova (1993)
6.2-12.5 Copepoda
8.7-13.0 Mysidacea, fish larvae 7.1-12.8 Fish larvae, Copepoda
Catalan Sea NA Copepoda, Mollusca RA Tudela & Palomera (1995, 1997)
Gulf of Lions NA TL Copepoda, Cladocera, Crustacea, Appendicularia, Mollusca
F, W, VC, IP
Plouvenez & Champalbert (2000) İzmir Bay (Aegean
Sea) 6.9-14.0 FL Copepoda N, W, F, IRI Uçkun et al. (2003)
İzmir Bay (Aegean
Sea) 7.2-16.3 FL Copepoda N, F Ünlüoğlu & Benli (2004)
N. Adriatic Sea 3.0-9.0 TL Copepoda, Bivalvia larvae, Amphipoda
Bacillariophyceae N, W, F, IRI Borme et al. (2009)
Algerian Coasts NA TL Copepoda N, F Bacha & Amara (2009)
Western Baltic Sea 12.0-16.0 TL
Diatoms, Cumacea, Copepoda,
Cirripedia larvae, Amphipoda N, F, V Schaber et al. (2010)
North and Baltic Sea
8.0-19.0
TL
Malacostraca, Copepoda
F, W Raab et al. (2011)
< 12.0 Copepoda
12.0-14.0 Copepoda
15.0-16.0 Copepoda
17.0-19.0 Malacostraca
Gulf of Lions 4.0-10.2 SL Copepoda, Cladocera, Appendicularia N, W, F Costalago et al. (2014) N. Aegean Sea 6.7-16.2 TL Brachyura, Euphasiacea N, W, VC Karachle & Stergiou (2014)
Waters of Mauritania 7.4-11.0 TL Copepoda, Phytoplankton F, W Gushchin & Corten (2015)
İzmir Bay (Aegean Sea)
< 8.0
FL
Copepoda, Cladocera, Bivalvia
N, W, F, IRI This study (2017) 8.0-9.9 Copepoda, Bivalvia, Cirriped nauplius
10-11.9 Copepoda, Bivalvia
≥12.0 Copepoda, Decapod eggs and larvae, Mysidacea
Stergiou & Karpouzi (2002), e also reported the species is omnivorous with the preference of zooplankton.
In our study, pelagic copepods (especially small-sized E. acutifrons and O. media) were the predominant prey group in the diet of anchovy. However, the frequency of occurrence (F%) and IRI% of the bigger prey groups than copepods (such as mysids, decapods, fish and brachyuran larvae) increased with the fish growth (in the stomachs of bigger fishes than 12.0 cm). On the contrary, F% of small sized copepods (E. acutifrons, O. media) decreased with the fish growth. Bulgakova (1993) in the Black Sea, Plounevez and Champalbert (2000) in the Lion Bay, observed that the size of the prey increased in accordance with the size of the anchovy and similarly percentage weight and F% values of the small sized prey groups were decreased.
Borme et al. (2009) stated that although small-sized copepod species constituted an important part of the food of both juvenile and adult anchovies, there was no relationship between the size of the fish and the size of the prey items in the northern Adriatic Sea.
The Oncaea species were very common in all seasons in present study. It has also been emphasized in previous studies that Oncaea species have a crucial role in the feeding of anchovy (Tudela & Palomera, 1997; Bacha & Amara, 2009; Borme et al., 2009).
Increasing in the size of the prey organisms with the fish growth indicated that the anchovy feeds in two different ways. Small sized anchovy individuals filter small sized prey groups (like copepods O. media, E. acutifrons), cladocera, bivalvia, cirripedia larvae, appendicularia) whereas large sized individuals both filter and feed by biting the large sized prey groups (like copepods C. armata, C. typicus, T. stylifera and fish larvae, decapoda larvae, mysidacea). Plounevez and Champalbert (2000), in their study in the Lion Bay, stated that the presence of large sized prey groups such as C. armata in the stomach of the anchovies with a size larger than 13 cm was as a result of predation. This result supportsto our findings.
According to Bulgakova (1996), the size of the food is a criterion for the feeding of the species, and the anchovy shifts from feeding by filtering to feeding by biting with the abundance of prey organisms in the environment. Costalago et al. (2014) have reported that juvenile anchovies (40-110 mm) prefer to feed by biting rather than feeding by filtering. This result contradicts with the results that we have determined. It was indicated in the present study that the individuals bigger than 12 cm tend to prefer the bigger preys.
In the present study the importance of Appendicularia in the european anchovy diet could not be ignored (Table 1). Similarly, Costalago et al. (2014) observed the prey group in the juvenile anchovies stomachs in terms of number in winter but not other seasons in the Gulf of Lions. The authors explained the
condition because of the slightly more energetic food structure and lower swimming capacities of the group compared with copepods. In contrast, Borme et al. (2009) indicated that, although appendicularians were found to be very abundant in the environment, they were not chosen by anchovy and never found in the stomachs in the Adriatic Sea. Differences between the studies could be accepted as unfamilar for a species which use filter feeding as one of the feeding mechanism in its life. In addition to that, the importance of the appendicularians were subjected in Engraulis anchoita in the Argentine Sea (Capitanio, Pajaro & Graciela; 1997) and the authors especially indicated that all the appendicularias in the stomachs of anchovy were free swimming adult forms which leaved their gelatinous houses. They also informed that the spawning of appendicularians could be triggered by slight turbulances. So we could imagine that the same water movements in İzmir Bay could resulted in the increase of appendicularians in İzmir Bay.
The diet of anchovy consists of wide variety of zooplanktonic organisms. While the copepods were predominant, some organisms such as Amphipoda, Isopoda, Stomatopoda, Gastropoda and Siphonophora were consumed rarely. In zooplankton studies conducted in the different regions of the Aegean Sea reported that copepods were more dominant than other zooplanktonic groups (Moraitou-Apostolopoulou, 1972; Moraitou-Apostolopoulou, 1974; Matsakis et al., 1978; Benli, Tarkan & Sever, 2001; Aker 2002; Sever, 2009).
Aker (2002) reported that C. typicus, O. media, A. clausi, T. stylifera, and C. typicus were predominant in all seasons in the Aegean Sea. According to the season, the most predominant copepod species found in our study were O. media, O. mediterranea, C. rostrata, A. clausi, C. typicus, T. stylifera, M. norvegica and E. acutifrons.Copepods were similarly predominant in the zooplankton studies conducted in the Izmir Bay (Tubitak, 2011). Otherwise, all prey organisms encountered in the stomachs of the anchovy were reported as characteristic species for the distribution depth ranges of the anchovy (Aker, 2002; Sever, 2009; Scotto di Carlo, Ianora, Fresi, & Hure, 1984; Weikert and Trinkaus, 1990).
coastal lagoon characteristics which includes both freshwater and marine zooplankton and the sampling was only conducted in autumn. In the same study the authors found that Penilia avirostris and Evadne tergestina constitued the main species of cladocerans. These results in accordance with the anchovy diet in İzmir Bay, because our results show that P. avirostris was the main cladoceran in the overall diet of anchovy and especially the increase of the stomach number including P. avirostris in autumn very noticable (F%=38.14). Beside that, in the another study Aker and Özel (2006) indicated that copepods were the main zooplanktonic group for all seasons in the area and it is followed by cladocerans and even in some stations they were represented first place except winter. We also observed a winter decrease of the cladocerans in the anchovy diet and this could reinforce the idea that the diet of E. encrasicolus in İzmir Bay is depends on the abundance of zooplanktonic groups.
In conclusion, the study confirms that E. encrasicolus is a zooplanktivorous species and the main preys consist of copepods in all over the year base and size groups and to a lesser extent other zooplanktonic categories in İzmir Bay. There is also necessity of more compherensive studies including the effects of abiotic factors, day-night differences and meanwhile plankton surveys for understanding completely the feeding behaviour of anchovy and the role of the zooplanktonic groups in the food of the species.
References
Aker, V. (2002). Seasonal distribution of planktonic copepods in the Turkish coastal waters of the Middle Aegean Sea. (PhD Thesis). Ege University Graduate School of Natural and Applied Science, 107 pp.
Aker, V., & Özel, İ. (2006). İzmir Körfezi Kladoserlerinde Mevsimsel Dağılım. Ege University Journal of Fisheries and Aquatic Sciences, 23, (Suppl. 1/1), 17-22.
Bacha, M., & Amara, R. (2009). Spatial, temporal and ontogenetic variation in diet of anchovy (Engraulis encrasicolus) on the Algerian coast (SW Mediterranean). Estuarine, Coastal and Shelf Science,
85(2), 257-264. http://dx.doi.org/ 10.1016/j.ecss.2009.08.009
Benli, H.A., Tarkan, A.N., & Sever, T.M. (2001). Comparison of the mesozooplankton composition the Southwestern Black Sea, Sea of Marmara and Eastern Aegean Sea.
Turkish Journal of Marine Science, 7, 163-179.
Bingel, F., & Avsar, D. (1988) Food items of Saurida undosquamis in the Northern Cilician Basin (Eastern Mediterranean). Rapport Commission International pour l'exploration scientifique de la Mer Mediterranee, 31, p. 261.
Borme, D., Tirelli, V., Brandt, S.B., Fonda, Umani S., & Arneri E. (2009). Diet of Engraulis encrasicolus in the northern Adriatic Sea (Mediterranean): ontogenetic changes and feeding selectivity. Marine Ecology Progress Series, 392, 193-209. http://dx.doi.org/10.3354/meps08214 Bulgakova, Yu V. (1992). Intensity of feeding of the Black sea
anchovy, Engraulis encrasicolus, during the spawning
period. Journal of Ichthyology,32 (3), 168-171.
Bulgakova, Yu V. (1993). Daily feeding dynamics of the Black Sea anchovy, Engraulis encrasicholus. Journal of Ichthyology, 33(7), 78-88.
Bulgakova, Yu V. (1996). Feeding in the Black Sea anchovy: Diet composition, feeding behaviour, feeding periodicity and daily rations (Abstract). In The european anchovy and its environment, I. Palomera and P. Rubiés (eds.). Scientia Marina, 60(Suppl.2), 283-284.
Capitanio F.L., Pajaro, M., Esnal, G.B. (1997). Appendicularians (Chordata, Tunicate) in the diet of anchovy (Engraulis anchoita) in the Argentine Sea.
Scientia Marina, 61(1), 9-15.
Chalabi, A., & Ifrene, F. (1992) Le régime alimentaire hivernal de l’espadon Xiphias gladius L. pêche pres des côtes est de L’Algerie. SCRS/92/91 ICCAT 40, 162.
Cihangir, B., Ünlüoğlu, A. 2015. Status of Small Pelagic Fishes in The Aegean Sea. In: The Aegean Sea Marine Biodiversity, Fisheries, Conservation and Governance Perspectives, Edt: Katagan, T., Tokac, A., Besiktepe, S. & Ozturk, B., 978-975-8825-33-2, Türk Deniz Araştırmaları Vakfı, p.303-323.
Cortés, E. (1998). Methods of studying fish feeding: reply.
Canadian Journal of Fisheries and Aquatic Sciences, 55
(12), 2708. http://dx.doi.org/10.1139/f98-159
Costalago, D., Palomera, I., & Tirelli, V. (2014). Seasonal comparison of the diets of juvenile European anchovy
Engraulis encrasicolus and sardine Sardina pilchardus in the Gulf of Lions. Journal of Sea Research,89, 64-72. http://dx.doi.org/10.1016/j.seares.2014.02.008 Froglia, C. (1973) Osservazioni sull’ alimentazione del
merluzzo (Merluccius merluccius L.) del Medio Adriatico. Atti V Congresso Nazionale della Societá Italiana di Biologia Marina5, 327–341.
Giannoulaki, M., Valavanis, V.D., Palialexis, A., Tsagarakis, K., Machias, A., Somarakis, S., & Papaconstantinou, C. (2008). Modelling the presence of anchovy Engraulis encrasicolus in the Aegean Sea during early summer, based on satellite environmental data. Hydrobiologia, 612, 225–240. http://dx.doi.org/10.1007/s10750-008-9498-6
Gushchin, A.V., & Corten, A. (2015). Feeding of pelagic fish in waters of Mauritania: 1. european anchovy Engraulis encrasicolus, european sardine Sardina pilchardus, round sardinella Sardinella aurita, and flat sardinella
Sardinella maderensis. Journal of Ichthyology, 55(1), 54-62. http://dx.doi.org/10.1134/S0032945215010063 Hyslop, E.J. (1980). Stomach content analysis-a rewiew of
methods and their applications. Journal of Fish Biology,
17(4), 411-429. http://dx.doi.org/10.1111/j.1095-8649.1980.tb02775.x
Karachle, P.K., & Stergiou, K.I. (2014). Feeding and ecomorphology of three clupeoids in the N. Aegean Sea. Mediterranean Marine Science, 15(1), 9-26. http://dx.doi.org/10.12681/mms.350
Karachle, P.K., & Stergiou, K.I. (2017). An update on the feeding habits of fish in the Mediterranean.
Mediterranean Marine Science, 18(1): 43-52. http://dx.doi.org/10.12681/mms.1968
Lleonart, J., & Maynou, F. (2003). Fish stock assessment in the Mediterranean: state of the art. Scientia Marina,
67(Suppl.1), 37–49.
Matallanas, J., Casadevall, M., Carrassón, M., Boix, J., & Fernández, V. (1995) The food of Seriola dumerili
Mediterranean). Journal of Marine Biological Association of. the United Kingdom, 75, 257–260. Matsakis, J., Yannopoulos, C., Thessalou, M., Hatzakis, A.,
Malouhou-Grimba, V., Moraitou-Apostolopoulou, M., Mylonas, M., Siokou, J., & Yannopoulos A. (1978). Ecologie marine de la région de l’eubée du nord III évolution du zooplancton dans sept stations. Extrait de Biologia Gallo-Hellenica. VII(1-2), 99-144.
Moraitou-Apostolopoulou, M. (1972). Occurrence and fluctuation of the pelagic copepods of the Aegean Sea with some notes on their ecology. Hellenic Oceanography and Limnology, 11, 325-402.
Moraitou-Apostolopoulou, M. (1974). Caracteres ecologiques des copepodes de la mer Egee. Rapport Commission International pour l'exploration scientifique de la Mer Mediterranee, 22, 1-89.
Morato-Gomes, T. (1995). Ecologia alimentar de Serranus atricauda (Günther, 1874) dos Açores. “Licenciatura”
Thesis, Universidade do Algarve, Faro, Portugal. [In Portuguese.]
Morote, E., Olivar, M.P., Villate, F., & Uriarte, I. (2010). A comparison of anchovy (Engraulis encrasicolus) and sardine (Sardina pilchardus) larvae feeding in the Northwest Mediterranean: influence of prey availability and ontogeny. ICES Journal of Marine Science,67 (5), 897-908. http://dx.doi.org/10.1093/icesjms/fsp302 Özel, İ., & Aker, V. (2004). İzmir Körfezi, Tuzla Önleri
Zooplanktonu. Türk Sucul Yaşam Dergisi, 2(2): 160–167. Palomera, I., Olivar, M.P., Salat, J., Sabatés, A., Coll, M.,
García, A., & Morales-Nin, B. (2007). Small pelagic fish in the NW Mediterranean Sea: An ecological review.
Progress in Oceanography. 74(2-3), 377-396.
http://dx.doi.org/10.1016/j.pocean.2007.04.012 Plounevez, S., & Champalbert, G. (2000). Diet, feeding
behaviour and trophic activity of the anchovy
(Engraulis encrasicolus L.) in the Gulf of Lions
(Mediterranean Sea). Oceanologica Acta, 23 (1), 175-192. http://dx.doi.org/ 10.1016/S0399-1784(00)00120-1
Pinkas, L., Oliphant, M.S., & Iverson, I.L.K. (1971). Food habits of albacore, bluefin tuna and bonito in Californian waters. California Department of Fish and Game's Fish Bulletin, 152, 1–105.
Raab, K., Nagelkerke, L.A.J., Boerée, C., Rijnsdorp, A.D., Temming, A., & Dickey-Collas, M. (2011). Anchovy
Engraulis encrasicolus diet in the North and Baltic Seas.
Journal of Sea Research, 65(1), 131-140. http://dx.doi.org/10.1016/j.seares.2010.09.002 Sanz Brau, A. (1990) Sur la nourriture des jeunes thons rouges
Thunnus thynnus (L. 1758) des côtes du Golfe de Valence. Rapport Commission International pour l'exploration scientifique de la Mer Mediterranee, 32, 274.
Schaber, M., Petereit, C., & Paulsen, M. (2010). Diet composition and feeding of European anchovy
Engraulis encrasicolus in Kiel Bight, Western Baltic Sea.
Journal of Fish Biology,76(7), 1856-1862.
http://dx.doi.org/10.1111/j.1095-8649.2010.02610.x Scotto di Carlo, B., Ianora, A., Fresi, E, & J., Hure, J. (1984).
Vertical zonation patterns for Mediterranean copepods from the surface to 3000 m at a fixed station in the Tyrrhenian Sea. Journal of Plankton Research,6, 1031– 1056. DOI: 10.1093/plankt/6.6.1031
Sever, T.M. (2009). Pelagic copepoda fauna of the Aegean Sea and the distribution of the common species. E.U. Journal of Fisheries and Aquatic Sciences, 26(3), 203-209.
Stergiou, K.I., & Karpouzi, V. (2002). Feeding habits and trophic levels of Mediterranean fish. Reviews in Fish Biology and Fisheries,11(3), 217–254.
http://dx.doi.org/10.1023/A:1020556722822
Tubitak (2011). Türkiye Kıyılarında Kentsel Atıksu Yönetimi: Sıcak Nokta ve Hassas Alanların Yeniden Tanımlanması, Atık Özümseme Kapasitelerinin İzleme-Modelleme Yöntemleriyle Belirlenmesi ve Sürdürülebilir Kentsel Atıksu Yatırım Planının Geliştirilmesi (SINHA). (Project No. 102G124) Ankara.
Tudela, S., & Palomera, I. (1995). Diel feeding intensity and daily ration in the anchovy Engraulis encrasicolus in the NW Mediterranean Sea during spawning period. Marine Ecology Progress Series, 129, 55–61.
http://dx.doi.org/10.3354/meps129055
Tudela S., & Palomera I. (1997). Trophic ecology of the European anchovy Engraulis encrasicolus in the Catalan Sea (Northwest Mediterranean). Marine Ecology Progress Series, 160,121-134.
http://dx.doi.org/10.3354/meps160121
TUIK, 2006-2016. Turkish Statistical Institute Fishery Statistics. Turkish Statistical Institute, Prime Ministry Republic of Turkey.
Uçkun, D., Sever, T.M., & Toğulga, M. (2003). Investigations of the feeding habits of Anchovy (Engraulis encrasicolus L., 1758) in the İzmir Bay. Ege University Journal of Fisheries and Aquatic Sciences, 20(1-2), 121-127. Ünlüoğlu, A., & Benli, H.A. (2004). A study on the diet
compositions of the adults of anchovy (Engraulis encrasicolus Linnaeus, 1758), european pilchard (Sardina pilchardus Walbaum, 1792), and horse mackerel (Trachurus trachurus Linnaeus, 1758) in the İzmir Bay. Turkish Journal of Aquatic Life,3, 202-210. Washington, H.G. (1984). Diversity, biotic and similarity
indices, a review with special reference to aquatic ecosystems. Water Research,18(6), 653-694.