Effect of pipes installation by modified machine for subsurface
drip irrigation system on maize crop yield costs
Hani A. Mansour
1*, Hu Jiandong
2, Sabreen K. Pibars
1,
Bao Hong Feng
2, Liang Changmei
2(1. Water Relations and Field Irrigation Department, Agriculture and Biological Research Division, National Research Centre, El-Dokki, Giza, 12622, Cairo, Egypt;
2. Xilingol Vocational College, Xilinhot City, 026000. Inner Mongolia, China).
Abstract: The machine of pipes installation of subsurface drip irrigation systems was tested and studied at the Abu-Ghalib farms production (private farm), El-Giza Governorate, Egypt, in growing summer season 2017. The goal of this research was to study the technical and economical evaluation of the installation subsurface pipes for drip irrigation system by Manual method (M) as control, Semi-Mechanical method (SM), and Quad-Raw Machine method (QRM) using different lateral spacing. The QRM method of installation is powered by tractor, the SM method consists of three steps: firstly, the drill plow is drilled under the soil using the tractor, then the pipes are extended in the holes by the labors, and the M method of installation is by labors only for all steps for installation subsurface drip irrigation at different lateral spacing (0.6, 1.0, and 1.4 m) on cost analysis for maize crop production. Production costs of corn crop in US Dollar ($), results showed that net profits were higher by using sub-surface drip system with SM method exceeded 10% for the drip surface irrigation system M method. Value of the net income of the economic unit of irrigation water used ($ m-3) was the highest with using drip sub-surface irrigation SM method and QRM method compared to the surface drip system by 50% and 51% under both. Value of the net income from the physical unit of irrigation water used (kg m-3) were increased by 6.6% and 5.2% with subsurface drip irrigation SM method, QRM method relative to surface drip irrigation system QRM. Authors recommend using sub-surface drip irrigation designs (SM method and QRM method) using different lateral spacing machine installation because it had improved the maize yield and stover production, net profit, and the physical income.
Keywords: subsurface, drip, irrigation, semi mechanical, QRM, machine, installation, lateral
Citation: Mansour, H. A., Hu Jiandong, S. K. Pibars, Bao Hong Feng and Liang Changmei. 2019. Effect of pipes installation by modified machine for Subsurface drip irrigation system on maize crop yield costs. Agricultural Engineering International: CIGR Journal, 21(2): 98–107.
1 Introduction
One of the main advantages of the quaternary drip
irrigation system is that its cost for investment is high
when working with the subsurface drip system compared
with other irrigation systems. The calculations depend on
the field area, topography, location of the main source of
Received date: 2018-09-16 Accepted date: 2018-11-29 *Corresponding author: Mansour, H. A., Associate professor, Water Relations and Field Irrigation Department, Agriculture and Biological Research Division, National Research Centre, El-Dokki, Giza, 12622, Cairo, Egypt. Tel: 01068989517. Email: [email protected], [email protected].
water and irrigation system automation. The researchers
estimate the cost of investment for the irrigation system
by taking the net cost with the tax reduction allowed into
consideration based on two tax categories and the current
value of the reductions applied over several years
according to the regulations of the state of Nebrasska,
USA, with a total average cost of $ 2000 and $ 3,200 per
hectare, including installation costs estimated at $ 800 per
hectare.
The costs analysis of drip irrigation systems for maize
crop production in Illinois USA, In order to achieve the
maximum economic feasibility of the drip irrigation
secondly update and develop previous estimates of capital
investments, fixed costs and operating cost for drip closed
circuits of drip irrigation systems for the 2010/2011
summer season production. He found that the analysis
indicated that modified circuits Drip Irrigation Closed
(DIC), Closed with Two Manifolds (CM2) and Closed
with One Manifold (CM1), meanwhile the shorter
Lateral Line Length (LLL), Lateral Line Length 40 m
(LLL1) and Lateral Line Length 60 m (LLL2), where it
achieved the highest value of net profits for revenues, as
well as the net income from irrigation water
economically, and the net income of irrigation water.
Several cost studies of tomato drip irrigation systems
have been installed in Florida, and only one of them has
made it clear that potato yields and profits (Goyal and
Mansour, 2015). Mansour and Aljughaiman (2015)
evaluated the economic feasibility of in-bed surface drip
irrigation on corn production at Kingdom of Saudi
Arabia and compared its cost with subsurface drip
irrigation system.
Drip irrigation has introduced many and many distinct
agricultural irrigation technologies that have contributed
to a great economic development (Mansour and El
Melhem 2015). Many researchers have studied the effects
of irrigation system and irrigation management at
different levels and fertilizers and various plants on net
profit. Estimation of net income in some of the previous
studies, due to the loss in one or more fixed costs such as
the cost of capital and the rent value of land where
irrigation water is provided free of charge to the owners
of farms (Mansour et al. 2015).
Mansour (2006) found that the higher and lower net
profits of 3335 and 1414 pounds were obtained from the
cultivation and production of the grapes under drip and
irrigation systems in the pipes classified on the Nile
(Mansour et al. 2016). In another experiment, Irrigation,
added water levels, irrigation management and varieties
of wild beans where the highest and lowest net income
was 760.7 and 270.5 dollars per hectare respectively.
Pibars and Mansour (2019 and 2016) reported that the
higher and lower value of the net profits of 4521 and 709
dollars per hectare were obtained from the garlic crop
based on irrigation and phosphorus levels and the use of
used fertilizer injectors in another experiment where the
net income obtained from The water unit ranged between
1.22 and 14.14 kg of grain yield for dry beans per m3 of
irrigation water (Mansour et al., 2014) and Dhuyvetter et
al (1995). The highest and lowest value of irrigation
water ranged from 6 to 13.0 and 2.5 to 3.5 pounds per m3
Of the water used in the irrigation process, and it has been
shown that the cost of drip irrigation has been
significantly affected by the feed varieties And the levels
of phosphorus added in the West Kansas area of the
United States of America. El Amami et al. (2001)
reported that good irrigation management and irrigation
scheduling are good champions of the highly positive
economic impacts on the farm and help to avoid major
constraints such as water stress the irrigation system has
weakened.
Explain both Mansour et al. (2015a) and Pibars et al.
(2015) that the energy and availability of the most
important determinants of the cost of irrigation system in
the farm and in return, the profits generated on
investment are significant and be produced by the
purpose to be achieved and the tools that have been used
to achieve the goal and topography of the farm and the
quality of crops and land in the farm and also the area to
be cultivated and irrigated using Irrigation system and
other agricultural equipment.
The objectives of the current study are to determine
the effect of using QRM, SM and M methods for
installation the lateral lines of subsurface drip irrigation
system at different lateral spacing on grain yield, stover
yield, Grain Water Use Efficiency (WUEg), Stover Water
Use Efficiency (WUEs) and cost analysis components for
maize crop production.
2 Materials and methods
A field experiment was conducted through the
summer successful season of 2017 at Abu-Ghalib Farms
Production (Private Farm), El-Giza Governorate, Egypt,
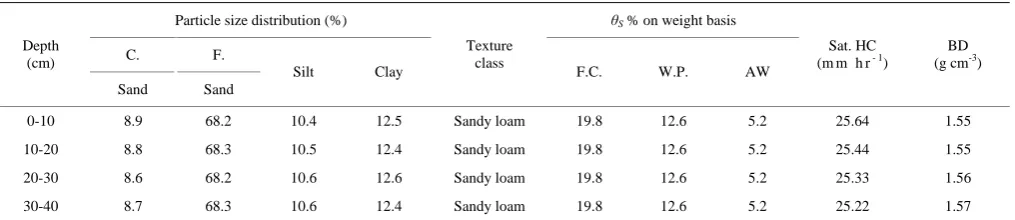
in sandy loam soil as shown in Table 1 to study the
technical and economical evaluation of the installation
subsurface pipes for drip irrigation system by M method
as control, SM, and QRM methods using different lateral
Table 1 Soil mechanical analysis and some physical properties of location*
Particle size distribution (%) θS % on weight basis
C. F. Depth
(cm)
Sand Sand
Silt Clay
Texture class
F.C. W.P. AW
Sat. HC (m m h r- 1)
BD (g cm-3)
0-10 8.9 68.2 10.4 12.5 Sandy loam 19.8 12.6 5.2 25.64 1.55
10-20 8.8 68.3 10.5 12.4 Sandy loam 19.8 12.6 5.2 25.44 1.55
20-30 8.6 68.2 10.6 12.6 Sandy loam 19.8 12.6 5.2 25.33 1.56
30-40 8.7 68.3 10.6 12.4 Sandy loam 19.8 12.6 5.2 25.22 1.57
Note: F.C.: Field capacity, W.P.: Wilting point, AW: Available water, Sat.HC: Saturated hydraulic conductivity (mm hr-1), and BD: Bulck density(g cm-3);
* Particle size distribution has been observed according (Gee and Bauder, 1986) and moisture retention has been observed according (Klute, 1986).
2.1 Irrigation systems components
Surface and sub-surface drip irrigation systems
networks include the following components as shown in
Figures 1 and 2:
(1) Control head: It is located at the water source
supply. It consists of centrifugal pump 4`` /4``, driven by
diesel engine (pump QRM charge of 100 m3 h-1 and 50 m
lift), sand media filter 48`` (two tanks), screen filter 2``
(120 mesh) back flow prevention device, pressure
regulator, pressure gauges, flow-meter, control valves and
chemical injection.
(2) Main line: PVC pipes of 125 mm in diameter
(OD) to convey the water from the source to the main
control points in the field.
(3) Sub-main lines: PVC pipes of 75 mm diameter
(OD) were connected to with the main line through a
control unit consists of a 2`` ball valve and pressure
gauges.
(4) Manifold lines: PVC pipes of 40 mm in diameter
(OD) were connected to the sub main line through control
valves 1.5``.
(5) Emitters: These emitters Built in (GR) dripper
from Polyethylene (PE) tubes 16 mm in diameter (OD)
and 50 m in long (emitter QRM charge of 4 lph at 1.0 bar
operating pressure, 0.3 m spacing between emitters, and
(0.6, 1.0, and 1.4 m) spacing between lateral lines.
Sub-surface drip depths 0.15 and 0.3 m.
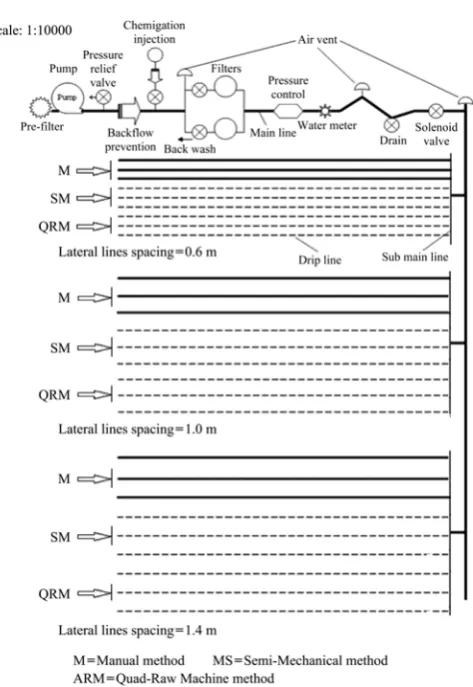
Figures 3, 4 and 5 showed the QRM method, while
Figure 6 showed the comparison between the three
methods of installation sub-surface drip irrigation system.
QRM method of installation is powered by tractor, the
semi-automatic method consists of three steps: firstly, the
drill plow is drilled under the soil using the tractor, then
the pipes are extended in the holes by the labors, and the
M method of installation is by labors only for all steps for
installation subsurface drip irrigation at different lateral
spacing (0.6, 1.0, and 1.4 m) on cost analysis for maize
crop production.
Figure 2 Drip system establishment and installation automated controller surface and subsurface drip irrigation systems in new
field
Figure 3 Drip line location with soil sub-surface by 30 cm
Figure 4 Quad-raw machine
Figure 5 Installing the drip lateral lines using QRM
Figure 6 Experiment’s layout of installation of the subsurface drip irrigation systems by using manual, semi-mechanical and quad
raw machine methods and different lateral lines spacing
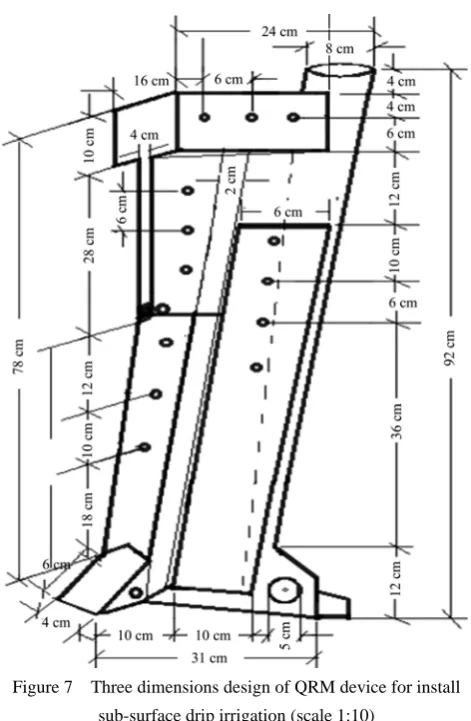
2.2 Technical specifications of QRM
(1) The QRM injection device of the drip pipe
consists of moving parts through which the depth of the
installation can be adjusted. The most important is the
soil slitting weapon, which is free of movement, the cone
of the entry and exit of the drip pipe and the part
responsible for the connection to the kidney structure of
the machine.
(2) The structure of the machine is connected to the
tractor and this part contains the point of clamping jars
and places of installation of the injection device and the
places of installation of rollers. The kidney structure is
controlled so that the injection devices have free
movement so that we can adjust the distance between the
lines according to the type of crop.
(3) Place the suspension of the pipe rollers where the
pipe rollers are suspended.
2.3 Calculations of economic feasibility costs
2.3.1 Total production costs
Total production costs in US Dollar ($) of corn yield
control costs.
A- Irrigation cost
B- Capital costs for automated controller of Surface
Drip Irrigation (SDI) and Sub-surface drip irrigation
systems (SSDI) under studied were computed according
to the market price of 2004 for equipment and installation.
The annual cost (fixed and operating) of different
irrigation systems for grape farms were computed
according to Mansour (2015).
2.3.2 Fixed costs
The annual fixed costs invested in the irrigation
systems were calculated in ($) using the following
formula:
F.C = D + I + T (1)
where, F.C. = Annual fixed cost, $ year-1; D =
Depreciation rate, $ year-1; I = Interest, $ year-1, and
T = Taxes and overhead ratio, $ year-1.
Depreciation cost differs from one system to another,
according to the life span of the different components of
each system. Depreciation can be calculated from the
following equation:
D = (I.C. – Sv)/E (2)
where, I.C. = Initial cost of irrigation system, $; Sv =
Salvage value after depreciation, $, and E = Expectancy
life, year.
The current interest was calculated as follows:
I = (I.C. + Sv) I.R./2 (3)
where, I.R. = Interest rate per year, %.
Taxes and overhead ratios were taken as (1.5%-2.0%)
from the initial costs.
2.3.3 Operating costs
Operating costs were calculated from the following
formula:
O.C. = L.C + E.C + (R&M) (4)
where, O.C. = Annual operating costs, $ year-1; L.C =
Labor costs, $ year-1; E.C = Energy costs, $ year-1, and
R&M = Repair and maintenance costs, $ year-1.
Labor to operate the system and to check the system
components depends on irrigation operating time. This
time would change from system to another according to
irrigation water application rate. Labor cost was estimated
as follows:
L.C = T N P (5)
where, L.C = Annual Labor cost, $ year-1; T = Annual
irrigation time, h year-1; N = Number of labors per ha,
and P = Labor cost, $ h-1.
Energy costs were calculated by using the following
formula:
E.C = Bp T Pr (6)
where, E.C = Energy costs, $ year-1; Bp = Brake power,
kW; T = Annual operating time, h, and Pr = Cost of
electrical power, $ kW-1 h-1.
Repair and maintenance costs were taken as 2%, 3%,
and 0.5% of the initial costs for bubbler, drip, and gated
pipe irrigation system, respectively.
Total annual irrigation costs = fixed costs + operating
costs.
2.3.4 Fertilization costs
Fertilization process of grapevines was carried out
by fertigation system under drip and low-head bubbler
and modified surface irrigation by using gated pipes
irrigation for ammonium sulfate and potassium sulfate
and using the traditional method (top dressing) for
superphosphate. Fertilization cost was calculated as
follows:
Fr = (Wf Pr) + Ac (7)
where, Fr = Fertilization cost, $ ha-1; Wf = Amount of
fertilizers, $ ha-1; Pr = Fertilizers price, $ kg-1, and Ac =
Application cost of fertilizers, $ ha-1.
2.3.5 Pest control cost
Pest control carried out by using the sprayer and pest
control cost was calculated as follows:
Pc = (Wp P) + Ac (8)
where, Pc = Pest control cost, $ ha-1; Wp = Amount of
pesticides, kg ha-1; P = Pesticides price, $ kg-1, and Ac =
Application cost of pesticides, $ ha-1.
2.3.6 Weed control cost
Weed control carried out manually by using labors
and weed control cost was calculated as follows:
Wc = N L T (9)
where, Wc = Weed control cost, $ ha-1; N = Number of
labors per ha; L = Labor cost, $ h-1, and T = Time used,
h ha-1.
2.3.7 Net profit
The economical profit of grape crop under different
irrigation systems was calculated by using the following
formula (Mansour, 2015).
where, P = Net profit, $ ha-1; Yt = Total yield, ton ha-1;
D = Yield price, $ ton-1, and Ct = Total production costs,
$ ha-1.
2.3.8 Cost of production unit
It was calculated as follows:
1 1
1 Total cost ($ ha ) Cost of production unit ($ kg )
Total yield (kg ha )
− −
−
=
(11)
2.4 Statistical analysis
The data were subjected to analysis of variance
(ANOVA) using Costat software. The experiments design
was split plot with three replicates, The main plots
involved the drip irrigation subsurface installing method
treatment levels (M method, SM method and QRM
method) and the sub plots involved the lateral lines
spacing treatment levels (0.6, 1.0 and 1.4 m), according to
Van Ginkel and Kroonenberg (2014).
3 Results and discussion
3.1 The operation process are as follows
(1) Lubricated well modified machine, especially
pulleys whether inside the injection device or rollers.
(2) The injection device is placed at the appropriate
depth of the crop and also the distance between the lines
on the kidney structure by pinning the end of the drip
pipe at the beginning of the lines.
(3) The machine is connected with the tractor.
(4) The pipe ends shall be fixed at the beginning of
the lines by passing from the cone to the injection device
and fixed with strong iron or wooden wedges at the
beginning of the sub-lines (points of contact with the
sub-lines or distributers) or their ends.
(5) At the beginning of operation, the depth of the
irrigation pipe installation device is adjusted by the
tractor driver, and installation is done at slow speeds.
(6) To avoid any cutting with hoses, it should be
noted that all pulleys are in rotation with the tractor.
(7) We find that the pipes have been installed and
were destroyed by the machine in the first four lines.
(8) Repeat the previous work for the whole set of four
lines and so on until the completion of the whole field.
3.2 This QRM mechanism is characterized by the
following
(1) The structure of this modified machine should be
regular as the pipes should be at a constant depth under
the surface of the soil.
(2) Provide the effort (where you do not need the
workers during the operation).
(3) Do not need many costs (renting the tractor to be
attached).
(4) The pipes can be installed at different depths and
different planting distances suitable for the crop.
(5) Save time where you need a short time to
complete this process.
(6) Ease of work, whether for small or large land
holdings.
(7) Encourage the use of sub-surface drip irrigation
system, which in turn helps to provide water.
(8) The use of sub-surface drip irrigation preserves
the tubes and increases their lifetime for longer.
Three-dimensional geometry of QRM install device in
Figure 7 as follows.
Figure 7 Three dimensions design of QRM device for install sub-surface drip irrigation (scale 1:10)
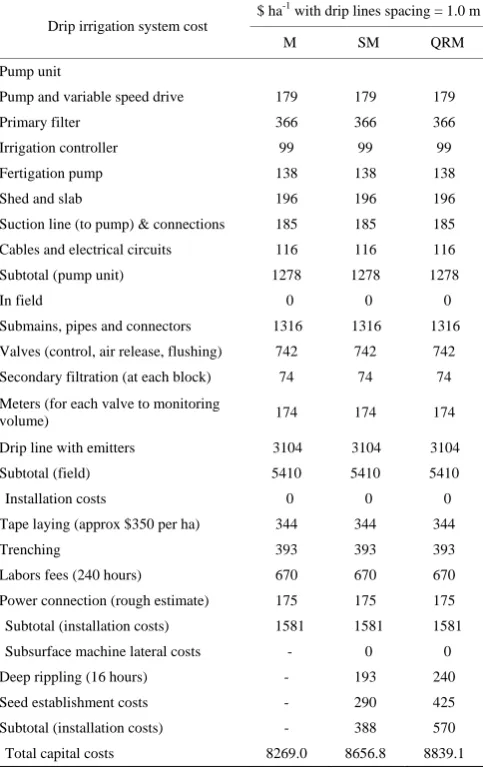
Table 2 showed the capital cost in US Dollar ($) of
the technical and economical evaluation of the
installation subsurface pipes for drip irrigation system by
spacing. Total capital costs recorded the lowest value
with QRM (70.2 $ ha-1).
Table 2 Capital costs of drip irrigation subsurface by M, SM and QRM method at 1.0 m spacing (According to the market
price of 2018)
$ ha-1 with drip lines spacing = 1.0 m
Drip irrigation system cost
M SM QRM
Pump unit
Pump and variable speed drive 179 179 179
Primary filter 366 366 366
Irrigation controller 99 99 99
Fertigation pump 138 138 138
Shed and slab 196 196 196
Suction line (to pump) & connections 185 185 185
Cables and electrical circuits 116 116 116
Subtotal (pump unit) 1278 1278 1278
In field 0 0 0
Submains, pipes and connectors 1316 1316 1316
Valves (control, air release, flushing) 742 742 742
Secondary filtration (at each block) 74 74 74
Meters (for each valve to monitoring
volume) 174 174 174
Drip line with emitters 3104 3104 3104
Subtotal (field) 5410 5410 5410
Installation costs 0 0 0
Tape laying (approx $350 per ha) 344 344 344
Trenching 393 393 393
Labors fees (240 hours) 670 670 670
Power connection (rough estimate) 175 175 175
Subtotal (installation costs) 1581 1581 1581
Subsurface machine lateral costs - 0 0
Deep rippling (16 hours) - 193 240
Seed establishment costs - 290 425
Subtotal (installation costs) - 388 570
Total capital costs 8269.0 8656.8 8839.1
Followed by M, total capital costs recorded (8656.8
$ ha-1), and the highest values recorded (8839.1 $ ha-1)
with SM. The highest installation costs were due to
Manual (M) and Semi Mechanical (SM) but the lowest
one due to using installation modified machine
Quad-Raw Machine Method (QRM) for installing
subsurface drip irrigation system. It was obvious that the
capital costs increased with increasing the depth of lateral
line lengths (LLS). This might be due to the extra work of
quad row installation machine of lateral lines tubes used.
The total cost of all agricultural operations is a major
input to farm capital, either capital cost and annual cost
(fixed costs and operating costs) for different drip
irrigation systems of Quad-Raw Machine Method (QRM):
M, SM and full mechanical method by QRM and LLS:
(0.6, 1.0; 1.4 m) on the analysis of costs for corn crop
production ( the total cost, the total revenue and both of
physical and money incomes per unit which used from
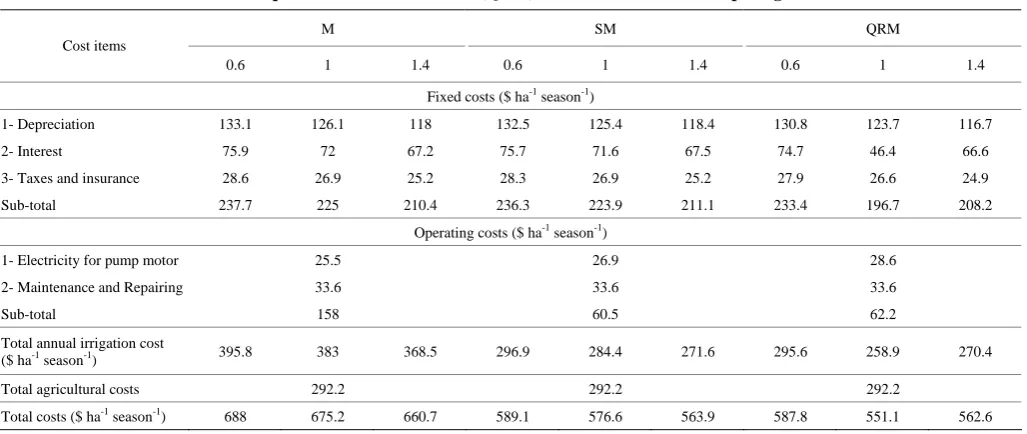
the irrigation water) were given in Tables 2; 3 and 4. In
Table 2, relative to the total costs, the fixed ones
accounted to (34.6%, 33.3% and 31.9%), (40.1%, 38.8%
and 37.4%) and (39.7%, 35.7% and 37.0%) under M, SM,
QRM, 0.6, 1.0 and 1.4 m, respectively. On the other hand,
the operation costs reached: (23.0%, 23.4% and 23.9%),
(10.3%, 10.5% and 10.7%) and (10.6%, 11.3% and
11.1%), total ones in same the ranked mentioned before.
Table 3 shown the grain yield, the stover yield, net profit
and both of physical and the money incomes from the
unit of irrigation water used. The obtained values of these
parameters were: (12880, 12231 and 12028 kg ha-1),
(12619, 12011 and 11867 kg ha-1), (12024, 11030 and
10426 kg ha-1), (8384, 8250 and 8132 kg ha-1), (8322,
8195 and 8092 kg ha-1) and (8271, 8102 and 8079 kg ha-1),
(0.13, 0.12 and 0.12 kg m-3), (0.13, 0.12 and 0.12 kg m-3),
(0.13, 0.11 and 0.10 kg m-3), (2.2, 2.1 and 2.0 $US m-3),
(2.2, 2.1 and 2.1 $US m-3) and (2.1, 2.0 and 1.9 $US m-3)
in the same sequence under (M, SM and QRM) and (6.0,
1.0 and 1.4 m), respectively. These data agreed with
ASAE (1975), Doorenbos and Pruitt (1977), Zartman et
al. (1992), Neibling and Brooks (1995), DeTar et al.
(1996), Fabeiro et al. (2001), Mansour and Aljughaiman
(2015), Mansour et al. (2015a, 2015b), Mansour et al.
(2016a) and Samir et al. (2019).
Table 4 shown that the influence of both Drip
Irrigation Circuits, (DIC) and Lateral Line Length, (LLL)
used of the total costs ($/fed/season); the total revenue
($/fed/season); the physical income (kg/m3) and the
money incomes ($/m3). Concerning the effect of (DIC) on
the parameters under studying, the (DIC) which used
could put in the following arrangements: (M>SM>
QRM), (M>SM>QRM), (M>SM >QRM), (M>SM>
QRM), the same order. Whereas, the difference was
significant in the total cost and income between the M
and SM types on the one hand and the QRM method on
the other hand at 5%. The differences were significant in
the total profit from irrigation units and used by the QRM
method at 5% The effects of LLS on the traits studied
were all possible, with the following ascending order
possible 0.6<1.0<1.4 except the physical income,
differences in the data on hand between LLS were highly
significant at 5% level except among 1.0 and 1.4 m, in
case of physical incomes.
The influence of interactions among QRM x LLS
were obtained in the Table 4, maximum and minimum
values of total costs; total revenue; the physical incomes
and money incomes by the irrigation water unit which
used were obtained in the next interactions: (M X 0.6;
QRM X 1.0), (M X 0.6; QRM X 1.4), (M X 0.6; QRM X
1.4) and (M X 0.6; QRM X 1.4), respectively. These data
agreed with Zartman et al. (1992), Neibling and Brooks
(1995), Mansour and Aljughaiman (2015), Mansour et al.
(2015a, 2015b), and Mansour et al. (2016a, 2019).
Table 3 Fixed and operating costs of drip irrigation subsurface installed by manual method (M), semi-mechanical method (SM) and quad-raw machine method (QRM) at different lateral lines spacing.
M SM QRM
Cost items
0.6 1 1.4 0.6 1 1.4 0.6 1 1.4
Fixed costs ($ ha-1 season-1)
1- Depreciation 133.1 126.1 118 132.5 125.4 118.4 130.8 123.7 116.7
2- Interest 75.9 72 67.2 75.7 71.6 67.5 74.7 46.4 66.6
3- Taxes and insurance 28.6 26.9 25.2 28.3 26.9 25.2 27.9 26.6 24.9
Sub-total 237.7 225 210.4 236.3 223.9 211.1 233.4 196.7 208.2
Operating costs ($ ha-1 season-1)
1- Electricity for pump motor 25.5 26.9 28.6
2- Maintenance and Repairing 33.6 33.6 33.6
Sub-total 158 60.5 62.2
Total annual irrigation cost
($ ha-1 season-1) 395.8 383 368.5 296.9 284.4 271.6 295.6 258.9 270.4
Total agricultural costs 292.2 292.2 292.2
Total costs ($ ha-1 season-1) 688 675.2 660.7 589.1 576.6 563.9 587.8 551.1 562.6
Note: M: manual method, SM: quad-raw machine method, and QRM: quad-raw machine method.
Table 4 Impact of drip irrigation subsurface installed by manual method (M), semi-mechanical method (SM) and quad-raw machine method (QRM) at different lateral lines spacing on maize grain and stover yield costs
Cost item M SM QRM
Lateral lines spacing (m) 0.6 1.0 1.4 0.6 1.0 1.4 0.6 1 1.4
Grain (kg ha-1) 12024 11030 10426 12880 12231 12028 12619 12011 11867
Yield
Stover (kg ha-1) 8271 8102 8079 8384 8250 8132 8322 8195 8092
Grain 1699.9 1559.5 1474.4 1821.5 1729.6 1700.9 1784.9 1698.9 1678.1
Price ($ ha-1)
Stover 367.9 360.9 360 372.8 366.9 361.9 369.8 364.9 360
Total revenue ($ ha-1 season-1) 2068.8 2068.8 1920.4 1833.4 2194.3 2096.4 2062.8 2154.8 2062.8
Physical net income (kg m-3) 37.38 37.38 35.244 34.176 39.16 37.736 37.202 38.626 37.202
Net profit ($ ha-1 season-1) 1181 1481 1369.3 1270.8 1506.4 1421.2 1402.1 1565.7 1486.2
Net income ($ m-3) 128.6 128.6 108.8 9.9 128.6 118.7 118.7 128.6 118.7
Note: Water requirements of QRM, M and SM = 9663.13 m3 ha-1 season-1 & ha = 10000 m2, M: manual method, SM: quad-raw machine method, and QRM: quad-raw
machine method.
The results obtained can be explained by the direct
effects of the modified QRM system on the studied
characteristics. Their effects were studied on the most
important hydraulic characteristics of the drip irrigation
system on the flow. Examples of the QRM system
shipments which also emit the costs of charging,
operating pressure, friction losses and speeds the positive
effects of the QRM system have led to regularity of water
and fertilizer along the sub-drip lines. This has greatly
improved the characteristics of the irrigation network,
resulting in an increase in the yield of the corn crop
Resulting in an increase in income and net annual profits
from the use of the irrigation water unit that was used. At
the same time, the effect of both DIC and LLL on the
studied characteristics was positive through the study of
data agreed with Abd-Elmabod et al. (2019), Zartman et
al. (1992), Neibling and Brooks (1995), Simonne et al.
(2002), Tayel et al. (2012), Pibars and Mansour (2015),
Tayel et al. (2015, 2018, 2019), Pibars and Mansour (2016;
2019), Mansour et al. (2016b; 2019), Ibrahim et al. (2018).
4 Conclusion
It could be concluded that: grain and stover yield
(kg ha-1), LIS and QRM used could be ranked in the
following ascending and descending orders: M>SM>
QRM and 0.6<1.0<1.4 m, respectively for studied
parameters. The effect of interaction LIS X QRM on
yield parameters mentioned above was significant at the
5% level with few exceptions. The highest values of grain
and stover yield (kg ha-1) were (12880 and 8384 kg ha-1)
and the lowest ones were (10426 kg ha-1 and 8079 kg ha-1)
could be seen in the interactions: QRM with 1.4 m line
width and M with 0.6 m line width, respectively.
The net profits in US Dollar ($), were higher by using
quad-raw machine (QRM) exceeded 10% for the
semi-mechanical method (SM). Value of the net income
of the economic unit of irrigation water used ($ m-3) was
the highest with manual method (M) and SM method
compared to QRM method by 50% and 51% under both.
Value of the net income from the physical unit of
irrigation water used (kg m-3) were increased by 6.6% and
5.2% with manual method (M) and semi-mechanical (SM)
method relative to the quad raw machine (QRM).
From the above mentioned, we recommend to
- Using the quad raw machine for installation the
sub-surface drip irrigation designs at different lateral lines,
because this installation machine had improved the maize
yield and Stover production, net profit, the physical
income and water price.
- Utilizing this machine and its operation time is
exploited because what is done in 3-4 working days with
workers and simple machines can be allowed in a few
hours using this machine.
- Exploiting the workers' effort in other works that
require the presence of workers and cannot be dispensed
with in the farm.
- Exploiting the large costs of workers' wages and
providing them for other important purposes such as
reclamation of new lands.
Acknowledgment
The authors would like to thank to the National
Research Centre, EGYPT, Talented Young Scientist
Program (Egypt-18-050), “Grassland Talents” project,
Inner Mongolia (2016) 40, Xilingol Vocational College,
CHINA and for the support and fund for complete the
processing and publishing this great research work.
References
Abd-Elmabod, S.K.; N. Bakr, M. Muñoz-Rojas, P. Pereira, Z. Zhang, A. Cerdà, A. Jordán, H. A. Mansour, D. De la Rosa, and L. Jones. 2019. Assessment of Soil Suitability for Improvement of Soil Factors and Agricultural Management. Sustainability, 11: 1588.
American Society of Agricultural Engineering, 1975., Agricultural Engineering, Annual Book. ASAE. D 230.2. St. Joseph, Michigan,
DeTar, W. R., G. T. Browne, C. J. Phene, and B. L. Sanden. 1996. Real-time irrigation scheduling of potato with sprinkler and subsurface drip systems. In Proc. of the International Conf. on Evapotranspiration and Irrigation Scheduling, 812-824. St. Joseph, Michigan, 3-6 November.
Dhuyvetter, K. C., F. R. Lamm, and D. H. Rogers. 1995. Subsurface drip irrigation (SDI) for field corn - an economic analysis. In Proc. of the 5th International Microirrigation Congress, 395–401. Orlando, Florida, 2-6 April.
Doorenbos, J., and W. O. Pruitt. 1977. Crop water requirements. FAO Irrigation and Drainage Paper No. 24. Rome, Italy: FAO. El Amami, H., A. Zairi, L. S. Pereira, T. Machado, A. Slatni, and P.
Rodrigues. 2001. Deficit irrigation of cereals and horticultural crops: economic analysis. Agricultural Engineering International: the CIGR Journal of Scientific Research and Development, 3: Manuscript LW 00 007b.
Fabeiro, C., F. Martin de Santa Olalla, and J. A. de Juan. 2001.Yield and size of deficit irrigated patatoes. Agricultural Water Management, 48(3): 255–266.
Gee, G. W., and J. W. Bauder. 1986. Particle size analysis. In Methods of Soil Analysis, Part 1. Physical and Mineralogical Methods, ed. A. Klute, ch. 15, 383–411. Madison, WI: ASA and SSSA.
Goyal, M. R., and H. A. Mansour. 2015. Closed Circuit Trickle Irrigation Design: Theory and Applications. Oakville, Canada: Apple Academic Press, Inc.
Ibrahim, A., A. Csúr-Varga, M.Jolánkai, H. A. Mansour, and A. Hamed. 2018. Monitoring some quality attributes of different wheat varieties by infrared technology. Agricultural Engineering International: CIGR Journal, 20(1): 201–210. Klute, A., and C. Dirksen. 1986. Hydraulic conductivity and
Mansour H. A., S. K. Abd-Elmabod and B. A. Engel. 2019.
Adaptation of modeling to the irrigation system and water management for corn growth and yield. Plant Archives Vol. 19, Supplement 1, pp. 644–651.
Mansour, H. A. 2006. The response of grapefruits to application of water and fertilizers under different localized irrigation systems. M.S. thesis, Faculty of Agriculture, Agric., Ain Shams University, Egypt.
Mansour, H. A. A. 2015. Design considerations for closed circuit design of drip irrigation system. In Closed Circuit Trickle Irrigation Design: Theory and Applications, (Book Chapter), pp.61–133.
Mansour, H. A. A., and A. S. Aljughaiman. 2015. Water and fertilizer use efficiencies for drip irrigated corn: Kingdom of Saudi Arabia. In Closed Circuit Trickle Irrigation Design: Theory and Applications, eds. M. R. Goyal and H. A. A. Mansour, ch. 10, 233–250. Oakville, Canada: Apple Academic Press, Inc.
Mansour, H. A. A., and Y. El-Melhem. 2015. Performance of drip irrigated yellow corn: Kingdom of Saudi Arabia. In Closed Circuit Trickle Irrigation Design: Theory and Applications, eds. M. R. Goyal and H. A. A. Mansour, ch. 9, 219–232. Oakville, Canada: Apple Academic Press, Inc.
Mansour, H. A., M. Abd El-Hady, E. I. Eldardiry, and V. F, Bralts. 2015a. Performance of automatic control different localized irrigation systems and lateral lengths for: emitters clogging and maize (Zea mays L.) growth and yield. International Journal of GEOMATE, 9(2): 1545–1552.
Mansour, H. A., M. Abd El-Hady, V. F. Bralts, and B. A. Engel. 2016a. Performance automation controller of drip irrigation system and saline water for wheat yield and water productivity in Egypt. Journal of Irrigation and Drainage Engineering, 142(10): 05016005.
Mansour, H. A., S. K. Pibars, and V. F. Bralts. 2015b.The hydraulic evaluation of MTI and DIS as a localized irrigation system and treated agricultural wastewater for potato growth and water productivity. International Journal of ChemTech Research, 8(12): 142–150.
Mansour, H. A., S. K. Pibars, M. Abd El-Hady, and E. I. Eldardiry. 2014. Effect of water management by drip irrigation automation controller system on faba bean production under water deficit. International Journal of GEOMATE, 7(2): 1047–1053.
Mansour, H. A., S. K. Pibars, M. S. Gaballah, and K. A. Mohammed. 2016b. Effect of different nitrogen fertilizer levels, and wheat cultivars on yield and its components under sprinkler irrigation system management in sandy soil.
International Journal of ChemTech Research, 9(9): 1–9.
Mansour, H.A., Saad, A., Ibrahim, A.A.A., El-Hagarey, M.E., 2016c. Management of irrigation system: Quality performance of Egyptian wheat (Book Chapter). Micro Irrigation Management: Technological Advances and Their Applications, Oakville, Canada: Apple Academic Press, pp. 279–293.
Neibling, H., and R. Brooks. 1995. Potato production using subsurface drip irrigation-water and nitrogen management. In Proc. of the 5th International Microirrigation Congress, 656–663. Orlando, Florida, 2-6 April.
Pibars S. K., and H. A. Mansour. 2019. Effect of tillage management practices and humic acid applications on some engineering properties of peanut. Plant Archives, Vol. 19, Supplement 1: 636–643.
Pibars, S. K., and H. A. Mansour. 2015. Evaluate the response of sunflower productivity to modern chemigation systems in new reclaimed lands. International Journal of ChemTech Research, 8(12): 160–169.
Pibars, S. K., and H. A. Mansour. 2016. Evaluation of response sesame water productivity to modern chemigation systems in new reclaimed lands. International Journal of ChemTech Research, 9(9): 10–19.
Pibars, S. K., and H. A. Mansour. 2019. Effect of tillage management practices and humic acid applications on some engineering properties of peanut. Plant Archives Vol. 19, Supplement 1: 636–643.
Pibars, S. K., H. A. Mansour, M. Abd El-Hady, and E. I. Eldardiry. 2015. Evaluation of emitter clogging for drip irrigated snap beans. In Closed Circuit Trickle Irrigation Design: Theory and Applications, eds. M. R. Goyal and H. A. A. Mansour, ch. 13, 273-286. Oakville, Canada: Apple Academic Press, Inc. Samir S. A., A. M. El-Gindy, H. A. Mansour, S. E. Kalil and Y. E.
Arafa. 2019. Performance analysis of pressurized irrigation systems using simulation model technique. Plant Archives, 19, Supplement 1: 721–731.
Simonne, E., N. Ouakrim, and A. Caylor. 2002. Evaluation of an irrigation scheduling model for drip-irrigated corn in southeastern United States. HortScience, 37(1): 104–107. Tayel, M. Y., A. M. El-Gindy, and H. A. Mansour. 2012. Effect of
drip irrigation circuit design and lateral line lengths on: III-dripper and lateral discharge. Journal of Applied Sciences Research, 8(5): 2725-2731.
Tayel, M. Y., S. M. Shaaban, and H. A. Mansour. 2015. Effect of plowing conditions on the tractor wheel slippage and fuel consumption in sandy soil. International Journal of ChemTech Research, 8(12): 151–159.
Tayel, M.Y., S. M. Shaaban, E. A. Eldardiry, andH. A. Mansour. 2018. Wheat yield versus seed bed conditions., Bioscience Research, 15(3): 1943–1951.
Tayel, M.Y.; S. M. Shaaban and H. A. Mansour. 2019. Impact of seedbed preparation condition on aggregates stability, yield, water productivity and fertilizers use efficiency on maize (zea mays). Plant Archives Vol. 19, Supplement 1: 706–710. Van Ginkel, J. R., and P. M. Kroonenberg. 2014. Analysis of
variance of multiply imputed data. Multivariate Behavioral Research, 49(1): 78–91.