Effect of husking and whitening machines on rice Daillman
cultivar
Salih K. Alwan
1,2, Akbar Arabhosseini
1*, Mohammad H. Kianmehr
1, Ali M. Kermani
1(1. Department of Agrotechonlogy, College of Abouraihan, University of Tehran, Tehran, Iran. 2. Department of Agricultural Machinery, University of Al-Qasim Green, Iraq)
Abstract: The effect of husking and whitening machines on rice, Daillman Mazandarani (DM) cultivar was studied based on some technical indicators. Two types of machines (Satake and Yanmar) were tested at three clearances of 0.4, 0.6 and 0.8 mm between cylinders and three ranges of grain moistures of 10%-12%, 12%-14% and 14%-16%. The experiments were carried out in a factorial experiment under complete randomized design with three replications. The results showed that the Satake machine was significantly better than the Yanmar machine in all studied conditions. The results showed a production process of 1.525 and 1.300 t\h, power consumption of 14.972 and 15.601 kW, milling recovery of 69.257% and 68.369%, broken rice of 7.343% and 8.232%, husking efficiency of 83.212% and 81.703% and head rice yield of 68.750% and 66.905% for Satake and Yanmar machines, respectively. The clearance 0.8 was significantly superior to the other two levels of 0.4 and 0.6 mm while the moisture content of grain at range of 10%-12% was significantly superior to the other ranges of 12%-14% and14%-16% in all studied conditions.
Keywords: rice, Daillman Mazandarani cultivar, husking, whitening, moisture content
Citation: Alwan, S. K., A. Arabhosseini, M. H. Kianmeher, and A. M. Kermani. 2016. Effect of husking and whitening machines on rice Daillman cultivar. Agricultural Engineering International: CIGR Journal, 18(4):232-242.
1 Introduction
1A vast majority of people in the world consume rice.
It is the second most important cereal in the world and
provides, together with wheat, a large proportion (95%)
of the total nourishment of the world’s population. It is
the daily food for over 1.5 billion people as it is so
popular and easily digested. Rice is an essential food in
the diet of one third of the world’s population and further
stated rice production and consumption is concentrated in
Asia where more than 90% of the world’s rice is
produced and consumed. The 155 million hectares
planted throughout the world and produce about 596.5
million metric tons of paddy rice per year. Rice, which is
grown under a wide diversity of climates, soils and
Received date: 2016-05-27 Accepted date: 2016-09-19
*Corresponding author: Akbar Arabhosseini, Department of Agrotechnology, College of Abouraihan, University of Tehran, Tehran, Iran. Email: [email protected] and [email protected]
production systems, is subjected to many biotic and
abiotic stresses that vary according to the site.
Consumption per capita and consumer preferences for a
given rice type also vary from region to region. Rice is
now a major staple food for millions of people in Asia.
The removal of bran as the milling duration and
grain moisture content increased in linear reduction of
head kernel yield (Bautita et al., 2002). A high milling
degree means that the milled rice is very white with
relatively light milling. Degree of milling is influenced by
the grain hardness, size, shape, depth of surface ridges,
bran thickness and mill efficiency. It also affects milling
recovery and influences consumer acceptance (Richman
et al., 2006). The compressive load resistance of rice grain
is based on its characteristic of yield strength of which can
be expressed as relationships of the shear strength. Two
similar experiments, both parallel and cross grain positions
were conducted on the rough rice and brown rice to
as lowering the broken rice during the rice mill processes
(Chaitep et al., 2008). The broken grain size which is less
than a quarter of the length of the pill and back are due to
several factors, including the organization of the machine
and grain moisture content during the manufacturing
stage in addition to the mechanical stresses experienced
by the grain harvest in the pre-manufacturing stage (Al
Sharifi, 2010).
Milling is the final step in rice post-harvest
processing, which includes pre-cleaning, husking,
whitening and grading in the rice milling process
(Ohtsubo et al., 2005). Paddy is first thoroughly cleaned
by a paddy cleaner and then the husk is removed by any
of the existing husker. Rubber roll husker is the most
popular machine for husking of paddy in the milling
operation because of its better performance in quality and
quantity in comparison to other kind of huskers. The
performance of a husker is not only governed by the
working parameters of the machine, but also the physical
and morphological characteristics varietal properties of
the paddy. The effect of clearance between the cylinders
has a significant effect on the breakage of rice (Williams et
al., 2002). The more clearance between the cylinders leads
to the percentage of breakage, so it is concluded that the
excess clearance proportion gives less breakage unlike
little clearance is due to an increase in the mechanical
effort, which involved a rice grain during the milling.
The moisture content is a major factor affecting the
milling quality of rice. If the moisture content is too low
or too high, there will be a decline in the milling recovery
and head rice (Patindol, 2000). The highest broken rice
was resulted with moisture level of 14%. It has also been
concluded that the abrasive milling system caused less
broken compared to milling systems include rubber roll
huller and blade whitener as well as system with blade
husker and blade whitener (Mead et al., 2003).
Cereal grains, mainly paddy, wheat, millets and
maize are consumed globally in one form or the other
(Puri et al., 2014). Paddy is a staple food grain of India
and is composed of husk, bran and endosperm. It is
milled to a certain degree before consumption. After
milling, the amount of bran left on milled paddy kernels
is measured and is termed as the degree of milling.
Milling recovery is the percentage of milled paddy (total
paddy yield) obtained from the sample of the paddy after
milling. It can be computed by dividing the weight of the
milled or polished paddy recovered by the weight of the
paddy sample used (Gbabo and Ndagi, 2014). The effect
of different types of crunches and whitening machines on
the paddy grains were tested on two varieties of Amber
33 and Abasiya. The results showed that there is a
significant effect to the machine type as well as the type
of paddy on milling recovery (Al Maamouri and Al
Sharifi, 2008). Chalkiness an opaque white discoloration
of the endosperm reduces the value of head rice kernels
and decreases the ratio of head to broken rice produced
during the milling process (Lobell et al., 2012). The
comparison of milling efficiency factors between
experimental results and simulation results showed that
the differences in hulling efficiency, milling efficiency,
milled rice recovery between experiment and simulation
were 0_10%, 0_7%, 0_4%, respectively. Although the
simulation results were a little lower than experimental
ones, they are close (Chung and Lee, 2003). The
materials produced in the processes of simulation were
compared with those in the experiments.
The main goal of this research is to study the effect of
husking and whitening machines (Satake and Yanmar) on
rice, Daillman Mazandarani (DM) cultivar at different
clearances between cylinders and different ranges of grain
moisture content.
2 Materials and methods
This study was conducted in 2015 to evaluate the
effect of husking and whitening machines (Satake and
Yanmar). The experiments were done at three levels of
grain moisture contents of 10%-12%, 12%-14% and
14%-16% and three clearances between cylinders at levels
of 0.4, 0.6 and 0.8 mm. The Daillman Mazandarani (DM)
were taken by the probe and collected on the form of
heap, which the number heaps were six and each heap
weight was 160 kg, according to the method used by
Alshrifi (2010). The paddy samples were cleaned by
using sieves to remove all foreign matters, broken and
immature grains. Then the random samples which are
taken from each heap in 1000 g weight. The initial
moisture content of paddy grain was determined by oven
drying methods at 103°C for 48 h (Sacilik et al., 2003).
The paddy of DM cultivar was kept in an oven at
temperature of 43°C and monitored carefully for
determining the moisture content of grain at 14%-16%
then the samples were taken and placed in the precision
divider to get a sample of 200 g weight and then the
samples were carefully sealed in polyethylene bags. The
Satake type machine was adjusted on 0.8 mm clearance
between cylinders and linear speed of 4.7 m/s and then
the samples of 200 g were placed in the machine. Then
the sample was taken out of the machine and placed in a
cylindrical insulating device from a Satake type with
operating time which was adjusted to 2 min. The angle of
inclination was 25°insolating the broken and full grain for all sizes. The production process, power consumption,
milling recovery, the breakage proportion, percentage of
head rice and husking efficiency were calculated for each
running test.
2.1 Production process
The production process of the machine was
determined by the efficiency of the machine, which
depends on the type of the machine as well as the size and
moisture content of the grain and also the machine
capacity. This is the quantity of the paddy that passes
through the machine per unit time (Equation 1) (Roy and
Rob, 2007)
Where, P is production process (t/ht/h), W isoutput
weight (g), and T is time (min).
2.2 Power consumption
Power consumption is the power, which is consumed
by a machine to perform a specific job. The power
consumption for this research was calculated by using
Equation 2 (Al Saadi and Al Ayoubi, 2012).
Where, P is power consumed (kW), V isvoltage (V)
and I is the electric current (A), is the angle
between the current and voltage, and is the
efficiency of the motor (%).
2.3 Milling recovery
The milling recovery is the quantity of milled paddy
obtained from a certain quantity of paddy. It is expressed
as a percentage of milled paddy including broken
obtained from paddy, which can be calculated by
Equation 3 (Al saadi and Al Ayoubi, 2012).
Where, is the milling process (%), is the
weight of milling paddy (g), and is the weight of the
sample used (g).
2.4 Breakage proportion
The Equation 4 was used to calculate the percentage
of the head paddy and broken in the separation process of
the broken grain from the head grains (Gbabo and Ndagi,
2014).
Where, is the proportion of breakage paddy
(%), is the weight of breakage grain (g) and is
the weight of paddy sample used (g).
2.5 Percentage of head rice
Percentage of head rice represents the amount of
head grains resulting from the husking process and
broken grains and cracked grain percentage (Equation 5)
Where is the proportion of head grain (%),
is the weight of head grain (g) and is the
weight of paddy sample used (g).
2.6 Husking efficiency
The husking efficiency was determined by using
Equation 6 (Minaei et al., 2007).
Where is the husking efficiency (%), is
the weight of unhusked paddy (g) and is the weight
of paddy sample used (g).
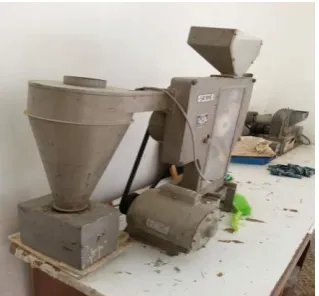
The same method was used with the same cultivar
(DM) to test the Satake type (Figure 1) and Yanmar type
(Figure 2) machines at grain moisture content of
12%-14% and 14%-16% and clearances of 0.4 and 0.6
mm in three replications. The results were analyzed
statistically using the design complete randomized design
(CRD) and the difference among treatments for each
factor was tested according to the LSD test (Alsahoeke
and Creama, 1990).
Figure 1 Machine (type Satake) used for hulling paddy
Figure 2 Machine (type Yanmar) used for hulling paddy
3 Results and discussion
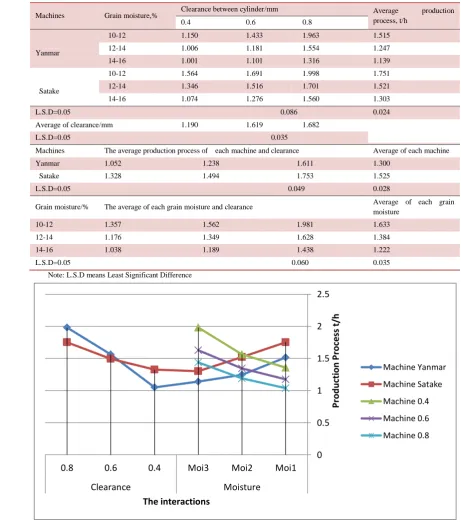
3.1 Production processThe influence of machine type, clearance between
cylinders and grain moisture content on rice production
process t/h is shown in Table 1. The clearance at 0.8 mm
showed the highest production process of 1.682 t/h, while
the lowest production process of 1.190 t/h was for 0.4
mm clearance. These results are consistent with the
results that gained by previous researchers (Corrêa et al.,
2007). It is indicated that the production process of the
Satake machine (1.525 t/h) is significantly better than
Yanmar machine (1.300 t/h). This is due to the use of full
absorption capacity of the Satake machine. These results
are consistent with the results of (Sigh et al., 2005). As
increasing the grain moisture content leads to decrease of
the paddy productivity, the results were 1.663, 1.384 and
1.222 t/h for different levels of moisture content, when
increasing grain moisture, leads to an obstruction process
husk of grain and this because of the adhesion of grain.
These results are consistent with the results of (Patindol,
2000). All the interactions are significantly different and
the best results (1.998 t/h) have come from the overlap
among Satake machine, 10%-12% grain moisture content
and 0.8 mm clearance. The levels of the production
process at different conditions are shown in Figure 3 for
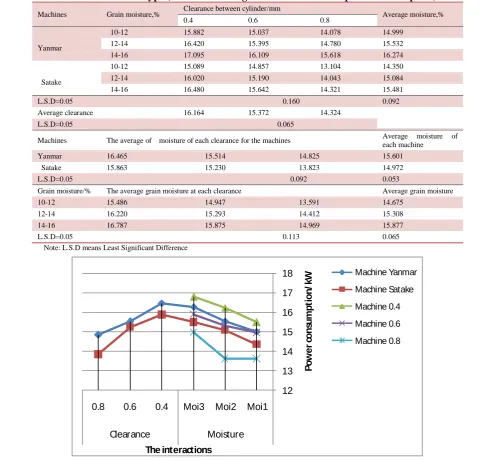
3.2 Power consumption
Table 2 shows the influence of machine type,
clearance and grain moisture on power consumption
(kW). The results indicated that increasing the clearance
between cylinders leads to decrease the power
consumption of the machine, and the results were 16.164,
15.372 and 14.324 kW for different clearances. This is
due to the efficiency of the machine in the work achieved
and less time. The capacity consumed was less when the
clearance among cylinders increased, hence power
consumption increased. These results are consistent with
the results that gained by (Chaitep et al., 2008). As
increasing the grain moisture leads to increase of the
power consumption and the results were 14.675, 15.308
and 15.877 kW at different moisture contents. This is due
to the increased Damocles effort on grains during the
hulling process, hence increased capacity consumed with
increasing moisture content of grain. These results are Table 1 Effect of machine types, clearances and grain moistures on the production process, t/h
Machines Grain moisture,% Clearance between cylinder/mm Average production process, t/h
0.4 0.6 0.8
Yanmar
10-12 1.150 1.433 1.963 1.515
12-14 1.006 1.181 1.554 1.247
14-16 1.001 1.101 1.316 1.139
Satake
10-12 1.564 1.691 1.998 1.751
12-14 1.346 1.516 1.701 1.521
14-16 1.074 1.276 1.560 1.303
L.S.D=0.05 0.086 0.024 Average of clearance/mm 1.190 1.619 1.682
L.S.D=0.05 0.035
Machines The average production process of each machine and clearance Average of each machine
Yanmar 1.052 1.238 1.611 1.300
Satake 1.328 1.494 1.753 1.525
L.S.D=0.05 0.049 0.028
Grain moisture/% The average of each grain moisture and clearance Average of each grain moisture
10-12 1.357 1.562 1.981 1.633
12-14 1.176 1.349 1.628 1.384
14-16 1.038 1.189 1.438 1.222
L.S.D=0.05 0.060 0.035 Note: L.S.D means Least Significant Difference
0 0.5
1
1.5 2 2.5
Moi1 Moi2
Moi3 0.4
0.6 0.8
Moisture Clearance
P
rod
u
ct
ion
P
roc
ess
t/
h
The interactions
Machine Yanmar
Machine Satake
Machine 0.4
Machine 0.6
Machine 0.8
consistent with the results of (Al Saadi and Al Ayoubi,
2012). However, Satake machine was significantly better
than the Yanmar machine, while the results gained from
this process were 15.601 and 14.972 kW for Satake and
Yanmar machines respectively. Because of high quality
in hulling process, less capacity was consumed when
Satake machine was used to compare with Yanmar
machine. These results are consistent with the results of
(Al Maamouri and Al Sharifi, 2008). All the interactions
were significant and the best results 13.104 kW was
achieved for Satake machine, at 10%-12% grain moisture
content and 0.8 mm clearance. The level of the power
consumption at different conditions is shown in Figure 4
for both machine types (Satake and Yanmar).
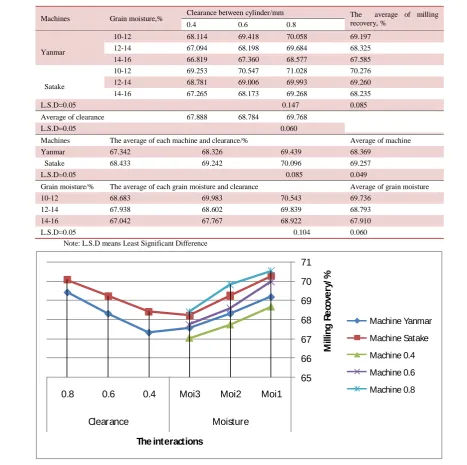
3.3 Milling recovery
Table 3 indicates that increasing the grain moisture
leads to decreasing percentage of milling recovery. The
milling recovery levels were 69.736%, 68.793% and
67.910% at different moisture contents. Higher grain
moisture content leads to difficulty in separation of the
crust from the grains hence decrease in percentage of
milling recovery. These results are consistent with the
results of (NurulAfsar et al., 2001). The Satake machine
(68.369%) was significantly better than the Yanmar Table 2 Effect of machine types, clearances and grain moistures on the power consumption, kW
Machines Grain moisture,% Clearance between cylinder/mm Average moisture,%
0.4 0.6 0.8
Yanmar
10-12 15.882 15.037 14.078 14.999
12-14 16.420 15.395 14.780 15.532
14-16 17.095 16.109 15.618 16.274
Satake
10-12 15.089 14.857 13.104 14.350
12-14 16.020 15.190 14.043 15.084
14-16 16.480 15.642 14.321 15.481
L.S.D=0.05 0.160 0.092
Average clearance 16.164 15.372 14.324
L.S.D=0.05 0.065
Machines The average of moisture of each clearance for the machines Average moisture of each machine
Yanmar 16.465 15.514 14.825 15.601
Satake 15.863 15.230 13.823 14.972
L.S.D=0.05 0.092 0.053
Grain moisture/% The average grain moisture at each clearance Average grain moisture
10-12 15.486 14.947 13.591 14.675
12-14 16.220 15.293 14.412 15.308
14-16 16.787 15.875 14.969 15.877
L.S.D=0.05 0.113 0.065 Note: L.S.D means Least Significant Difference
12 13 14 15 16 17 18
Moi1 Moi2 Moi3 0.4
0.6 0.8
Moisture Clearance
P
o
w
e
r
co
n
su
m
p
ti
o
n
/k
W
The interactions
Machine Yanmar
Machine Satake
Machine 0.4
Machine 0.6
Machine 0.8
machine (69.257%). This is due to the characteristics
design of engineering, which characterized by Satake
machine compared with Yanmar machine. These results
are consistent with the results of (Gbabo and Ndagi, 2014).
In addition, increasing the clearance between cylinders
leads to increase the percentage of milling recovery of the
machine. The results were 67.888%, 68.784% and
69.768% at different clearances. This is due to increased
mechanical energy for separation process of the husking of
grain. The increase in clearance among cylinders, leads to
increase in percentage of milling recovery. These results
are consistent with the results that gained by (Corrêa et al.,
2007). The best result (71.028%) was obtained by Satake
machine at grain moisture content of 10%-12% and 0.8
mm clearance. The milling recovery levels at different
conditions are shown in Figure 5 for both machines.
3.4 Breakage grain
Table 4 shows the percentage of the broken rice of
both machine types at different levels of grain moisture
and clearances between cylinders. The results showed
that the breakage percentage was a significant effect at
different moisture contents. Increasing the moisture
content caused an increase in breakage percentage which
was 7.049%. The highest breakage percentage Table 3 Effect of machine types, clearances and grain moistures on the milling recovery, %.
Machines Grain moisture,% Clearance between cylinder/mm The average of milling recovery, %
0.4 0.6 0.8
Yanmar
10-12 68.114 69.418 70.058 69.197
12-14 67.094 68.198 69.684 68.325
14-16 66.819 67.360 68.577 67.585
Satake
10-12 69.253 70.547 71.028 70.276
12-14 68.781 69.006 69.993 69.260
14-16 67.265 68.173 69.268 68.235
L.S.D=0.05 0.147 0.085 Average of clearance 67.888 68.784 69.768
L.S.D=0.05 0.060
Machines The average of each machine and clearance/% Average of machine
Yanmar 67.342 68.326 69.439 68.369
Satake 68.433 69.242 70.096 69.257
L.S.D=0.05 0.085 0.049
Grain moisture/% The average of each grain moisture and clearance Average of grain moisture
10-12 68.683 69.983 70.543 69.736
12-14 67.938 68.602 69.839 68.793
14-16 67.042 67.767 68.922 67.910
L.S.D=0.05 0.104 0.060 Note: L.S.D means Least Significant Difference
65 66 67 68 69 70 71
Moi1 Moi2
Moi3 0.4
0.6 0.8
Moisture Clearance
M
il
li
n
g
R
e
co
v
e
ry
/
%
The interactions
Machine Yanmar
Machine Satake
Machine 0.4
Machine 0.6
Machine 0.8
accompanied 8.604%. This is due to the low Damocles
effort on grains when the Satake machine is used to
compare with the Yanmar machine because the ease grain
flow, leads to increase the proportion of breakage grain
with increase in moisture content. This is consistent with
the results of (Al Maamouri and Al Sharifi, 2008).
Increasing the clearance between cylinders leads to
decrease the breakage percentage of the machine. The
percentage of the broken grain were 8.789%, 7.773% and
6.801% at different clearances because of the less
collisions of the grain with each other, which facilitates
high flow of grain inside husking chamber when the
clearance between the cylinders increased. The Satake
type machine with less broken grains (7.343%) showed a
significantly better performance than the Yanmar type
machine (8.232%). The reasons are efficiency and type of
machine and their ability to perform the requested
operation. These results are consistent with the results of
(Sigh et al., 2005). The best result (5.560%) was obtained
by Satake type machine at 10%-12% grain moisture and
0.8 mm clearance. The levels of the broken rice
percentage at different conditions are shown in Figure 6
for both machines (Satake and Yanmar).
3.5 Head grain Table 5 shows the influence of the machine type,
clearance and grain moisture on the head rice percentage. Table 4 Effect of machine types, clearances and grain moistures on the percentage of breakage grain, %
Machines Grain moisture,% Clearance between cylinder/mm The average of breakage,%
0.4 0.6 0.8
Yanmar
10-12 8.604 7.791 6.272 7.556
12-14 9.042 8.375 7.107 8.175
14-16 9.968 8.871 8.055 8.964
Satake
10-12 7.928 6.139 5.560 6.543
12-14 8.155 7.328 6.247 7.243
14-16 9.038 8.132 7.562 8.244
L.S.D=0.05 0.196 0.113
Average of clearance 8.789 7.773 6.801
L.S.D=0.05 0.080
Machines The average of each machine and clearance Average of machines
Yanmar 9.204 8.345 7.145 8.232
Satake 8.374 7.200 6.456 7.343
L.S.D=0.05 0.113 0.065
Grain moisture/% The average of each grain moisture and clearance Average of grain moisture
10-12 8.266 6.965 5.916 7.049
12-14 8.599 7.851 6.677 7.709
14-16 9.503 8.502 7.808 8.604
L.S.D=0.05 0.138 0.080 Note: L.S.D means Least Significant Difference
4
6
8
10
Moi1
Moi2
Moi3
0.4
0.6
0.8
Moisture
Clearance
P
e
rc
e
n
ta
g
e
o
f
b
re
a
k
a
g
e
g
ra
in
/%
The interactions
Machine Yanmar
Machine Satake
Machine 0.4
Machine 0.6
Machine 0.8
The results indicate that the Satake type machine with
68.75% is significantly better than the Yanmar type
machine 66.91%. This is due to decrease the broken rice
when Satake type machine is used to compare with a
Yanmar type machine which gives the highest percentage of
breakage hence decrease head rice percentage. These results
are consistent with the results gained by (Bautita et al.,
2002). Increasing the clearance between cylinders leads to
increase the percentage of head rice. The percentage levels
of head rice were 65.343%, 67.832% and 70.256% at
different clearances because the percentage of breakage
increased with the decrease in clearance between cylinders
and negative effect on the ratio of head rice. These results
are consistent with the results gained by (Patindol, 2000).
Increase in grain moisture leads to decreasing the
percentage of head rice. The values of head rice were
69.819%, 67.832% and 65.832% at different moisture
contents because of the lack of withstanding of grains to
pressure which facing the grains inside hulling chamber
when the grain moisture content increased and leads to
decrease in percentage of head rice. These results are
consistent with the results of (Alsharifi, 2010). The best
result (73.046%) was obtained by Satake type machine at
grain moisture of 10%-12%, and clearance of 0.8 mm. The
head rice percentage at different conditions is shown in
Figure 7 for Satake and Yanmar machines.
Table 5 Effect of machine types, clearances and grain moistures on the percentage of head grain, %
Machines Grain moisture,% Clearance between cylinder/ mm The average of head grain
0.4 0.6 0.8
Yanmar
10-12 65.769 68.635 71.719 68.707
12-14 64.571 66.804 70.012 67.129
14-16 62.909 64.670 67.056 64.878
Satake
10-12 68.204 71.541 73.046 70.930
12-14 66.298 68.578 70.727 68.535
14-16 64.308 67.070 68.977 66.785
L.S.D=0.05 0.298 0.172
Average of clearance 65.343 67.832 70.256
L.S.D=0.05 0.121
Machines The average of each machine and clearance Average of machine
Yanmar 64.416 66.703 69.596 66.905
Satake 66.270 69.063 70.917 68.750
L.S.D=0.05 0.172 0.049
Grain moisture/% The average of each grain moisture and clearance Average of grain moisture
10-12 66.987 70.088 72.383 69.819
12-14 65.435 67.691 70.370 67.832
14-16 63.609 65.870 68.017 65.832
L.S.D=0.05 0.210 0.121 Note: L.S.D means Least Significant Difference
62
64
66
68
70
72
74
Moi1
Moi2
Moi3
0.4
0.6
0.8
Moisture
Clearance
H
e
a
d
r
ic
e
p
e
rc
e
n
ta
g
e
/%
The interactions
Machine Yanmar
Machine Satake
Machine 0.4
Machine 0.6
Machine 0.8
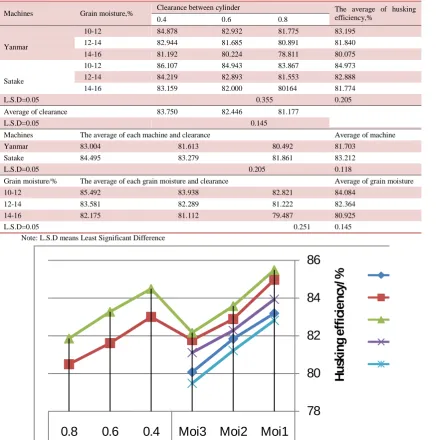
3.6 Husking efficiency
Table 6 indicates to the influence of machine type,
clearance and grain moisture on the husking efficiency.
The results showed that increase in clearance between
cylinders leads to increase husking efficiency of the
machine. The results were 83.750%, 82.446% and
81.177% at different clearances. This is due to the increase
in the production process by increasing the clearance
between cylinders. These results are consistent with the
results gained by (Williams et al., 2002). It indicates the
Satake machine with higher husking efficiency (83.212)
was significantly better than the Yanmar machine
(81.703%). This is due to the full energy assimilation by
Satake machine as compared with Yanmar machine. These
results are consistent with the results of (Richman et al.,
2006). As the increase of grain moisture leads to decrease
of husking efficiency, the results were 84.084%, 82.364%
and 80.925% at different moisture contents. The increase
in moisture content of grain also leads to obstruct the
husking process hence decreasing husking efficiency.
These results are consistent with the results of (Minaei et
al., 2007). The best result (86.107%) achieved by Satake
machine at grain moisture of 10%-12% and 0.8 mm
clearance. The levels of the husking efficiency at different
conditions are shown in Figure 8 for both machine types
(Satake and Yanmar).
Table 6 Effect of machine types, clearances and grain moistures on the husking efficiency
Machines Grain moisture,% Clearance between cylinder The average of husking efficiency,%
0.4 0.6 0.8
Yanmar
10-12 84.878 82.932 81.775 83.195
12-14 82.944 81.685 80.891 81.840
14-16 81.192 80.224 78.811 80.075
Satake
10-12 86.107 84.943 83.867 84.973
12-14 84.219 82.893 81.553 82.888
14-16 83.159 82.000 80164 81.774
L.S.D=0.05 0.355 0.205
Average of clearance 83.750 82.446 81.177
L.S.D=0.05 0.145
Machines The average of each machine and clearance Average of machine
Yanmar 83.004 81.613 80.492 81.703
Satake 84.495 83.279 81.861 83.212
L.S.D=0.05 0.205 0.118
Grain moisture/% The average of each grain moisture and clearance Average of grain moisture
10-12 85.492 83.938 82.821 84.084
12-14 83.581 82.289 81.222 82.364
14-16 82.175 81.112 79.487 80.925
L.S.D=0.05 0.251 0.145 Note: L.S.D means Least Significant Difference
78
80
82
84
86
Moi1
Moi2
Moi3
0.4
0.6
0.8
Moisture
Clearance
H
u
sk
in
g
e
ff
ic
ie
n
cy
/%
The interactions
Machine Yanmar
Machine Satake
Machine 0.4
Machine 0.6
Machine 0.8
4 Conclusion
The Satake type machine is significantly better than
the Yanmar type machine in all studied conditions. The
grain moisture content of 10%-12% was significantly
superior to the two levels 12%-14% and 14%-16%. The
0.8 mm clearance between the cylinders was significantly
superior to the other two clearances of 0.4 and 0.6 mm.
The results showed better conditions for the overlap
between the Satake type machine and grain moisture
content of 10%-12% and also for the overlap between the
Satake type machine and 0.8 mm clearance compared to
the overlap of the Yanmar type machine with other
moisture grain contents and clearances. The best result
was obtained by Satake type machine at grain moisture
content of 10%-12% and 0.8 mm clearance.
Acknowledgement
The authors would like to thank the engineering staff
at the University of Tehran, College of Abouraihan for
their support in the completion of this research.
References
Ali, A. L., and R. Shatti. 2006. The impact of harvest dates in the manufacturing qualities in some varieties of paddy. Journal Al Fatih, 1(26):97-112
Al Maamouri, S. A., and S.K. Al Sharifi. 2008. Studies effect different types of machine crunches and whitening on the rice kernels varieties Anbbar 33 and Abasiya. Journal of the University of Babylon, 17(1):134-153.
Al Saadi, F. T., and T. Al Ayoubi. 2012. Study some of the technical characteristics of the type of excessive and the impact feed speed and drying temperature and their impact on the nutritional value of maize crop. Euphrates Journal of Agriculture Science, 2(3):70-76.
Alsahoeke, M. M. and M. Creama. 1990. Applications of design and analysis of experiment. Baghdad University, College of Agriculture, Ministry of Education and Scientific Research. Pp. 49-88.
Al Sharifi, S. K., and A. S. Mousa. 2009. Study of some qualitative characteristics to two varieties of rice, the effect
of two types of machines bleach and crunches and weighted moisture content. Journal of the University of Babylon, 17(1):121-141.
Al Sharifi, S. K. A. 2010. Effect of different husking and whitening machines to rice kernel varieties Abasiya and Mushkhab 1 for both seasons 2006, 2007. Euphrates Journal of Agriculture Science, 2(3):11-35.
Chaitep, S., R. Chaiy, and W. Pipatpong. 2008. Compressive load resistance characteristics of rice grain. American Journal of Agricultural and Biological, 3(1):325-329
Chung, J. H., and Y. B. Lee. 2003. Simulation of a Rice Mill Process. Biosystems Engineering, 86(2):145-150. Available online at www.sciencedirect.com.
Corrêa, P. C., F. S. da Silva, C. Jaren, P. C. Afonso Júnior, and I.
Arana. 2007. Physical and mechanical properties in rice
processing. Journal of Food Engineering, 79(1):137-142.
Gbabo, A., and B. Ndagi. 2014. Performance evaluation of a rice mill developed in NCRI. International Journal of Engineering Research, 3(8):482-487.
Minaei, S., M. R. Alizadeh, M. H. Khoshtaghaza, and T. Tavakoli. 2007. Effects of de-awning and moisture content on husking characteristics of paddy in rubber-roll husker. American- Eurasian Journal of Agric & Environ Sci., 2(1):01-05. NurulAfsar, A. K. M., B. Mohammad, R. Mahfoozu, and M. Abdur
Rouf. 2001. Grades standards and inspection procedures of rice in Bangladesh FMRSP working paper. No 28.
Ohtsubo, K., K. Suzuki, Y. Yasui, and T. Kasumi. 2005. Bio-functional components in the processed peregrinated brown rice by a twin-screw extruder. Journal of Food Comp. Ana. 18(4):303–316.
Patindol, J. A. 2000. Methods and Standards for Rice Grain Quality Assessment in the Philippines. Quality Assurance in Agricultural Produce. Pp. 302-307.
Puri, S., B. Dhillon, and S. N. Sodhi. 2014. Effect of degree of milling (DOM) on overall quality of rice - A review. International Journal of Advanced Biotechnology and Research, 5(3):474-489.
Roy, S. M., and A. Rob. 2007. Business Rationale for Investment on Power Operated Maize Sheller in Bangladesh. Agricultural Engineering International: CIGR Journal, Invited overview, 9(3):1-13
Sacilik, K., R. Ozturk, and R. Keskin. 2003. Some physical properties of hemp seed. Journal of Biosystems Engineering, 86(2):191–198.