Comparisons of Asset Pricing Models in the Egyptian Stock Market
Mohamed A. Shaker1 & Khairy Elgiziry21Department of Business Administration, Faculty of Commerce, Cairo University, Egypt 2Department of Business Administration, Faculty of Commerce, Cairo University, Egypt
Correspondence: Mohamed A. Shaker, Department of Business Administration, Faculty of Commerce, Cairo University, Cairo, 12613, Egypt. Tel: 44-745-467-8886. E-mail: mashaker@foc.cu.edu.eg
Received: August 25, 2014 Accepted: September 7, 2014 Online Published: September 10, 2014 doi:10.5430/afr.v3n4p24 URL: http://dx.doi.org/10.5430/afr.v3n4p24
Abstract
This paper employs GRS test to empirically compare the applicability of five alternatives of asset pricing models for 55 shares listed on the EGX100 for the Egyptian stock market: 1) the CAPM, 2) the Fama-French three factor model, 3) the Cahart four factor model, 4) liquidity-augmented four factor model, 5) and the five factor model (liquidity and momentum-augmented Fama-French three factor model. The sample is split into six portfolios sorted on size and book-to market ratio and 45 shares are excluded due to data unavailability. Our results based on GRS (1989) show evidence that Fama-French model is the best and reject the other models.
Keywords: Fama-French, Three factor model, Emerging markets, Asset pricing models
1. Introduction
The poor empirical performance of the capital asset pricing model in developed markets (Fama & French, 2004), and the violations of the key assumptions of standard asset pricing theory caused by emerging markets’ s characteristics like the Egyptian stock market (Harvey, 2001) raise the question whether that may affect asset pricing or not. A good asset pricing model can help investors making dependable investment decisions when they develop investment strategies and construct an investment portfolio.
While there are plenty of studies that investigate asset prices in emerging markets, only a small number of them care about African emerging markets in general and Egyptian emerging market in particular. In other words, Egyptian stock market has a faint presence in the literature of asset pricing theory. The popular research papers are: Appiah-Kusi and Menyah (2003) study 11 emerging markets in Africa to test the weak-form pricing efficiency by using weekly index returns adjusted for thin trading which is considered as nonlinear autoregressive process with conditional heteroscedasticity, Cheng, Janhan-Parvar and Rothman (2010) provide an evidence on excess return on market portfolio in Middle East and North Africa countries within the framework of three extensions of the CAPM: the static international CAPM; the constant-parameter intertemporal CAPM; and a Markov-switching intertemporal CAPM, Omran and Pointon (2004) attempt to bridge the gap of the relationship between cost of capital and firm characteristics, Alagidede and Panagiotidis (2009) analyze the movements of stock returns in the biggest African stock markets including Egypt. Alagidede (2011) investigates the predictability of returns in African stock market and analyzes the first two moments of return variations.
The study sheds some light on the Egyptian stock market that differs from developed markets in terms of informational efficiency and shows different return patterns accordingly (Sakr, Ragheb, Ragab & Abdou, 2014). as an Emerging market, Egyptian stock market is of importance because of its number of listed securities (213), number of investors and volume of trading (2.3 billion) (Abd El Aal, 2011). Furthermore, it is deeply ingrained in comparison with the other markets in the MENA region and has attracted many investors over the past few years, resulting in a significant increase in the aggregate capitalization and in the market indices (Billmeier and Massa, 2008).
The rest of the paper is organized as follows. In section 2, we provide the background of related works. Section 3 provides descriptions of data and sample. Section 4 focuses on methodology including the method of constructing portfolios used for empirical analysis and construction of factor portfolios. Section 5 shows the empirical study and analysis. Section 6 reports the concluding remarks and recommendations for future research.
2. Literature review
In recent years, there are several asset pricing models suggested to guide investment practice as a result of widespread criticisms of the capital asset pricing model. Thus, comparisons become more justifiable than before to pick the best one out in a business environment.
Drew and Veerarghavan (2002) compare the CAPM with the Fama-French three factor model in terms of explanatory power for Hong Kong, Korea, Malaysia and Philippines. They find that the Fama-French three factor model outperforms the CAPM in explaining the variation of stock returns. Durack, Durand and Maller (2004) point out the CAPM is better than Arbitrage pricing model presented by Chen, Roll & Ross (1986) in terms of R2 but it is slightly worse than the Fama-French three factor model. Bartholdy and Peare (2005) compare the performance of the CAPM and the Fama-French three factor model. They conclude that Fama-French model does not do much better than the CAPM. Grauer and Janmaat (2010) explore that cross-sectional test results provide little or no support for either model. However, when size and book-to-market factors in the Fama-French framework are added to the CAPM, the performance improves. Rossi (2001) uses monthly data to compare Fama-French three factor model and CAPM in the Italian stock market and discerns that risk-return relationship cannot be described by beta, hence putting size and book-to-market ratio into market return leads to improved description of the returns. Gregory, Tharyan and Christidis (2013) follow new methodology to form factor portfolios using CPZ-style market capitalization weighting of SMB, HML and UMD to liken Fama-French three factor model to Cahart four-factor model in the London stock exchange. Their results do not strongly support value weighting and decomposing factors. Nguyen, Fafaa and Gharghgor (2009) depend on all securities in the Australian stock exchange during the period 1990 to 2005, aiming at testing GDP-augmented Fama-French three factor model. They conclude adding GDP to Fama-French three factor model does not make a significant difference. Trimech, Kortas, Benammou and Benammou (2009) investigate the ability of Fama-French three factor model to predict stock returns at multiple time scales in the French stock market. The more wavelet scale surges, the more predictability of the model explained. Tsuji (2012) argues incorporation of momentum and reversal factors in the Fama-French three factor model causes positive alpha in the Japanese stock market.
Some studies are done in emerging markets. For example, Rogers and Securato (2007) implement comparative study of three alternative asset pricing models in Brazilian stock market. They chase up Fama-French methodology to construct test portfolios and explanatory factors. The findings prefer Fama-French three factor model to the CAPM and the reward beta model developed by Bornholt (2007) in describing expected returns.
Iqbal and Brooks (2007) apply the CAPM and the Fama-French three factor model in the Pakistani stock market using daily, weekly and monthly data. In daily data, the Fama-French model performs well in explaining expected returns, while in case of weekly and monthly data neither estimation approach offers significant explanations of returns.
Iqbal, Brooks and Galagedera (2010) also conduct another study in the Pakistani emerging market and they reject unconditional CAPM. However, when size and book-to-market factors are included in the CAPM, the empirical findings sound better. Kim, Kim and Shin (2012) compare the CAPM; APT motivated model (FF5 is constructed by adding liquidity factor and long-term reversal factors to Fama-French three factor model); the Consumption based CAPM; Intertemporal CAPM and Conditional CAPM. The findings support FF5 as most satisfactorily among the models considered in the study.
Considering the literature analysis above, we can imply that there are bounded literatures studying the Fama-French framework in Africa setting.
3. Description of data and sample
enormous effect on the Egyptian market; it made the Egyptian stock market index “EGX30” drops from 12000 points to 3380 points (Abd El Aal, 2011). Therefore the data belongs to 2008 and 2009 are cut away.
The dataset used includes monthly closing price, 3-months Treasury Bills rates as a proxy for risk-free rates of returns, monthly return on market index as a proxy for return on market portfolio. However, the company annual data consists of a number of shares outstanding, trading volume, market value of equity (ME) and M/B ratio (converted to B/M ratio).
Market return is monthly return of Egyptian market index, market capitalization is used as a proxy for size, B/M is total shareholders’ equity divided by total book value. Momentum is one-year prior return behavior and liquidity measured by stock turnover that is equal to annually trading volume divided by number of outstanding shares.
4. Methodology
4.1 Construction of size - B/M sorted portfolios
The dependent variables are the excess return on the six test portfolios that are “B/L, B/M, B/H, S/L, S/M and S/H”. The excess return on each portfolio equals the monthly value- weighted average rate of return minus the risk-free interest rate (Ri - Rf).
In each year of the sample period, the stocks are divided into two groups- big (B) and small (S)- based on their market capitalization. The sample size is also divided into three groups based on their BE/ME ratio-high (H) with top 30%, medium (M) with middle 40% and low (L) with bottom 30%. The six constructing intersection portfolios are B/L, B/M, B/H, S/L, S/M, S/H - that are formed from the intersection of the two size-and three-BE/ME groups. For example, S/L consists of stocks that are in the small size group and the low BE/ME group.
4.2 Factor Portfolios
The explanatory returns to Rm- Rf, SMB, HML, WML and IMV are formed in accordance with Fama-French methodology (1993) that uses returns on zero investment portfolios as explanatory variables.
5. The models
The time series regressions of Black, Jensen and Scholes (1972) are used for estimating the following models:
The Basic CAPM
The Basic Fama-French three factor model (1993)
The Cahart four factor model (1997) : Momentum-augmented Fama-French three factor model
The Chan and Faff model (2005): Liquidity-augmented Fama-French three factor model
The Five-factor model: Momentum and Liquidity-augmented Fama-French three factor model
Those models are estimated using the stepwise procedure by adding one or more explanatory variables at a time and chase R2 to decide whether it increases with addition of variables. Moreover, the ordinary least square “OLS” is used to estimate the parameters.
6. The empirical analysis
This analysis is split into two different parts as follows:
6.1 Characteristics of portfolios
The results presented in this paper are from portfolios of stocks selected at different points in time. Table 1 provides summary information for the 6 size-B/M portfolios.
Panel A: Average number of stocks in each portfolio by year
Portfolios
Year B / H B /M B / L S / H S / M S / L Total
2003 2 14 11 15 8 5 55
2004 4 10 13 13 12 3 55
2005 3 11 13 14 11 3 55
2006 5 13 10 13 8 6 55
2007 4 13 10 13 9 6 55
Average 3.6 12.2 11.4 13.6 9.6 4.6 55
Panel B shows the average size (market capitalization) in each of size-B/M sorted portfolios. It is noted that the biggest portfolio concerning mean market capitalization is B/L with 53.8% from the market capitalization of the whole sample, while S/L is the smallest average market capitalization with 7.6% from the overall sample’ s market capitalization. The biggest size portfolios (B/H, B/H, B/M) capture up to 96% from sample size, the smallest size portfolios only capture (S/H, S/M, S/L) 4%. According to B/M ratio portfolios, the highest B/M portfolios (B/H, S/H) consist of 11% of the sample’s market capitalization but the lowest B/M portfolios (B/L, S/L) contain up to 54.6% of the sample’ market capitalization.
PanelB: Average market capitalization ME (in millions)
This table represents the market capitalization as a proxy for size for our sample. It is measured at the end of year for all companies in the sample.
Portfolios
Year B / H B / M B/ L S / H S / M S / L Total
2003 653.5 29432.2 24715.2 960.9 480.7 487.8 56730.3
2004 1331.5 17546.3 61834.5 1305.1 1259.2 191.5 83468.1
2005 2931 92630.7 175994.4 3438.2 2895.5 605.3 278795.1
2006 11012.9 51559 14918.9 3379.7 2683.8 2098.1 85652.4
2007 60114 66574.4 148195 4966 3601.7 2651.1 286102.2
Average 15208.58 51608.52 85131.6 2809.98 2184.18 1206.76 158149.6
6.2 GRS test
Gibbons, Ross and Shanken (1989, GRS F-statistic) offer one of the most famous tests for asset pricing models. It uses to examine the empirical fit of models and to test the hypothesis that 0
GRS =
F
N
T
N
L
L
T
L
N
T
N
T
,
~
ˆ
1
ˆ
ˆ
1
1 ^ 1
ˆ
= N x 1 vector of estimated intercept.
ˆ
= an unbiased estimate of the residual covariance matrix.
= L x 1 vector of the factor portfolios' sample means.
ˆ
= an unbiased estimate of the factor portfolios' covariance matrix. T = number of observations.N = number of regressions.
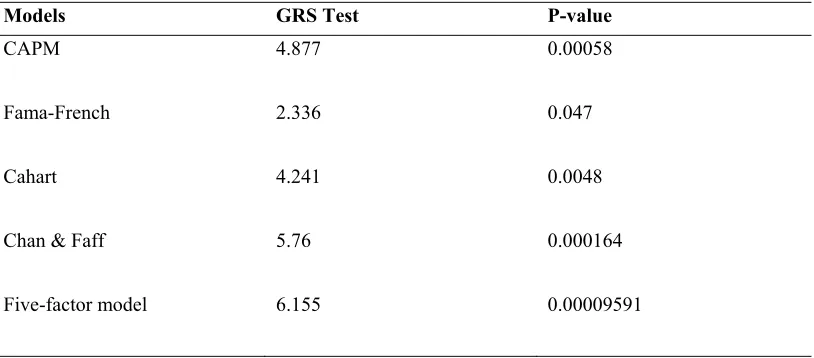
Because of the significance of intercepts in time series regressions, it is required to use GRS test as a tool to test the precision of each model. Table 2 reviews the performance of the five alternative models. The results show that the Fama-French three factor model outperforms the other models and the GRS test for Fama-French three factor model is smallest figure with a value of 2.336, Hence it cannot be rejected as an asset pricing model due to its ability to describe the variation in cross-section of average returns as well as its P-value is bigger than 1%.
On the other hand, the results do not support the CAPM, the Cahart model, the Chan & Faff model and the five factor model because their P-values are less than 1%. Accordingly, they all fail to explain the cross-section of average returns. Table 2. GRS results
Models GRS Test P-value
CAPM 4.877 0.00058
Fama-French 2.336 0.047
Cahart 4.241 0.0048
Chan & Faff 5.76 0.000164
Five-factor model 6.155 0.00009591
Statistical significance at the 1% level
The table exhibits the GRS test, which is F-statistic. It tests the hypothesis that all six as equal 0. P-value is the probability of obtaining a value at least as big as GRS. CAPM is capital asset pricing model, Fama-French is Fama-French three-factor model, Cahart is momentum augmented Fama-French three-factor model, Chan & Faff is liquidity augmented Fama-French three factor model and Five-factor model is momentum and liquidity augmented Fama-French three factor model.
7. Conclusion and Future Research
This study conducted empirical comparison of asset pricing models in the Egyptian stock market, including the CAPM, the Fama-French three factor model, the Cahart model, the Chan &Faff model and the five factor model to identify the model of the best performance for the valuation of equities.
In general, the findings confirm that the use of Fama-French three factor model is the best to capture the cross-section of average returns than the other models do during the period 2003-2007. The market factor obviously has the most predictability power for some size-B/M sorted portfolios but the incorporation of SMB and HML factors in the Fama-French three factor model shows the model superiority over the CAPM and the three variants of the Fama-French three-factor model.
Contrary to popular belief in financial research, one-year momentum surges nothing to the explanatory capability of the Fama-French three factor model for all six size-B/M sorted portfolios. It does not reinforce the applicability of the Cahart model in Egyptian market. Therefore, the validation of the momentum factor seems under questioning in emerging markets. It would be interesting to investigate three-month and six-month momentum in the framework of Fama-French three factor model in the future.
Our results do not provide strong support to the literature regarding the essential role of liquidity in asset pricing models and its compatibility with Fama-French model. This may be due to the defective measure of liquidity “turnover” which involves only one dimension “trading quantity”. However, liquidity is multi-dimensional phenomenon consisting of trading quantity, trading cost, trading speed and price impact. Hence, using multi-dimensional measure of liquidity in the framework of Fama-French three factor model is suggested for future works.
The applications include activities such as selecting portfolios, evaluating the performance of managed portfolios, estimating the cost of capital and measuring abnormal return in event studies.
The other recommendations are: 1) investigate new risk factors such as dividend yield, E/P (earning to price ratio), CF/P (Cash flow to price ratio) and Past sales growth in the context of Fama & French methodology in Egyptian stock market. 2) Re-compare the same models using high-frequency data like daily data and weekly data
Acknowledgement
The authors would like to thank Khaled Hussainey; Reader of Accounting at Stirling University; Mohamed Eissa; Assistant Professor in Finance at Qatar University and Robert Cressy; Professor of Entrepreneurship and Finance at Brimingham University for their beneficial comments.
References
Abd El Aal, M., A. (2011). Modelling and Forecasting time varying stock return volatility in the Egyptian stock market. International Research Journal of Finance and Economics 78, 96-113. http://connection.ebscohost.com/c/articles/70307586/modeling-forecasting-time-varying-stock-return-volatility-egyptian-stock-market
Alagidede, P. & Panagiotidis T. (2009). Modeling stock returns in Africa’s equity markets. International Review of Financial Analysis 18 (1-2), 1-11. http://dx.doi.org/10.1016/j.irfa.2009.02.001
Alagidede, P. (2011). Return behavior in Africa’s emerging equity markets. The Quarterly Review of Economics and Finance 51 (2), 133-140. http://dx.doi.org/10.1016/j.qref.2011.01.004
Appiah -Kusi, J. & Menyah, K. (2003). Return predictability in African stock markets. Review of Financial Economics 12 (3), 247-270. http://dx.doi.org/10.1016/S1058-3300(02)00073-3
Bartholdy, J. & Peare, P. (2005). Estimation of expected return: CAPM vs. Fama and French. International Review of Financial Analysis 14 (4), 407-427. http://dx.doi.org/10.1016/j.irfa.2004.10.009
Billmeier, A. & Massa, I. (2008). Go long or short in pyramids? News from the Egyptian stock market. International Review of Financial Analysis 17 (5), 949-970. http://dx.doi.org/10.1016/j.irfa.2008.02.003
Carhart, M.M. (1997). On persistence in mutual fund performance. Journal of Finance 52 (1), 57–82. http://dx.doi.org/10.2307/2329556
Chan, H.W. & Faff, R.W. (2005). Asset pricing and the illiquidity premium. The Financial Review 40 (4), 429-458. http://dx.doi.org/10.1111/j.1540-6288.2005.00118.x
Cheng, A., Janhan-Parvar M. & Rothman P. (2010). An Empirical investigation of stock market behavior in the Middle East and North Africa. Journal of Empirical Finance 17 (3), 413-427. http://dx.doi.org/10.1016/j.jempfin.2009.11.002
De Bondt, W.F.M. & Thaler, R.H. (1985). Does the Stock Market Overreact?. Journal of Finance 40 (3), 793– 808. http://dx.doi.org/10.2307/2327804
Diether, K. (2001). GRS review: empirical implications of the ICAPM. September 29th, 2009, from http//: faculty.chigacobooth.edu/Eugene.fama/teaching/Reading%20list%20and%20Notes/GRD.pdf
Drew, M.E. & Veerarghavan, M. (2002). Idiosyncratic volatility and security returns: evidence from the Asian region.
International Quarterly Journal of Finance 2, 1-13.
Durack, N., Durand, R.B. & Maller, R. A. (2004). A best choice among asset pricing models? The conditional capital asset pricing model in Australia. Accounting and Finance 44 (2), 139-162. http://dx.doi.org/10.1111/j.1467-629X.2004.00107.x
Estrada, J. & Serra, A.P. (2005). Risk and Return in emerging markets: Family matters. Journal of Multinational Financial Management 15 (3), 257-272. http://dx.doi.org/10.1016/j.mulfin.2004.09.002
Fama, E.F. & French, K.R. (1993). Common risk factor in the returns of stock and bonds. Journal of Financial Economics 33 (1), 3-56. http://dx.doi.org/10.1016/0304-405X(93)90023-5
Fama, E.F. & French, K.R. (1996). Multifactor explanations of asset pricing anomalies. Journal of Finance 51 (1), 55-84. http://dx.doi.org/10.2307/2329302
Gibbons, M. R., Ross, S. A., & Shanken, J. (1989). A test of efficiency of a given portfolio. Econometrica 57 (1), 1121-1152. http://dx.doi.org/10.2307/1913625
Grauer, R.R& Janmaat, J.A. (2010). Cross-sectional tests of the CAPM and Fama-French three-factor model.
Journal of Banking & Finance 34 (2), 457-470. http://dx.doi.org/10.1016/j.jbankfin.2009.08.011
Gregory, A., Tharyan, R. & Christidis, A. (2013). Constructing and testing alternative versions of the Fama-French and Cahart models in the UK. Journal of Business Finance and Accounting 40 (1) & (2), 172-214. http://dx.doi.org/10.1111/jbfa.12006
Harvey, C.,H. (2001). Asset Pricing in Emerging Markets. In Orley Ashenfelter, Section Editor, International Encyclopedia of The Social and Behavioral Sciences, Elsevier Science Limited, 840-845. https://faculty.fuqua.duke.edu/~charvey/Research/Working_Papers/W54_Asset_pricing_in.pdf
Iqbal, J. & Brooks, R. (2007). Alternative beta risk estimators and asset pricing tests in emerging markets: the case of
Pakistan. Journal of Multinational Financial Management 17 (1), 75-93.
http://dx.doi.org/10.1016/j.mulfin.2006.04.001
Iqbal, J., Brooks, R. & Galagedera, D.U.A. (2010). Testing conditional asset pricing models: An Emerging market perspective. Journal of International Money and Finance 29 (5), 897-918. http://dx.doi.org/ 10.1016/j.jimonfin.2009.12.004
Jegadeesh, N. & Titman, S. (1993). Returns to buying winners and selling losers: Implications for stock market efficiency. Journal of Finance 48 (1), 65-91. http://dx.doi.org/10.2307/2328882
Kim, S-H., Kim, D & Shin, H-S. (2012). Evaluating asset pricing models in the Korean stock market. Pacific-Basin Finance Journal 20, 198-227. http://dx.doi.org/10.1016/j.pacfin.2011.09.001
Nguyen, A., Faff, R. & Gharghori, P. (2009). Are the Fama-French factors proxing news related to GDP growth? The Australian evidence. Review of Quantitative Finance and Accounting 33, 141-158. http://dx.doi.org/10.1007/s11156-009-0137-8
Omran, M. & Pointon, J. (2004). The determinants of the cost of capital by industry within an emerging economy: evidence from Egypt. International Journal of Business 9 (3), 237–258.
Rogers, P. & Securato, J.R. (2007). Comparative study of CAPM, Fama and French model and reward beta approach in the Brazilian market. SSRN, Working paper, No. 1027134. http://papers.ssrn.com/sol3/papers.cfm?abstract_id=1027134
Rossi, F. (2012). The three-factor model: Evidence from the Italian stock market. Research Journal of Finance and Accounting 3 (9), 151-160. www.iiste.org/Journals/index.php/RJFA/article/download/3163/3214
Sakr, A.,M., Ragheb, M., A., Ragab, A., A. & Abdou, R. K. (2014). Return anomalies “Disposition effect and Momentum”: Evidence from the Egyptian stock market. International Journal of Economics and Finance 6 (2), 181-196. http://dx.doi.org/10.5539/ijef.v6n2p181
Trimech, A., Kortas, H., Benammou, S. & Benammou, S. (2014). Multiscale Fama-French model: application to the French market 10 (2), 179-192.http://dx.doi.org/10.1108/15265940910938251