RESEARCH
The impact of genetic background and cell
lineage on the level and pattern of gene
expression in position effect variegation
Sidney H. Wang
1*and Sarah C. R. Elgin
2*Abstract
Background: Chromatin-based transcriptional silencing is often described as a stochastic process, largely because of the mosaic expression observed in position effect variegation (PEV), where a euchromatic reporter gene is silenced in some cells as a consequence of juxtaposition with heterochromatin. High levels of variation in PEV phenotypes are commonly observed in reporter stocks. To ascertain whether background mutations are the major contributors to this variation, we asked how much of the variation is determined by genetic variants segregating in the population, examining both the level and pattern of expression using the fruit fly, Drosophila melanogaster, as the model. Results: Using selective breeding of a fourth chromosome PEV reporter line, 39C-12, we isolated two inbred lines exhibiting contrasting degrees of variegation (A1: low expression, D1: high expression). Within each inbred popula-tion, remarkable similarity is observed in the degree of variegation: 90% of the variation between the two inbred lines in the degree of silencing can be explained by genotype. Further analyses suggest that this result reflects the combined effect of multiple independent trans-acting loci. While the initial observations are based on a PEV pheno-type scored in the fly eye (hsp70-white reporter), similar degrees of silencing were observed using a beta-gal reporter scored across the whole fly. Further, the pattern of variegation becomes almost identical within each inbred line; significant pigment enrichment in the same quadrant of the eye was found for both A1 and D1 lines despite different degrees of expression.
Conclusions: The results indicate that background genetic variants play the major role in determining the vari-able degrees of PEV commonly observed in laboratory stocks. Interestingly, not only does the degree of variegation become consistent in inbred lines, the patterns of variegation also appear similar. Combining these observations with the spreading model for local heterochromatin formation, we propose an augmented stochastic model to describe PEV in which the genetic background drives the overall level of silencing, working with the cell lineage-specific regu-latory environment to determine the on/off probability at the reporter locus in each cell. This model acknowledges cell type-specific events in the context of broader genetic impacts on heterochromatin formation.
Keywords: PEV, Heterochromatin, Modifiers of PEV, Transcription regulation
© The Author(s) 2019. This article is distributed under the terms of the Creative Commons Attribution 4.0 International License (http://creat iveco mmons .org/licen ses/by/4.0/), which permits unrestricted use, distribution, and reproduction in any medium, provided you give appropriate credit to the original author(s) and the source, provide a link to the Creative Commons license, and indicate if changes were made. The Creative Commons Public Domain Dedication waiver (http://creativecommons.org/ publicdomain/zero/1.0/) applies to the data made available in this article, unless otherwise stated.
Open Access
*Correspondence: [email protected]; [email protected]
1 Center for Human Genetics, The Brown Foundation Institute
of Molecular Medicine, The University of Texas Health Science Center at Houston, Houston, TX, USA
Background
Position effect variegation (PEV) describes the mosaic expression of a phenotype in a cell population that is otherwise thought to be uniform. It has generally been studied in cases where the cell-autonomous phenotype is easily visualized, such as eye pigmentation, but appears to be a general phenomenon [1, 2]. Muller reported the original observation of variegating eye pigmentation in adult flies, recovered following X-ray mutagenesis. Because of the high degree of variation in the pattern, and in the level of pigmentation between individuals and across generations, he described the phenotype as “ever sporting” [3]. The report on this highly variable pheno-type led to various speculative models describing how such a heritable, yet variable phenotype could arise [4]. Further investigations have led to a generally accepted transcriptional silencing model based on a stochastic spreading of heterochromatin [5]. The X-ray-induced inversion generated by Muller juxtaposed the white
gene, which is required cell autonomously for proper deposition of eye pigment, with the pericentric hetero-chromatin. The spreading of pericentric heterochroma-tin packaging to the white locus results in concomitant silencing; when this occurs in some but not all of the cells, the result is a variegated pattern of eye pigmenta-tion. This spreading process is thought to be stochastic (reviewed in [6]).
The key concept that enables the spreading model to describe a variegating phenotype is the implicitly assigned probability of heterochromatin spreading. It is intuitive to consider that a locus closer to the pericen-tric heterochromatin would be more likely to be silenced by the spreading of heterochromatin than a locus that is further away; thus, an inversion (or transposition) that brings the white locus closer to pericentric heterochro-matin would lead to a discernable level of stochastic silencing [5, 6]. Because the process is governed by prob-ability, each cell in a homogenous population could have the same chance of heterochromatin spreading/silenc-ing to a given locus, yet as a whole, different variegatspreading/silenc-ing patterns could arise. Many factors have been found to affect the probability of spreading. Genetic mutations are perhaps the best studied. Screens for second-site modi-fiers of a PEV phenotype have identified numerous loci that have a strong impact on the expression level of the PEV phenotype for the cell population as a whole. These genetic modifiers are referred to as suppressors [Su(var); loss of silencing] or enhancers [E(var); gain in silencing] of PEV (see [2, 6] for review). Some of these loci exhibit antipodal effects, i.e., if one dose of the gene results in loss of silencing, three doses result in an increase in silencing. This antipodal response has been interpreted as evidence that the probability of the heterochromatin
spreading process occurring is determined at least in part by the dosage of key gene products that consti-tute the structural components of heterochromatin; in other cases, an enzymatic contribution is implied. An assay scoring a PEV phenotype following a one genera-tion cross to assess dominant effects of candidate PEV modifier alleles has, therefore, been commonly used to test the participation of a given gene of interest in the process of heterochromatin formation and gene silenc-ing [7]. In fact, screens for PEV suppressors have been a major source of candidate genes for participation in the process of heterochromatin formation [8, 9]. Numerous mutations have been identified to modify PEV; it is esti-mated that there are more than 150 such modifiers in the fly genome [10]. It has long been recognized that genetic background—including different assortment of alleles at these many loci—could affect the probability for a spreading event to occur in a given fly within a stock, and thus could contribute to variation in PEV phenotypes. In fact, a recent study looking at PEV in an outbred fly population suggested that many more modifier loci likely exist across the genome [11].
Although PEV has been tremendously helpful in devel-oping our understanding of heterochromatin, its stochas-tic nature continues to raise unanswered questions. An arguably more intriguing but much less studied aspect of PEV is the different patterns of variegation. The spread-ing model effectively describes the variable PEV patterns for classic examples in S. pombe, where colonies with sec-tors of variegating expression are explained by stochastic spreading of heterochromatin followed by clonal inher-itance of the chromatin state [1, 12]. In higher eukary-otic systems, however, the effectiveness of the spreading model in describing variegation patterns becomes much less clear and possibly locus dependent. Compared to S. pombe, where individual cells in a population are often considered identical, in multi-cellular organisms, cells differentiate, and it becomes much less clear how often a population of cells can be considered effectively homog-enous for a locus of interest.
We previously devised a P element reporter to probe the heterochromatin landscape of the genome, P{hsp26
-pt, hsp70-white}. Using the well-characterized hsp70
phenotype, the fourth chromosome (Muller F element), while largely heterochromatic, appears to have inter-spersed heterochromatic and permissive domains [14]. Characterization of these variegating P element reporter insertion lines has indicated that the basic principles for variegation as observed in the original white mottled line from Muller (i.e., sensitivity to sex chromosome dosage, etc.) are common to most variegating lines [13], although individual heterochromatic domains can show differ-ences in sensitivity to a subset of the known suppressors of variegation [15–17]. A major exception are inser-tions into the TAS (telomere-associated sequences), just proximal to HeT-A and TART; these lines exhibit a PEV phenotype that is sensitive to mutations in the Polycomb silencing machinery [18], while ChIP analysis shows association with Pc [19].
Individual flies from each of the laboratory stocks of P{hsp26-pt, hsp70-white} reporter lines often show a high level of variation in the degree of variegation; in contrast, there is often a discernable similarity in the pat-tern of variegation for a given stock. Both observations are in clear contradiction to what would have been pre-dicted by the spreading model per se; assuming homoge-neous cell populations in a uniform genetic background, the spreading model predicts uniform degrees of PEV without a consistent pattern between individual flies. We anticipate that background genetic variants contrib-ute to the variable degrees of PEV commonly observed between individuals in these reporter lines, and that for certain reporter lines, the homogeneous cell population assumption is inadequate. Our goal is to generate quanti-tative evidence addressing this hypothesis. Here we have used as our test locus a reporter in the fourth chromo-some, a largely heterochromatic domain that for the most part mimics pericentric heterochromatin, a chromatin structure dependent on H3K9 methylation and associ-ated HP1a [13, 15]. The study was carried out using a 4th chromosome PEV reporter line, 39C-12, for several rea-sons. 39C-12 is relatively well characterized in terms of its response to PEV modifiers [15, 16, 20]. Its position has been mapped to a precise location in the genome [14]. The hsp70 promoter used in this reporter is well charac-terized [21]. Its basal activity at 25 °C in this construct is sufficient to cause a uniform red eye when the reporter is inserted into a euchromatic site. Finally, the 39C-12 stock is considered relatively “clean” because of the genetic bottleneck that occurred during the production of the transgenic line; specifically, the line is derived from a single male with the P element insertion on the fourth chromosome, back-crossed to yw67c23 females. Taking
a quantitative genetics approach, we found that most of the variation in the degree of PEV in the 39C-12 stock could be explained by genetic variants floating in the
background, likely a combination of residual heterozygo-sity from backcrossing and new mutations accumulated over time (ca. 15 years in stock). This result was dupli-cated with a second reporter juxtaposed to Y heterochro-matin using a different crossing scheme. In addition, we formally tested pattern enrichment for 39C-12 PEV and found significant enrichment at the ventral-posterior quadrant of the fly eye, supporting anecdotal observa-tions of similarity between individual flies in reporter stocks. Similar patterns in PEV phenotype among indi-vidual flies indicate consistent differences between cells in their ability to silence the reporter. Our observations are consistent with the published literature and provide fresh insights into this classic system.
Results
Visual inspection shows considerable variation in the levels of PEV in adult fly eyes among individuals of the 39C-12 reporter line raised at 25 °C. Despite a genetic bottleneck during the production of this transgenic line, there is a high degree of variation in the level of extracted eye pigment (coefficient of variation [CV] = 51.3%), which averaged 0.0246 (OD480). Because the reporter
in a linear model explains 95.9% of the variance between A1 and D1 flies, while genotype alone explains 89.6% of the variance (see “Materials and methods” and “Statistical
analysis”). In other words, the effect of selective breed-ing contributes to the majority of the phenotypic differ-ences observed between the two inbred lines, supporting the hypothesis that background genetic variants are the major contributors to the phenotypic variation observed in the parental 39C-12 population.
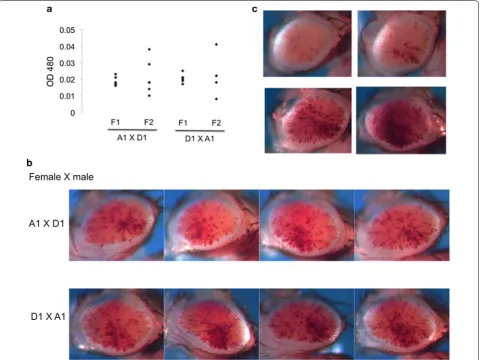
Mutations accumulated over time are expected to broadly distribute across the genome. To assess the genetic architecture (i.e., the underlying genetic basis of the phenotypic differences [22]) of the two inbred lines regarding the impact on the PEV phenotype, crosses were performed between these lines to generate F1 and F2 populations. There is a fairly consistent intermediate PEV phenotype in the F1 population (mean = 0.0196, SD = 0.0027, CV = 14.02%). Similar results were obtained from crosses in both directions (Fig. 2a, b). The aver-age pigmentation level for F1 progeny in both cases
Fig. 1 Selective inbreeding results in highly consistent PEV phenotypes within a laboratory population. a Quantitative assessment of pigment levels in the adult fly eye representing the degree of PEV. Each data point represents a reading from samples of five flies from a population of the indicated genotype, parental (39C-12) or selected (A1, D1) (see “Materials and methods” for details). yw is used to indicate the background pigment level. b Images of the PEV pattern in the adult fly eye taken from randomly selected individuals in each of the A1 and D1 inbred populations
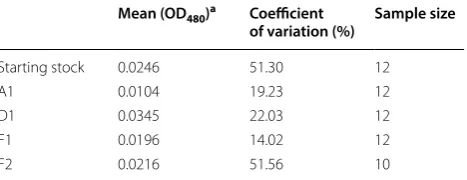
Table 1 Pigment assay results for 39C-12 inbred variegating lines
a Average values reported for measurements of pigment level; each measurement was obtained from pigment extracted from a pool of five representative flies as one sample
Mean (OD480)a Coefficient
of variation (%) Sample size
Starting stock 0.0246 51.30 12
A1 0.0104 19.23 12
D1 0.0345 22.03 12
F1 0.0196 14.02 12
falls right in the middle between the pigment levels of the parental A1 and D1 lines (Figs. 1a, 2a; Table 1). As would be expected for a quantitative trait involving mul-tiple independent loci, a wide spectrum of PEV pheno-types was observed in the F2 population (mean = 0.0216, SD = 0.0111, CV = 51.56%), which likely resulted from meiotic recombination and random segregation of the A1 and D1 background PEV modifiers. The mean pig-mentation level for the F2 progeny is similar to the F1 population (0.0216 vs. 0.0196); in contrast, there is a large increase in the range of expression levels for the PEV phenotype between individuals of the F2 population (CV = 51.56% vs. 14.02%; Fig. 2a, c, Table 1). The range of phenotypic variation in the F2 population resembles that of the starting 39C-12 stock (compare Fig. 1a with Fig. 2a, CV = 51.3% vs. 51.56%). Note that the differences observed in CV are not a spurious observation driven by
a few outliers; further analysis confirmed the robustness of the result (Additional file 1: Figure S1). Taken together, these results suggest that the variation in PEV pheno-type between individuals of the 39C-12 transgenic fly line is best described by the effect of multiple trans-genetic modifier loci acting independently in the background, which further supports the background mutation hypothesis.
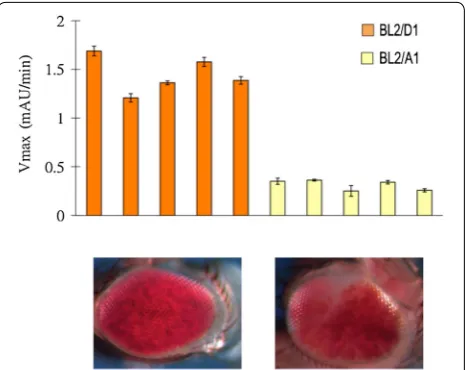
The results above are based on the PEV eye pheno-type of a P element hsp70-white reporter inserted into the heterochromatic 4th chromosome. To determine whether the conclusions drawn are generally applica-ble to the PEV phenotype, we evaluated the impact of the A1 and D1 background genotypes on the PEV phe-notype of a Y-linked hsp70-LacZ PEV reporter, Tp(3;Y) BL2 (BL2). The PEV phenotype of the BL2 LacZ reporter line used for this purpose results from a translocation of
a fragment of the 3rd chromosome carrying the reporter to the Y chromosome following X-ray irradiation [23]. A multigeneration cross-scheme was designed to introduce this Y-linked PEV reporter into the A1 (or D1) genotype, without perturbing that genetic background, utilizing dominantly marked balancer chromosomes and relying on the fact that meiotic recombination is not known to occur in the male germ line [24, 25] (Additional file 2: Figure S2). Two inbred lines containing the Y-linked BL2 reporter in the A1 and D1 genetic backgrounds, respec-tively, were derived (BL2-A1 and BL2-D1). The level of
beta-galactosidase activity (mAU/min) in lysates pre-pared from single male flies was used as a quantitative readout for the PEV phenotype. A consistent PEV phe-notype for the BL2 reporter across individuals from each of the A1 or D1 genetic backgrounds was observed, with D1 flies exhibiting ~ 4.64 times the activity of A1 flies (Fig. 3). The BL2 reporter in a D1 background gave a CV of 13.11% (mean = 1.44, SD = 0.19), while in an A1 back-ground it gave a CV of 17.24% (mean = 0.31, SD = 0.05). Taken together, the results for the BL2 reporter largely recapitulate the results for the 39C-12 reporter, indicat-ing that the same (or similar) background PEV modifiers impact both a 4th chromosome P element PEV reporter and an X-ray induced Y-chromosome-linked PEV reporter in the same direction. Lu et al. [26] reported variegating expression for the BL2 reporter in multiple
tissues, such as various differentiating imaginal discs in late third instar larvae, as well as in adult eyes. Here, BL2 PEV was surveyed using the whole fly in a quantitative assay. Given Lu et al. ’s results, the findings here gener-alize the impact of background modifiers on PEV (i.e., heterochromatic silencing) beyond the fly eyes analyzed using 39C-12. It is noteworthy that the insertion of the same P element reporter into different heterochromatic domains results in different PEV phenotypes, with the “salt-and-pepper” pattern commonly associated with insertions into pericentric heterochromatin and the fourth chromosome, while large patch or sectored mosai-cism is associated with the Y chromosome [13, 23]. The results above demonstrate similar quantitative responses to PEV modifiers regardless of the overall geometry of the expression pattern.
In its simplest form, the widely accepted model of sto-chastic heterochromatin spreading assumes a homo-geneous cell population (i.e., the same probability of spreading/silencing in each cell). Within an inbred pop-ulation, the spreading model would, therefore, predict a consistent level of PEV, which, as demonstrated above, is dictated by the genetic background, with highly vari-able variegating patterns between individuals (i.e., fixed probability but various outcomes). Interestingly, in addi-tion to a consistent level of eye pigmentaaddi-tion, the inbred lines also showed a consistent pattern of eye pigmenta-tion among individuals within each line (Fig. 1b). The apparent consistent pattern observed here would argue that nonrandom variation in heterochromatin silenc-ing among cells plays a role in determinsilenc-ing the observed pattern. Similarities in PEV pigmentation patterns have been observed between flies in some of our laboratory stocks; however, those observations were generally anec-dotal and had not been carefully evaluated. To formally evaluate similarity in the PEV pattern between individual flies, we ask if certain geographic regions of the fly eye expressed pigmentation more frequently. An enrichment of pigmented ommatidia in a ventral-posterior sector (i.e., near the neck) is observed for both A1 and D1 lines. The pigment enrichment pattern was evaluated by com-paring the proportion of ommatidia exhibiting red pig-ment between the ventral-posterior quadrant of the eye and the rest of the eye (Additional file 3: Figure S3). For the A1 and D1 lines, the ommatidia in the ventral-pos-terior quadrant are 5.24 times (p < 0.05, ANOVA, n= 5) and 3.58 times (p < 1e−5, ANOVA, n= 5), respectively, more likely to exhibit pigment than ommatidia in the rest of the eye (Table 2). Furthermore, in both F1 and F2 progenies of an A1 by D1 cross, where no selection for eye phenotype was done, significant enrichment of the pigment level is also observed in the ventral-posterior quadrant of the fly eye: F1 progeny exhibits a 2.85-fold
enrichment (p < 1e−6, ANOVA, n= 14), while F2 prog-eny exhibits a 2.72-fold enrichment (p < 0.05, ANOVA,
n= 10) (Table 2). These results indicate differences in the ability of cells in the ventral-posterior quadrant and cells in the rest of the eye to silence the reporter, and point to a need for an augmented stochastic spreading model in which cell-to-cell variation is also considered to properly describe the variegating patterns observed here in inbred lines.
Discussion
A high level of heterogeneity in PEV phenotypes is com-monly observed within laboratory reporter strains, even when variation in the genetic background is reduced (as was the case here) by back crossing to yw67c23. We
rea-soned that the residual heterozygosity after back crossing and additional mutations accumulated over time could explain some of the variation observed in PEV phenotype between individual flies. Using 39C-12 as a test case, we demonstrated that most of the variation in this PEV phe-notype can be explained by genetic variants floating in the background. Our results complement a recent study on PEV phenotype using an outbred population [11]. There, Kelsey and Clark found a large number of genetic variants across the genome significantly associated with the strength of PEV. Here, we have demonstrated that even within a relatively inbred population, one still observes a high level of variation in phenotype, which is best described by the effects from multiple independent modifier loci floating in the background. While this study focused on the genetic background of a single laboratory fly stock, 39C-12, different PEV stocks are likely to have a different combination of background alleles. Given the fact that random mutations are inevitable and the fact that we successfully derived two inbred lines that have more than threefold difference in eye pigment level from a single laboratory population, it is worthwhile consid-ering the implications for using PEV reporter lines for studying chromatin-based transcriptional silencing [2,
6]. In addition to forward genetic screens, novel PEV modifiers are often identified through a reverse genetic screen for dominant effects on PEV using mutant alleles of genes that have been identified or are suspected to play a role in chromatin-based transcriptional silencing (e.g., SETDB1, G9a, PIWI). High levels of variation in the starting reporter PEV line often result in high levels of variation in the readout for the screen; some researchers will, therefore, decide to homogenize the genetic back-ground of the starting reporter line to reduce sampling variation, which will increase their power to detect domi-nant effects from the mutant alleles. In light of the results presented here, the steps researchers take to homogenize the background could lead them to unwittingly enrich or deplete the genetic background of variants that might interact with the mutant allele of interest and, therefore, amplify or reduce the phenotypic impact. This practice could, therefore, lead to inconsistent findings between labs and potentially misleading results. For more repro-ducible findings, a simple alternative to increase power would be to increase sample size. One should not, of course, blindly increase sample size in order to reach statistical significance. Another commonly implemented strategy to ensure reproducibility would be to test modi-fier effects of multiple different alleles of the same gene of interest, ideally alleles generated by different means in different genetic backgrounds.
The results using the BL2 reporter on the Y chromo-some reproduced the results observed using the original 4th chromosome P element insertion reporter. This rep-lication is important in three aspects. First, introduction of BL2 to the A1 and D1 backgrounds was done through tracking balancers, a crossing scheme very different from selective breeding. The fact that the results observed were consistent with the hypothesized effects of trans-acting background modifiers makes it much harder to interpret the selective breeding results in any other way (e.g., some unknown epigenetic state linked to the reporter locus that follows rules similar to quantitative genetics). Sec-ond, the BL2 reporter activity was assayed using whole fly lysate, which extends the observation beyond the fly eye. Third, assuming that these results from one Y chro-mosome reporter and one 4th chrochro-mosome reporter are representative of Y chromosome and 4th chromosome heterochromatin (i.e., given the caveat of small sample size and the limitation that both reporters use a 5′ regula-tory region of an hsp70 gene), the results indicate that the background modifiers in aggregate have similar effects on the PEV phenotype, and by extension, on hetero-chromatic silencing, of two different chromosomes. This conclusion agrees with many previous studies indicating sharing of individual PEV modifiers (see [6] for review). When considered in conjunction with the mass action
Table 2 Image analysis results for 39C-12 inbred variegating lines
a Fold enrichment indicates the proportion of pigmented pixels within the ventral-posterior quadrant vs. the proportion of pigmented pixels outside that quadrant
Fold enrichment
(i.e., in/out)a Significance Number of images
analyzed
A1 5.24 p < 0.05 5
D1 3.58 p < 1e−5 5
F1 2.85 p < 1e−6 14
model (proposed by Locke et al. and widely accepted [27]), the results are also consistent with a model describ-ing the Y chromosome as a heterochromatic sink that modifies the PEV phenotype of reporters at other genomic loci by trapping structural protein products of PEV modifiers. This effect of Y chromosomes potentially explains the sex-linked impact on PEV observed here and previously reported in many investigations.
However, in contrast to the sharing of modifier effects observed here (and elsewhere) between the Y and the 4th heterochromatin, it is amply documented that dif-ferent Su(var) mutations can have a different impact on reporters in different heterochromatic domains [16, 17,
28]. For example, in Drosophila, the three known H3K9 methyltransferases have different impacts on the pericen-tric heterochromatin and the fourth chromosome [16]. These published examples of domain-specific effects are reports on individual modifier loci. However, the results are sometimes interpreted as reflections of distinctive heterochromatin domains that have a different composi-tion and/or follow a different set of rules for silencing. It will be worthwhile to evaluate the aggregate effects from a collection of background modifiers, generated using selective breeding based on PEV phenotype of different reporters, on different chromosomal domains (e.g., the effect of A1 background on a 4th chromosome reporter vs. its effect on a pericentric reporter); as differential impacts would support the distinctions inferred. Thus, a future study evaluating the impact of selected genetic backgrounds on multiple reporters inserted in different heterochromatic domains across the genome is likely to reveal new insights into the extent of sharing across domains, helping to define the common features of heterochromatin.
The rather consistent pattern of the eye phenotype became better defined as the flies became increasingly inbred over generations of full sibling crosses. Using the shape of the fly eye and other anatomical structures sur-rounding the eye as landmarks, enrichment of pigmen-tation in the ventral-posterior quadrant of the eye was tested. We found significant enrichment for both of the A1 and D1 lines, as well as the F1 and F2 progenies of an A1 by D1 cross. It is not uncommon among fly PEV researchers to observe certain patterns consistently occurring in certain reporter lines. For example, inser-tions of the hsp70-white reporter into the Y chromosome often show patterns with large blotches of pigmentation, whereas insertions of the same reporter into pericentric heterochromatin or the fourth chromosome generally results in a fine-scale salt-and-pepper appearance in the eye [13, 28]. However, we are not aware of any prior test-ing of whether certain geographic locations in the eye are more likely to silence (or fail to silence) the reporter. Here
we tested the inbred 39C-12 reporter lines through sta-tistical analysis on images of the PEV phenotype. Signifi-cant enrichment of pigmentation in the ventral-posterior sector indicates a lower probability of silencing in that sector relative to the rest of the eye.
The observation of geographical differences in silenc-ing is important in the context of the spreadsilenc-ing model, because the stochastic spreading of heterochromatin is often discussed in an overtly simplified scenario where cells are considered homogenous in their ability (prob-ability) to silence. This result, based on the PEV eye phenotype, clearly points to cell-to-cell variation in the probability of reporter silencing that is consistent across individual flies. In other words, while the random spread-ing model (i.e., equal probability of spreadspread-ing across all cells) is adequate for explaining sectors of PEV reporter expression in S. pombe colonies [1, 5, 12], in higher eukaryotes, it appears that a more elaborate model con-sidering developmental lineage or environmental differ-ences between cells displaying the phenotype is needed to adequately describe the process. Consistent with this conjecture, we did not find the Y chromosome BL2 reporter, which is in a different cis-regulatory environ-ment and likely subject to different regulation during the process of developmental differentiation, to express similar patterns in the eye as the 39C-12 reporter, despite having been transferred into the same A1 or D1 genetic background. One suggestion, amongst many other pos-sibilities, as to the source of differences between cells in their probability of heterochromatin silencing is the tim-ing of the last wave of cell divisions durtim-ing metamorpho-sis. Using the beta-gal reporter, Lu et al. [26] reported that in the eye disk, there is a dramatic difference in var-iegation on either side of the morphogenetic furrow, with a relaxation of silencing at this juncture. Such timing dif-ferences between geographical locations of the eye could be a contributor, as cells that go through an S phase later in developmental time are inherently exposed to a differ-ent environmdiffer-ent during the silencing/relaxation process.
Conclusions
In summary, our observations with two PEV reporters inserted in different cis-regulatory environments in two diverging trans-acting genetic backgrounds (A1 and D1) indicate that while trans-acting modifiers play the major role in determining the degree of PEV silencing, the pat-tern of PEV silencing is likely influenced more by the cis -regulatory environment of the reporter insertion site.
Materials and methods
Fly husbandry and genetics
specified, genetic crosses were performed by mating two male flies with three–five female virgin flies. The 39C-12 reporter line [13] was used as the starting line to generate A1 and D1 inbred lines. Five generations of consecutive full sibling crosses with selection for extreme eye pheno-type at each generation were performed to create the two inbred lines. To substitute the BL2 Y-linked PEV reporter [23] into the A1 or D1 genetic background, dominantly marked balancers were used to follow the second and third chromosomes (see Additional file 2: Figure S2 for crossing scheme). Balancers SM5 and TM6 were first introduced to the BL2 line by a standard cross, and the F1 male progeny that had both the second and third chro-mosomes balanced were selected (based on the dominant markers) to mate with female flies from the inbred line. A male F2 progeny from the F1 cross with both balancers over inbred chromosomes were selected to backcross to three–five inbred line female virgins. Only one male fly was used in the F2 cross to ensure that there would only be two genotypes of the 4th chromosome in the F3 popu-lation (i.e., the original 39C-12 4th chromosome and the other 4th chromosome, which is denoted as +iso in Addi-tional file 2: Figure S2, carried by the selected F2 male). Because the 4th chromosome is not known to recombine during meiosis (or does so extremely rarely), progeny from the backcross lacking both balancers was selected to make a floating stock (i.e., inbred genetic background with an unmarked 4th chromosome floating). This float-ing stock was made homozygous for the 39C-12 4th chromosome, as judged by the presence of the 39C-12 reporter expression, to generate the final stock. To evalu-ate the homozygosity of the 4th chromosome in the final stock, 39C-12 reporter expression in all female progeny was followed by visual inspection for multiple genera-tions (white expression in male progeny cannot be used to evaluate 39C-12 expression because of the interfer-ence coming from the mini-white construct in the BL2 reporter.)
PEV assays
Eye pigment extraction and quantification was done essentially as previously described [30] with a few modi-fications. Instead of hand homogenizing for pigment extraction, whole flies were homogenized using a Mixer Mill Mm 300 to increase the throughput and consistency. The overnight incubation at 4 °C was omitted. For each genotype of each sex, 20–30 age-matched flies (3–5 days old) were randomly selected from the population and sorted according to their pigmentation level by visual inspection. Five flies of similar pigmentation levels were then collected together as one sample. The same protocol was used for both sexes.
X-gal staining of eye imaginal discs and the assay of
beta-galactosidase activity were carried out as previously described [31].
For image analysis of the PEV phenotype, eye pic-tures from a random sampling of the PEV phenotype from each population were selected based on eye size and angle of the photo to ensure consistent quantifica-tion. Each image was then converted to 8-bit gray scale in imageJ, and then further converted to a binary image through manual threshold setting. The guideline used for threshold setting was to capture as many variegating speckles as possible without introducing large patches of shadow that resulted from lighting differences dur-ing imagdur-ing. The area to quantify was manually selected using the imageJ oval tool to cover as much of the eye as possible without covering other anatomical structures. The binary oval image representation of the eye PEV phe-notype was then converted into a binary table of quanti-fication using the imageJ image to result function, where each entry in the table represents a pixel in the image. To test for enrichment of pigmentation in the ventral-pos-terior quadrant, the proportion of “expressed” pixels in the ventral-posterior quadrant was compared to the pro-portion of “expressed” pixels outside of the quadrant of interest using statistical tests described in the following section.
Statistical analysis
Analysis of the strength of the PEV phenotype (e.g., pig-ment level) was done using either R or excel. For estimat-ing the genotype effect and the sex effect on the variation in PEV phenotype between the A1 and D1 lines, we fit the pigment assay data to a linear model using the gen-otype label and sex label as predictors. More precisely, the OD 480 reading for pigment level was first log trans-formed and then fitted as the response variable in the fol-lowing linear model using the lm() function in R:
where Pi represents the pigment level of individual i, Gi is
the indicator variable for the genotype label, and Si is the
indicator variable for the sex label. The adjusted R2
pro-duced by applying the summary() function to the above-described lm object is used to estimate the percentage variance explained by the model. To evaluate the signifi-cance of the genotype effect (i.e., the differences in PEV phenotype between the A1 and D1 genotypes), we per-formed an F test by applying the anova() function on the lm object. Analysis of the pattern of PEV followed a simi-lar linear model framework, where the proportion of pig-mentation in or out of the ventral-posterior quadrant is modeled using a binary predictor of location. To evaluate
the association between the proportion of pigmentation and the location, we performed an F test.
Supplementary information
Supplementary information accompanies this paper at https ://doi. org/10.1186/s1307 2-019-0314-5.
Additional file 1: Figure S1. Differences in the coefficient of variation (CV) between groups are not driven by extreme samples. Standard Box-plots are shown summarizing the range of CVs calculated for each group based on CVs of all permutations of leaving one sample out. The outliers for boxplots are defined as data points that lie beyond plus/minus 1.5 times the inter quartile range from the top/bottom quartile. Note that in any given combination of the leave-one-out CV values, the 39C12 starting line and the F2 population have consistently higher CV values than the inbred populations.
Additional file 2: Figure S2. Crossing scheme for creating isogenic BL2 reporter lines. The BL2 reporter on the Y chromosome was first crossed into a balancer stock to recover the second and third chromosome domi-nant markers. The F1 male progeny with second and third chromosomes dominantly marked were selected to cross with female virgins of the A1 inbred line. A single F2 male progeny (blue rectangle) was selected to back cross to 3~5 A1 inbred line female virgins. The F3 progeny that have no balancer chromosomes will have the BL2 reporter in the A1 back-ground with a non-A1 4th chromosome floating in the population. Note that the non-A1 4th chromosome was introduced from a single F2 male, which means that in the F3 population there are only two genotypes of the 4th chromosome (denoted 39C-12 and +iso respectively). The F3 virgin flies that have no balancer chromosomes were selected to create a floating stock. In order to separate the 39C-12 chromosome from +iso
chromosome, single sibling pairs from the F3 floating stock were isolated to create multiple stocks; the 39C-12 reporter expression in all female fly eyes was followed by visual inspection for several generations in order to identify a homozygous 39C-12 stock (i.e. the exact A1 background with the Y chromosome containing the BL2 reporter). The same approach was used to transfer the BL2 reporter to the D1 genetic background.
Additional file 3: Figure S3. Example images to illustrate the process-ing steps for quantifyprocess-ing the pattern of PEV. (A) The original photo of a representative variegating eye phenotype taken from an F1 male progeny of an A1 by D1 cross. (B) An 8-bit grey scale version of A transformed using imageJ. (C) A binary image of B generated using imageJ. The image was first rotated so that the maximal area of the fly eye could be selected using the oval tool. Pixels outside the selected oval area were removed (pseudo-colored in grey for illustration) while pixels within the oval area were converted to binary by setting a threshold. The threshold selection was done manually to best represent the original eye phenotype. To evaluate the similarity of the PEV pattern between individuals, each image of a fly eye was split into four even quadrants (blue lines) and the pigment enrichment (i.e. the proportion of black pixels) in the ventral-posterior quadrant (red arrow) was evaluated against the area outside the ventral-posterior quadrant.
Acknowledgements
We thank the three anonymous reviewers, members of the Elgin lab, Joel Eis-senberg, and Ian Duncan for their critical reviews of the manuscript. This work has been supported by a Howard A. Schneiderman Fellowship (SHW) and by NIH Grant GM068388 (to SCRE).
Authors’ contributions
SHW conceived the idea for this study. SHW and SCRE designed the study. SHW executed the experiments and collected the data. SHW analyzed the data. SHW and SCRE interpreted the results and wrote the manuscript. All authors read and approved the final manuscript.
Funding
The funding support for this study came from a Howard A. Schneiderman Fel-lowship to SHW and an NIH Grant GM068388 to SCRE. The funding agencies
exerted no influence in the design of the study, data collection, data analysis, the interpretation of results, and the preparation of the manuscript.
Availability of data and materials
The data used and/or analyzed during the current study are available from the corresponding author on reasonable request.
Ethics approval and consent to participate
Not applicable.
Consent for publication
Not applicable.
Competing interests
The authors declare that they have no competing interests.
Received: 10 August 2019 Accepted: 28 October 2019
References
1. Tartof KD. Position effect variegation in yeast. BioEssays. 1994;16:713–4. 2. Girton JR, Johansen KM. Chromatin structure and the regulation of gene
expression: the lessons of PEV in Drosophila. Adv Genet. 2008;61:1–43. 3. Muller H. Types of visible variations induced by X-rays in Drosophila. J
Genet. 1930;22:299–334.
4. Spradling AC, Karpen GH. Sixty years of mystery. Genetics. 1990;126:779–84.
5. Tartof KD, Hobbs C, Jones M. A structural basis for variegating position effects. Cell. 1984;37:869–78.
6. Elgin SCR, Reuter G. Position-effect variegation, heterochromatin forma-tion, and gene silencing in Drosophila. Cold Spring Harb Perspect Biol. 2013;5:a017780.
7. Grigliatti T. Position-effect variegation—an assay for nonhistone chromo-somal proteins and chromatin assembly and modifying factors. Methods Cell Biol. 1991;35:587–627.
8. Wustmann G, Szidonya J, Taubert H, Reuter G. The genetics of position-effect variegation modifying loci in Drosophila melanogaster. Mol Gen Genet. 1989;217:520–7.
9. Hayashi S, Ruddell A, Sinclair D, Grigliatti T. Chromosomal structure is altered by mutations that suppress or enhance position effect variega-tion. Chromosoma. 1990;99:391–400.
10. Schotta G, Ebert A, Dorn R, Reuter G. Position-effect variegation and the genetic dissection of chromatin regulation in Drosophila. Semin Cell Dev Biol. 2003;14:67–75.
11. Kelsey KJP, Clark AG. Variation in position effect variegation within a natural population. Genetics. 2017;207:1157–66.
12. Allshire RC, Ekwall K. Epigenetic Regulation of chromatin states in Schizos-accharomyces pombe. Cold Spring Harb Perspect Biol. 2015;7:a018770. 13. Wallrath LL, Elgin SC. Position effect variegation in Drosophila is
associ-ated with an altered chromatin structure. Genes Dev. 1995;9:1263–77. 14. Sun FL, Cuaycong MH, Craig CA, Wallrath LL, Locke J, Elgin SC. The fourth
chromosome of Drosophila melanogaster: interspersed euchromatic and heterochromatic domains. Proc Natl Acad Sci USA. 2000;97:5340–5. 15. Haynes KA, Gracheva E, Elgin SCR. A distinct type of
heterochro-matin within Drosophila melanogaster chromosome 4. Genetics. 2007;175:1539–42.
16. Brower-Toland B, Riddle NC, Jiang H, Huisinga KL, Elgin SCR. Multiple SET methyltransferases are required to maintain normal heterochro-matin domains in the genome of Drosophila melanogaster. Genetics. 2009;181:1303–19.
17. Phalke S, Nickel O, Walluscheck D, Hortig F, Onorati MC, Reuter G. Retrotransposon silencing and telomere integrity in somatic cells of Dros-ophila depends on the cytosine-5 methyltransferase DNMT2. Nat Genet. 2009;41:696–702.
18. Cryderman DE, Morris EJ, Biessmann H, Elgin SC, Wallrath LL. Silencing at Drosophila telomeres: nuclear organization and chromatin structure play critical roles. EMBO J. 1999;18:3724–35.
•fast, convenient online submission •
thorough peer review by experienced researchers in your field • rapid publication on acceptance
• support for research data, including large and complex data types •
gold Open Access which fosters wider collaboration and increased citations maximum visibility for your research: over 100M website views per year •
At BMC, research is always in progress.
Learn more biomedcentral.com/submissions
Ready to submit your research? Choose BMC and benefit from:
domains by transposable element 1360 in Drosophila melanogaster. Genetics. 2016;202:565–82.
20. Pal-Bhadra M, Leibovitch BA, Gandhi SG, Rao M, Bhadra U, Birchler JA, et al. Heterochromatic silencing and HP1 localization in Drosophila are dependent on the RNAi machinery. Science. 2004;303:669–72. 21. Weber JA, Gilmour DS. Genomic footprinting of the hsp70 and histone
H3 promoters in Drosophila embryos reveals novel protein-DNA interac-tions. Nucleic Acids Res. 1995;23:3327–34.
22. Timpson NJ, Greenwood CMT, Soranzo N, Lawson DJ, Richards JB. Genetic architecture: the shape of the genetic contribution to human traits and disease. Nat Rev Genet. 2018;19:110–24.
23. Lu BY, Bishop CP, Eissenberg JC. Developmental timing and tissue speci-ficity of heterochromatin-mediated silencing. EMBO J. 1996;15:1323–32. 24. Hess O, Meyer GF. Genetic activities of the Y chromosome in Drosophila
during spermatogenesis. Adv Genet. 1968;14:171–223.
25. Orr-Weaver TL. Meiosis in Drosophila: seeing is believing. Proc Natl Acad Sci USA. 1995;92:10443–9.
26. Lu BY, Ma J, Eissenberg JC. Developmental regulation of hetero-chromatin-mediated gene silencing in Drosophila. Development. 1998;125:2223–34.
27. Locke J, Kotarski MA, Tartof KD. Dosage-dependent modifiers of position effect variegation in Drosophila and a mass action model that explains their effect. Genetics. 1988;120:181–98.
28. Wang SH, Nan R, Accardo MC, Sentmanat M, Dimitri P, Elgin SCR. A dis-tinct type of heterochromatin at the telomeric Region of the Drosophila melanogaster Y chromosome. PLoS ONE. 2014;9:e86451.
29. Shaffer CD, Wuller JM, Elgin SC. Raising large quantities of Drosophila for biochemical experiments. Methods Cell Biol. 1994;44:99–108.
30. Sun F-L, Haynes K, Simpson CL, Lee SD, Collins L, Wuller J, et al. cis-Acting determinants of heterochromatin formation on Drosophila melanogaster
chromosome four. Mol Cell Biol. 2004;24:8210–20.
31. Sullivan W, Ashburner M, Hawley RS. Drosophila protocols. Cold Spring Harbor: CSHL Press; 2000.
Publisher’s Note