Development of automatic counting system for urediospores of
wheat stripe rust based on image processing
Li Xiaolong
1,
Ma Zhanhong
1,
Fernando Bienvenido
2,
Qin Feng
1,
Wang Haiguang
1*,
José Antonio Alvarez-Bermejo
2(1. Department of Plant Pathology, China Agricultural University, Beijing 100193, China;
2. Department of Informatics, CeiA3, University of Almeria, Almeria, CP 04120, Spain )
Abstract: To realize automatic counting of urediospores of Puccinia striiformis f. sp. tritici (Pst) (causal agent of wheat stripe rust), an automatic counting system for urediospores of wheat stripe rust pathogen based on image processing was developed using MATLAB GUIDE platform in combination with Local C Compiler (LCC). The system is independent of the MATLAB environment and can be run on a computer without the MATLAB software. Using this system, automatic counting of Pst
urediospores in a microscopic image can be implemented via image processing technologies including image scaling, clustering segmentation, morphological modification, watershed transformation, connected region labeling, etc. Structure design of the automatic counting system, the key algorithms used in the system and realization of the main functions of the system were described in detail. Spore counting tests were conducted using microscopic digital images of Pst urediospores and the high accuracies more than 95% were obtained. The results indicated that it is feasible to count Pst urediospores automatically using the developed system based on image processing.
Keywords:puccinia striiformis f. sp. tritici, wheat stripe rust, image processing, automatic counting, computer aided system, MATLAB
DOI: 10.25165/j.ijabe.20171005.3084
Citation: Li X L, Ma Z H, Bienvenido F, Qin F, Wang H G, Alvarez-Bermejo J A. Development of automatic counting system for urediospores of wheat stripe rust based on image processing. Int J Agric & Biol Eng, 2017; 10(5): 134–143.
1 Introduction
Wheat stripe rust caused by Puccinia striiformis f. sp.
tritici (Pst) is a kind of destructive epidemic disease that
Received date: 2017-05-16 Accepted date: 2017-09-10
Biographies: Li Xiaolong, MS, research interest: plant disease monitoring, Email: [email protected]; Ma Zhanhong, PhD, research interest: plant disease monitoring, Email: mazh@ cau.edu.cn; Fernando Bienvenido, PhD, Professor, research interests: vegetable traceability and modeling of agro-systems, Email: [email protected]; Qin Feng, MS, research interest: plant disease monitoring, Email: [email protected]; José Antonio Álvarez Bermejo, PhD, Associate Professor, research interest: image processing in embedded devices, Email: [email protected].
*Corresponding author: Wang Haiguang, PhD, Associate Professor, research interest: plant disease monitoring. Department of Plant Pathology, China Agricultural University, No.2 Yuanmingyuan West Road, Haidian, Beijing 100193, China. Tel: +86-10-62733877, Email: [email protected].
affects wheat production in China[1,2]. China is the largest epidemic region of wheat stripe rust in the world[2]. As a typical air-borne disease, the pathogen that causes this disease mainly relies on the dispersal of Pst
September, 2017 Li X L, et al. Automatic counting system for urediospores of wheat stripe rust Vol. 10 No.5 135
it is difficult to ensure the counting accuracy, usually resulting in great counting errors. Although molecular biology techniques have been applied to quantify trapped spores of different pathogens[6-8], the quantification processes are complex and have high requirements on technologies and instruments. Therefore, it is great of significance to develop an automatic counting system for
Pst urediospores to monitor the spores conveniently and accurately. Based on the monitoring results, the prevalence and severity of wheat stripe rust can be predicted and then control measures can be made accordingly.
The rapid development of computer technology has made the application of computers play an important role in the studies on plant pathology[9]. As a kind of
computer technology, image processing has the advantages of rapid identification for the target images. It has been used in plant disease diagnosis[10-20], automatic grading of plant diseases[21-25], and identification and automatic counting of plant pathogens[26-30]. And it is increasingly used in automatic counting of insects, cells and pathogenic microorganisms, etc. Based on image processing, Yao et al.[31] developed
a three-layer detection algorithm including an AdaBoost classifier, a support vector machine classifier and the threshold judgment for automatic counting of whiteback planthoppers (Sogatella furcifera) in paddy fields, and a detection rate of 85.2% was achieved. Wu et al.[32] developed a counting method based on active contour model for overlapped algae counting with accuracy over 90%, and the results showed that the counting accuracy of overlapped algae cells was improved by using the active contour model algorithm in edge detection instead of watershed algorithm. Zhang et al.[33] developed a method for automatic counting of plaques in electrical images based on computer image processing technology in which watershed algorithm was used to separate the linked plaques into individual ones in the images, and the counting results obtained by computer were in agreement with the artificial counting method. To the best of our knowledge, there have been fewer reports on automatic counting of plant pathogen spores based on
image processing[27-30]. Xu and Li[27] transformed the
original images of plant pathogen spores into gray images that were further processed using median filtering and canny edge algorithm, and then transformed the gray images into binary images for segmentation, spore feature extraction and automatic counting of the spores. Based on the microscopic images of spores of rice blast, Qi et al.[29] conducted illumination correction, canny operation with fuzzy c-means algorithm and morphological image processing including close and open operations, and designed an improved watershed algorithm to separate the adjacent spores for determining the numbers of spores in the images, achieving average counting accuracy of 98.5%. Tao et al.[30] collected spore images using a spore trapping system and implemented automatic counting of spores in the images after conducting image binarization, morphological modification, feature extraction and feature matching. These studies demonstrated that counting of plant pathogen spores based on image processing is rapid and convenient with high accuracy. It will be very helpful to develop automatic spore counting systems for quantification of plant pathogen spores by microphotography method, especially for monitoring quantitative dynamics of plant pathogen spores in the field. Our previous study[28] on automatic counting of trapped urediospores of Pst based on image processing provided the foundation for the development of automatic counting system of Pst urediospores in this study.
In this study, combined with Local C Compiler (LCC), MATLAB GUIDE platform was used to develop an automatic counting system for urediospores of wheat stripe rust pathogen based on image processing. Processing of the microscopic images of Pst urediospores, including image scaling, clustering segmentation, morphological modification, watershed transformation, connected region labeling, etc., can be implemented using this system. This study provided the foundation for the prediction of wheat stripe rust and monitoring of Pst
2 General structure and development
environment of the system
2.1 General structure of the system
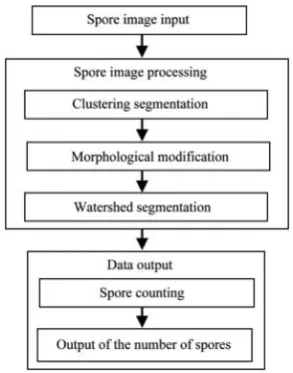
General structure of the automatic counting system for Pst urediospores was as shown in Figure 1. The main function modules of the automatic counting system include image input module, image processing module (including clustering segmentation of the spore microscopic images, morphological modification and watershed segmentation) and data output module. Using these function modules, automatic spore counting of Pst
urediospore microscopic images can be implemented. Using the image input module, a Pst urediospore microscopic image can be read and input into the automatic counting system. Using the input image processing module, clustering segmentation of the Pst
urediospore microscopic image can be implemented, morphological modifications of the binary segmentation image can be operated, and watershed segmentation to separate the joint spores in the image into individual ones can be carried out. Using the data output module, urediospore counting can be automatically conducted and the Pst urediospore counting result can be output.
Figure 1 Main structural diagram of the automatic counting system for Pst urediospores
2.2 System development environment
GUIDE (Graphical User Interface Development Environment) platform in the MATLAB software (MathWorks, Natick, MA, USA) is a special development environment for user interface programming. The automatic counting system for urediospores of wheat
stripe rust pathogen was developed in the MATLAB7.8 software environment. MATLAB was used as the programming language to realize algorithm operations and other related functions used in the system. The GUI (Graphical User Interface) of the system was designed using the GUIDE tool set. The LCC compiler was used to make the system run on a computer without the MATLAB software.
3 Key technologies of the system
3.1 K_means clustering algorithm
Binary segmentation and color segmentation of the spore microscopic images were conducted using the
K_means clustering algorithm in the automatic counting system for Pst urediospores developed in this study. As a kind of unsupervised real-time clustering algorithm,
K_means clustering algorithm proposed by Mac Queen in 1967 is an indirect hard clustering method based on the similarity between the samples[34]. Using K_means
clustering, the square of the distances from all the samples to cluster centers in the sample space can be the minimum. n pixels in the sample are divided space into
k clusters with the clustering number k as a parameter to achieve high similarity between the pixels in a cluster and low similarity between the clusters. In this study, the Euclidean distance was treated as the cluster similarity,
the mean variance e= E n/ was treated as clustering criterion function. The procedure of K_means clustering algorithm[14,28] was used in this study.
3.2 L*a*b* color spaces
Among the color space models that can be used for image processing including RGB, HSV (HIS), CMYK,
XYZ, YUV and L*a*b*, etc., L*a*b* color space was selected to conduct spore microscopic image processing in the automatic counting system for Pst urediospores. As all spore microscopic images acquired for the automatic counting system are described in RGB color space model, it is needed to transform RGB color space to
L*a*b* color space. Because RGB color space cannot be directly transformed to L*a*b* color space, RGB color space should be transformed to XYZ color space firstly, and XYZ color space then could be transformed to L*a*b*
September, 2017 Li X L, et al. Automatic counting system for urediospores of wheat stripe rust Vol. 10 No.5 137
reference [14], L*a*b* color space transformation was conducted in the automatic counting system.
3.3 Binarization and morphological operations Based on maximum variance between clusters, binarization of spore microscopic images after K_means clustering was conducted. Because of the influence of uneven illumination, impurity and other factors, image binarization often results in image distortion and false spores in the binary images. Therefore, morphological operations were conducted to modify the binary segmentation images in this study. The original basic shape of the Pst urediospores were restored by hole filling, dilation and close operations. The influence of impurity was eliminated by removing the connected regions with small areas. The incomplete spore in the image boundary area whose area was smaller than 1/5 area of a normal spore was removed. The remaining spores were treated as the visible spores in the visual field and were used for subsequent counting analysis.
3.4 Watershed transformation algorithm
The joint spores in the binary segmentation images were isolated by using watershed transformation algorithm in the automatic counting system. Watershed transformation algorithm is a morphological segmentation method based on the topological theory[35]. To avoid over segmentation, distance transformation was operated on the binary segmentation image. The value of each pixel in the image was changed to the distance from the pixel to the nearest nonzero pixel. Watershed function and imextendedmin function were used to obtain the background marker image and the foreground object marker image, respectively. Corrected gradient image was obtained using the imimposemin function with the background marker image and the foreground object marker image as the local minimum of gradient image. Then the image was processed using watershed transformation algorithm.
3.5 Automatic counting of Pst urediospores
In the automatic counting system, the Pst
urediospores in the binary images after watershed transformation were automatically counted using connected region labeling algorithm[36]. In the binary images after watershed transformation, each connected region represents one spore. Thus the number of the
connected regions is the number of the Pst urediospores. The number of the Pst urediospores can be determined by statistical analysis of the number of the connected regions.
4 System structure and realization of system
functions
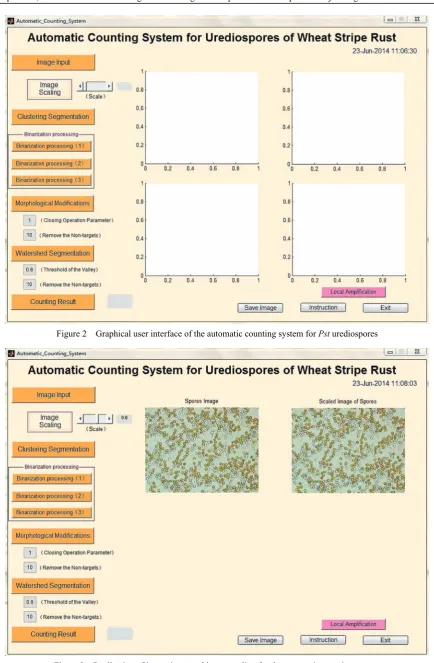
4.1 Interface of the automatic counting system According to the design scheme of the automatic counting system for Pst urediospores described above, the main functions of the system were implemented based on the image processing algorithms using the GUIDE tool set in the MATLAB 7.8 software environment. The GUI of the automatic counting system was as shown in Figure 2. When the GUI of the automatic counting system was designed using the MATLAB GUIDE platform, we clicked the required controls in the GUI panel and then clicked the edit area of interface. Thus the required controls can be placed in the right places. To improve the functions of GUI, the properties of each control can be set using Property Inspector, and the algorithm operations and other related functions can be programmed using MATLAB as the programming language.
4.2 Image input and image scaling
Figure 2 Graphical user interface of the automatic counting system for Pst urediospores
Figure 3 Realization of image input and image scaling for the automatic counting system
4.3 Image processing
Image segmentation is the key step in image processing of Pst urediospores. The aim of image segmentation is to separate spore regions from the
September, 2017 Li X L, et al. Automatic counting system for urediospores of wheat stripe rust Vol. 10 No.5 139
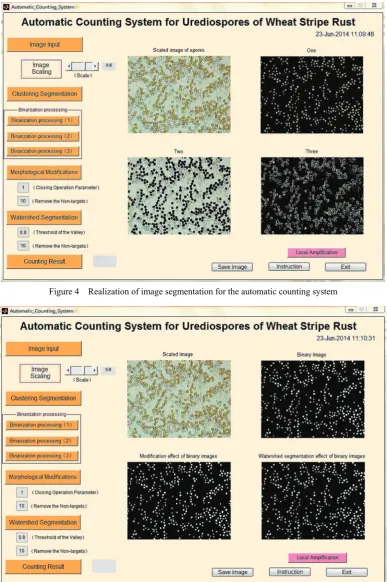
color space, cluster similarity and clustering criterion function[14,28]. The segmentation operation of the microscopic image of Pst urediospores can be implemented using the “Clustering Segmentation” button on the GUI of the automatic counting system, and the results including three images then can be displayed in the image area as shown in Figure 4. Among the three
images labeled “One”, “Two” and “Three”, respectively, there is only one image in which the target spores are accurately segmented from the background. According the label of the image, by clicking the corresponding binarization processing button on the GUI of the automatic counting system, a binary image for further processing can be obtained as shown in Figure 5.
Figure 4 Realization of image segmentation for the automatic counting system
To keep the basic shape of Pst urediospores in the images, morphological operations were needed to be conducted to modify the binary segmentation images. In this study, the holes in the binary segmentation image were filled using filling algorithm, then the image was processed using dilation algorithm, finally the impurity particles in the image was removed using removing algorithm. Moreover, the incomplete spore in the image boundary area whose area was smaller than 1/5 area of a normal spore was also removed. Morphological operations in image processing of spore microscopic image can be implemented using the “Morphological Modifications” button on the GUI of the automatic counting system. When morphological operation is performed using the automatic counting system, the parameters for closing operation and removing the non-targets can be adjusted.
Adherence separation of Pst urediospores in the images is a key step to automatic counting of the spores. In the automatic counting system, the joint spores in the binary segmentation images after morphological modification were isolated by using the watershed transformation algorithm based on prior knowledge. This process can be implemented using the “Watershed Segmentation” button on the GUI of the automatic counting system. When watershed segmentation is performed using the automatic counting system, the
parameters for the threshold of the valley and removing the non-targets can be adjusted. As shown in Figure 5, the results of image segmentation, morphological modification and watershed segmentation were satisfactory.
4.4 Data output
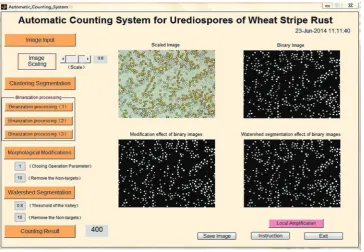
After watershed segmentation of the binary images, the Pst urediospores in the images were automatically counted using connected region labeling algorithm[36]. The number of the Pst urediospores can be displayed on the GUI. This process can be implemented using the “Counting Result” button on the GUI of the automatic counting system. Spore counting tests were conducted using the microscopic digital images of Pst urediospores trapped via indoor simulation. Totally, 290 images in 10 groups were used including 9 groups with 30 images per group and one group with 20 images. The counting result of a spore counting test using a microscopic digital image of Pst urediospores mixed with the conidia of
Blumeria graminis f. sp. tritici (causal agent of wheat powdery mildew), was as shown in Figure 6. The number of 400 on the right of the “Counting Result” button on the GUI of the automatic counting system demonstrated that there were 400 Pst urediospores in the microscopic digital image. The results of spore counting tests showed that the average counting accuracy for each group was more than 95%.
September, 2017 Li X L, et al. Automatic counting system for urediospores of wheat stripe rust Vol. 10 No.5 141
5 Results and discussion
Monitoring the amount of Pst urediospores in the field is an important part of disease and pathogen monitoring, and is an important prerequisite for scientific prediction of wheat stripe rust. In this study, an automatic counting system for urediospores of wheat stripe rust pathogen based on image processing was developed using the MATLAB GUIDE platform under the MATLAB 7.8 software environment. For easy of use, the source program of the system in the MATLAB 7.8 software environment was compiled to an executable program using the LCC compiler. Thus the system can be run on a computer without the MATLAB software. Using this system, clustering segmentation of spore regions, adherence separation of Pst urediospores and spore counting were realized via spore microscopic image processing.
Based on the microscopic digital images of Pst
urediospores trapped via indoor simulation, Pst
urediospore counting tests were conducted using the automatic counting system in this study. The number of
Pst urediospores in each microscopic image was carefully counted using traditional artificial counting method and the counting result was treated as the standard number of
Pst urediospores. The automatic counting results and artificial counting results were compared, and high counting accuracies were obtained. This indicated that the satisfactory output results can be obtained using the automatic counting system. A convenient and accurate tool for counting of Pst urediospores was provided in this study.
During the capture of air-borne plant pathogenic fungal spores, there will inevitably be large-area overlapping spores, and this may affect the counting accuracy of the spores. Since the spores are in three-dimensional structures, uneven light may result in color difference of the spores in the microphotography process while some spores overlap partly. In the clustering segmentation, the color difference may lead to a certain error, thus the accuracy of automatic counting may be affected. In the Pst urediospore counting tests conducted in this study, the microscopic digital images of
Pst urediospores were acquired via indoor spore trapping simulation using the spores collected from the diseased wheat leaves incubated in an artificial climate chamber. The spore samples contained few other materials that may disturb spore image processing. However, during the capture of air-borne Pst urediospores in the field, the dust, pollen particles and other pathogenic spores in the air can affect the accuracy of automatic counting of target spores[28]. The effects of various factors on automatic counting should be considered and the algorithms used in the system should be improved if the automatic counting system is applied to assess the number of Pst
urediospores trapped in the field.
6 Conclusions and suggestions
In this study, an automatic counting system for Pst
urediospores based on image processing was built using the MATLAB GUIDE platform. An executable program of the automatic counting system for Pst
urediospores was developed using the LCC compiler. It is convenient for users to utilize the system to automatically count Pst urediospores on a computer without the MATLAB software. Using this system, the number of Pst urediospores in a microscopic digital image can be automatically counted after clustering segmentation of spore regions and adherence separation of target spores based on spore microscopic image processing. The results of Pst urediospore counting tests using the automatic counting system indicated that high counting accuracy could be achieved in quantification of the Pst urediospores in a microscopic digital image. And a convenient and accurate tool was provided for counting of Pst urediospores during spore trapping in the field.
The Pst urediospore counting tests were conducted using the microscopic digital images acquired via indoor spore trapping simulation in this study, counting tests of
automatically count the target spores of the system during spore trapping and pathogen monitoring should be improved. With the development of microphotography technology and information technology, and with the increase of the coverage of the computer network and communication network, further studies will focus on the development of the application system based on internet and mobile phone communication system for convenient popularization and use. Moreover, it is necessary to develop an integrated system that consists of spore trapping system, automatic photomicrography system and automatic spore counting system for automatic monitoring of Pst urediospores in the field.
Acknowledgments
This work was supported by International Research Exchange Scheme of the Marie Curie Program of the 7th Framework Program (Ref. PIRSES-GA-2013-612659), National Key Basic Research Program of China (2013CB127700) and National Key Technologies Research and Development Program of China (2012BAD19BA04).
[References]
[1] Li Z Q, Zeng S M. Wheat rusts in China. Beijing: China Agriculture Press, 2002; pp. 1–254. (in Chinese).
[2] Chen W Q, Kang Z S, Ma Z H, Xu S C, Jin S L, Jiang Y Y. Integrated management of wheat stripe rust caused by
Puccinia striiformis f. sp. tritici in China. Scientia Agricultura Sinica, 2013; 46(20): 4254–4262. (in Chinese) [3] Wang X J, Ma Z H, Jiang Y Y, Shi S D, Liu W C, Zeng J, et
al. Modeling of the overwintering distribution of Puccinia striiformis f. sp. tritici based on meteorological data from 2001 to 2012 in China. Frontiers of Agricultural Science and Engineering, 2014; 1(3): 223–235.
[4] Campbell C L, Madden L V. Introduction to plant disease epidemiology. New York: John Willey and Sons, 1990; pp. 75–105.
[5] Xiao Y Y, Ji B H, Yang Z W, Jiang R Z. Epidemic and forecast of plant diseases (Second Edition). Beijing: China Agricultural University Press, 2005; pp.87–89. (in Chinese) [6] Calderon C, Ward E, Freeman J, Foster S J, McCartney H A.
Detection of airborne inoculum of Leptosphaeria maculans
and Pyrenopeziza brassicae in oilseed rape crops by polymerase chain reaction (PCR) assays. Plant Pathology, 2002; 51(3): 303–310.
[7] Luo Y, Ma Z, Reyes H C, Morgan D, Michailides T J. Quantification of airborne spores of Monilinia fructicola in stone fruit orchards of California using real-time PCR. European Journal of Plant Pathology, 2007; 118(2): 145–154. [8] Cao X R, Yao D M, Zhou Y L, West J S, Xu X M, Luo Y, et al. Detection and quantification of airborne inoculum of
Blumeria graminis f. sp. tritici using quantitative PCR. European Journal of Plant Pathology, 2016; 146(1): 225–229. [9] Wang H G, Ma Z H, Zhang M R, Shi S D. Application of computer technology in plant pathology. Agriculture Network Information, 2004; 19(10): 31–34. (in Chinese) [10] Pydipati R, Burks T F, Lee W S. Statistical and neural
network classifiers for citrus disease detection using machine vision. Transactions of the ASAE, 2005; 48(5): 2007–2014. [11] Camargo A, Smith J S. An image-processing based
algorithm to automatically identify plant disease visual symptoms. Biosystems Engineering, 2009; 102(1): 9–21. [12] Zhang C L, Zhang S W, Yang J C, Shi Y C, Chen J. Apple
leaf disease identification using genetic algorithm and correlation based feature selection method. Int J Agric & Biol Eng, 2017; 10(2): 74–83.
[13] Sankaran S, Mishra A, Ehsani R, Davis C. A review of advanced techniques for detecting plant diseases. Computers and Electronics in Agriculture, 2010; 72(1): 1–13. [14] Li G L, Ma Z H, Huang C, Chi Y W, Wang H G.
Segmentation of color images of grape diseases using
K_means clustering algorithm. Transactions of the CSAE, 2010; 26(Supp.2): 32–37. (in Chinese)
[15] Patil J K, Kumar R. Advances in image processing for detection of plant diseases. Journal of Advanced Bioinformatics Applications and Research, 2011; 2(2): 135–141.
[16] Leiva-Valenzuela G A, Aguilera J M. Automatic detection of orientation and diseases in blueberries using image analysis to improve their postharvest storage quality. Food Control, 2013; 33(1): 166–173.
[17] Phadikar S, Sil J, Das A K. Rice diseases classification using feature selection and rule generation techniques. Computers and Electronics in Agriculture, 2013; 90: 76–85. [18] Omrani E, Khoshnevisan B, Shamshirband S, Saboohi H,
Anuar N B, Nasir M H N M. Potential of radial basis function-based support vector regression for apple disease detection. Measurement, 2014; 55: 512–519.
[19] Barbedo J G A. An automatic method to detect and measure leaf disease symptoms using digital image processing. Plant Disease, 2014; 98(12): 1709–1716.
[20] Qin F, Liu D, Sun B, Ruan L, Ma Z, Wang H. Identification of alfalfa leaf diseases using image recognition technology. PLoS ONE, 2016; 11(12): e0168274. doi: 10.1371/journal.pone.0168274.
September, 2017 Li X L, et al. Automatic counting system for urediospores of wheat stripe rust Vol. 10 No.5 143
quantification of maize streak virus symptoms in Zea mays. Phytopathology, 1998; 88(5): 422–427.
[22] Bock C H, Parker P E, Cook A Z, Gottwald T R. Visual rating and the use of image analysis for assessing different symptoms of citrus canker of grapefruit leaves. Plant Disease, 2008; 92(4): 530–541.
[23] Li G L, Ma Z H, Wang H G. An automatic grading method of severity of single leaf infected with grape downy mildew based on image processing. Journal of China Agricultural University, 2011; 16(6): 88–93. (in Chinese)
[24] Contreras-Medina L M, Osornio-Rios R A, Torres-Pacheco I, Romero-Troncoso R D, Guevara-Gonzalez R G, Millan-Almaraz J R. Smart sensor for real-time quantification of common symptoms present in unhealthy plants. Sensors, 2012; 12(1): 784–805.
[25] Atoum Y, Afridi M J, Liu X M, McGrath J M, Hanson L E. On developing and enhancing plant-level disease rating systems in real fields. Pattern Recognition, 2016; 53: 287–299.
[26] Yue L L, Yang M, Peng L. A study of spore image classification based on feature extraction. Applied Mechanics and Materials, 2014; 556-562: 4774–4778.
[27] Xu P Y, Li J G. Computer assistance image processing spores counting. Proceedings of 2009 International Asia Conference on Informatics in Control, Automation, and Robotics (CAR 2009), 2009, pp.203–206.
[28] Li X L, Ma Z H, Sun Z Y, Wang H G. Automatic counting for trapped urediospores of Puccinia striiformis f. sp. tritici
based on image processing. Transactions of the CSAE, 2013; 29(2): 199–206. (in Chinese)
[29] Qi L, Jiang Y, Li Z H, Ma X, Zheng Z X, Wang W J. Automatic detection and counting method for spores of rice blast based on micro image processing. Transactions of the CSAE, 2015; 31(12): 186–193. (in Chinese)
[30] Tao M C, Zhao J P, Zhang Y K, Wang C, He L L, Zhou H. Design of field spore capture and automatic counting. Journal of Inner Mongolia Agricultural University (Natural Science Edition), 2016; 37(1): 105–109. (in Chinese)
[31] Yao Q, Xian D X, Liu Q J, Yang B J, Diao G Q, Tang J. Automated counting of rice planthoppers in paddy fields based on image processing. Journal of Integrative Agriculture, 2014; 13(8): 1736–1745.
[32] Wu Z Q, Wang P, Ding T H. Application of active contour model in overlapped algae cells counting. Computer Engineering, 2012; 38(3): 209–211. (in Chinese)
[33] Zhang J X, Xiao Q, Fang C X, Fan C P, Zhu S Q, Zhang L Z. Plaque electronic image segment and automatic counting by computer. Virologica Siniga, 2003; 18(4): 387–390. (in
Chinese)
[34] Selim S Z, Ismail M A. K-means-type algorithm: A generalized convergence theorem and characterization of local optimality. IEEE Transactions on Pattern Analysis and Machine Intelligence, 1984; 6(1): 81–87.
[35] Derniame J C, Kaba B A, Wastell D G. Software process: Principles, methodology and technology. Lecture Notes in Computer Science 1500, London: Springer-Verlag, 1999. pp. 1–320.