R E S E A R C H
Open Access
Transposable elements in a marginal plant
population: temporal fluctuations provide
new insights into genome evolution of wild
diploid wheat
Alexander Belyayev
1*, Ruslan Kalendar
2, Leonid Brodsky
1, Eviatar Nevo
1, Alan H Schulman
2,3*, Olga Raskina
1Abstract
Background:How new forms arise in nature has engaged evolutionary biologists since Darwin’s seminal treatise
on the origin of species. Transposable elements (TEs) may be among the most important internal sources for intraspecific variability. Thus, we aimed to explore the temporal dynamics of several TEs in individual genotypes from a small, marginal population ofAegilops speltoides. A diploid cross-pollinated grass species, it is a wild relative of the various wheat species known for their large genome sizes contributed by an extraordinary number of TEs, particularly long terminal repeat (LTR) retrotransposons. The population is characterized by high heteromorphy and possesses a wide spectrum of chromosomal abnormalities including supernumerary chromosomes, heterozygosity for translocations, and variability in the chromosomal position or number of 45S and 5S ribosomal DNA (rDNA) sites. We propose that variability on the morphological and chromosomal levels may be linked to variability at the molecular level and particularly in TE proliferation.
Results:Significant temporal fluctuation in the copy number of TEs was detected when processes that take place in small, marginal populations were simulated. It is known that under critical external conditions, outcrossing plants very often transit to self-pollination. Thus, three morphologically different genotypes with chromosomal aberrations were taken from a wild population ofAe. speltoides, and the dynamics of the TE complex traced through three rounds of selfing. It was discovered that: (i) various families of TEs vary tremendously in copy number between individuals from the same population and the selfed progenies; (ii) the fluctuations in copy number are TE-family specific; (iii) there is a great difference in TE copy number expansion or contraction between gametophytes and sporophytes; and (iv) a small percentage of TEs that increase in copy number can actually insert at novel locations and could serve as abona fidemutagen.
Conclusions:We hypothesize that TE dynamics could promote or intensify morphological and karyotypical changes, some of which may be potentially important for the process of microevolution, and allow species with plastic genomes to survive as new forms or even species in times of rapid climatic change.
Background
Populations are generally viewed as the elementary evo-lutionary unit [1,2]. A population exists as an integration of individuals in time and space that can vary over a set of successive generations. Under the influence of
spon-taneous mutations, each population becomes
heterogeneous in its genetic structure over time. Thus, a population comprises a mix of different genotypes even if its individuals are more or less phenotypically similar. Under intensive pressure from a particular (usually environmental) factor, a common phenomenon in mar-ginal populations, a shift in the genotypic structure of the population can occur. Such a shift may be regarded as the elementary event of microevolution.
Transposable elements (TEs) may be among the most important internal sources for genotypic population * Correspondence: [email protected]; [email protected]
1
Institute of Evolution, University of Haifa, Mount Carmel, Haifa, Israel 2MTT/BI Plant Genomics Laboratory, Institute of Biotechnology, Viikki
Biocenter, University of Helsinki, Helsinki, Finland
Belyayevet al.Mobile DNA2010,1:6
http://www.mobilednajournal.com/content/1/1/6
change as a result of their ability to create mutations, alter gene expression, and promote chromosomal aber-rations [3-5]. These ancient, ubiquitous, and dynamic components of eukaryotic genomes comprise up to 80% of the large genomes of cereals [6,7]. Data accumulated over the last 30 years suggest that TEs can have major effects on genome organization and function [4,6,8,9]. Nevertheless, it is still unclear whether and to what degree the TEs contribute to evolutionarily significant shifts in the genotypic structure of populations. Popula-tion genetic theory assumes that the dynamics of trans-posable elements in natural populations reflect a balance between the tendency of these elements to increase through transposition and their removal through natural selection acting against individuals with a high element copy number [10,11]. Several studies from different bio-logical systems indicate that the patterns of a single TE family can vary intraspecifically [12-15] and temporally [16]. Examination of the intraspecific dynamics of TEs, especially in marginal populations where microevolu-tionary processes are intensified [2], could considerably contribute to the understanding of key biological events such as speciation.
One of the most effective ways to understand the dynamics of the TEs over time and space may be an ecological approach, whereby several generations of plants from natural populations are investigated. Here, we have chosen a small, marginal and threatened popu-lation of Aegilops speltoides(2n = 2× = 14) as a model for exploration of the dynamics of several TE families belonging to Classes I and II (respectively moving via RNA and DNA intermediates). The species is a wild relative of the various wheat species known for their large genome sizes [17,18] contributed to by an extraor-dinary number of TEs, particularly long terminal repeat (LTR) retrotransposons.Ae. speltoideswas proposed to be the closest to the wild diploid progenitor of the G genomes and B genomes of polyploid wheat [19-21]. The study population is located on the western banks of the Kishon River (Haifa Bay area, Israel). The population is characterized by high heteromorphy and possesses a wide spectrum of chromosomal abnormalities, including supernumerary chromosomes, heterozygosity for trans-locations, and variability in the chromosomal position or number of 45S and 5S ribosomal DNA (rDNA) sites [22,23]. We propose that variability in morphological and chromosomal levels may point to variability at the molecular level and particularly in TE proliferation. Thus we aimed to detect and evaluate differences in TE copy numbers between individuals from the Kishon population and to trace inheritance of these deviations in successive generations. The broader goal of the study was to examine whether TE dynamics could be asso-ciated with morphological or karyotypical changes, some
of which are potentially important for the evolutionary process.
Results
Experimental design
Ae. speltoides is predominantly a cross-pollinated but self-compatible species [24]. Three original plants were selected from a small (approximately 100 m2), marginal, degrade population of Ae. speltoides (see Methods). Each selected original genotype represents three groups of previously investigated plants (five to seven individual original spikes in each group), which have been clus-tered due to their morphological and cytogenetic simi-larity, including spike morphology, B chromosome existence, appearance of additional 5S rDNA chromoso-mal clusters, and specific chromosochromoso-mal rearrangements [22,23].
The progeny from each genotype were obtained in three rounds of selfing. We simulated the situation in nature where, in marginal populations under critical external conditions, outcrossing plants and particularly
Ae. speltoides very often transit to self-pollination [24-26]. The copy numbers of several TE families were determined by quantitative polymerase chain reaction (qPCR) for each original genotype and its offspring. qPCR data were verified by dot blot analysis. The trans-positional activities of TEs were inferred by
inter-retro-transposon amplified polymorphism (IRAP)
retrotransposon display [27]. Generational changes in the copy number of TE families were compared with those of the non-mobile, highly repetitive tandem repeat
Spelt 52 and the 5S ribosomal RNA (rRNA) genes (rDNA).
Dynamics of TE in successive generations
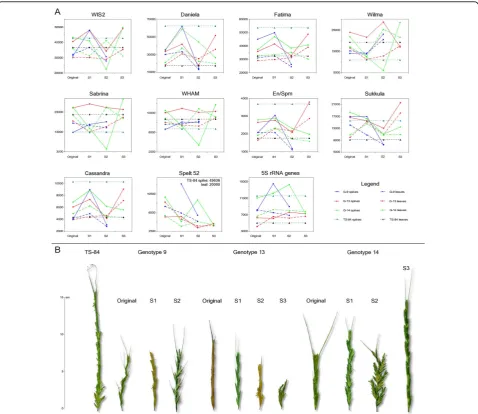
The copy numbers of TE families that we investigated are presented in Additional file 1 and in graphic form in Figure 1a. The changes in TE copy number in a set of successive generations was measured by two different methods: qPCR and dot blot. These produced consistent results.
The first salient point is that generative tissues, in most cases, possess higher numbers of TEs than do vegetative tissues. This observation is true for most TEs except those related to theAthilafamily (SabrinaandWham). For example, the number ofWIS2 retrotransposons in the spikes of G13 S1 exceeded that in leaves by 59%, or approximately 18,000 copies. The copy numbers of both the tribe-specific Spelt 52 tandem repeats and the 5S rRNA genes were also generally higher in spikes than in leaves (Additional file 1, Figure 1a).
TE copy numbers decreased or increased significantly, with a rise in one generation followed by a drop in the next and vice versa in an oscillatory fashion. In genera-tive tissues, these oscillations displayed much higher amplitudes. Particular TEs decreased up to 23% from their initial quantity, as in the case ofDaniela retrotran-sposons in G9 spikes where the copy number of this element dropped from approximately 62,000 copies in S1 to approximately 15,000 copies in S2 (Additional file 1, Figure 1a). We could not trace further TE dynamics in this genotype since the S2 generation was sterile. The largest absolute rise in TE number was documented also forDaniela in G13 spikes where the copy number rose
from approximately 18,000 copies in S2 to approxi-mately 52,000 copies in S3. The largest relative rise in TE abundance in one generation was seen for the Sab-rina element, where in G14 its number in spikes increased by 672% in S3 as compared to S2. A similar jump in this genotype between S2 and S3 was observed also forWIS2,Wilma, andWham.
Genotypes 9 and 13 were distinct by the amplitudes in their numbers of copies for particular TE families over the generations analyzed, but the tendencies were the same. Common trends included a significant increase of the highly abundant retrotransposons,WIS2, Daniela, and Fatima, in the generative tissues of the S1
Figure 1Copy numbers and morphology.(a)Dynamics of transposable element (TE) copy numbers in three self-pollinated generations of three genotypes from the Kishon population ofAegilops speltoides(shown by lines). TE copy numbers of the TS-84 population were used as controls. TE copy numbers for available sibs in selfing generations are shown by separate dots.(b)Changes in spike morphology in three self-pollinated generations of three genotypes from the Kishon population ofAe. speltoides. Spike morphology of plants from the TS-84 population was used as the control.
Belyayevet al.Mobile DNA2010,1:6
http://www.mobilednajournal.com/content/1/1/6
generation, followed by a similar decrease in these ele-ments in the S2 generation (Additional file 1, Figure 1a).
En/Spm-like transposons, Cassandraretrotransposons, and 5S rRNA genes exhibited similar dynamics in these genotypes. Wilma retrotransposons did not change in the S1 generation but then increased in number in S2. The copy number of Sukkulaelements did not change in the S1 generation, but then dropped in S2.Sabrina
and Whamelements remained approximately on the same level as in the original plants. The TE dynamics in vegetative tissues were approximately the same as in generative tissues but with less amplitude. For technical reasons, we do not have measurements of the copy number of Spelt 52in the spikes of the original plants of G9, but the rest of the measurements showed a ten-dency for this tandem repeat to decrease in abundance in generative and vegetative tissues over the generations examined.
Genotype 14 differed in TE copy number temporal dynamics from the two previously described genotypes. Cytogenetic data (see below) make it possible to propose that this genotype was already self-pollinated for at least one generation.WIS2, Wilma, Sabrina, Wham, and Suk-kula elements demonstrated significant, successive decreases in copy numbers in S1 and S2 that were then followed by increases in S3.Daniela, En/Spm, and Cas-sandra elements increased in copy number in S1 and successively decreased in S2 and S3. Fatima retrotran-sposons exhibited copy number dynamics in G14 similar to those seen in G9 and G13: increased abundance in S1, decreasing in S2, and again increasing in S3. In G14, too, the TE dynamics in vegetative tissues were approxi-mately the same as for generative tissues, but with less amplitude. The number of Spelt 52 repeats, both in spikes and leaves, decreased in S1, increased in S2, and decreased in S3. In spite of a significant increase of copy number in S2, the overall tendency was for reduction. The 5S rRNA genes successively increased in copy num-ber in S1 and S2, and then decreased in S3.
To explore segregation in the progenies of a single genotype, TE copy numbers in sibs from G9 and G13 genotypes were determined (Table S1 in Additional file 2). Significant variations over three generations of two genotypes were observed. The amplitude of TE abun-dance in sibs could not be explained by simple chromo-some segregation (see below) and, therefore, points to mobile element activity.
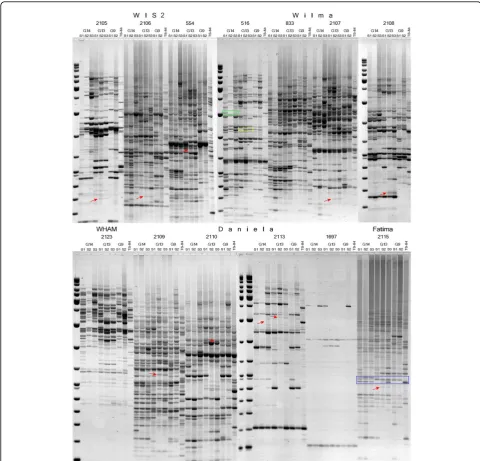
A TE display method such as IRAP [27] would be expected to show polymorphisms consonant with large changes in TE copy number. Here, IRAP analyses were conducted on DNA from spikes at the microsporogen-esis stage, and showed a high level of polymorphism from generation to generation (Figure 2). G13 showed
the most unique bands, with retrotransposonsWIS2and
Danielaproducing the greatest number.
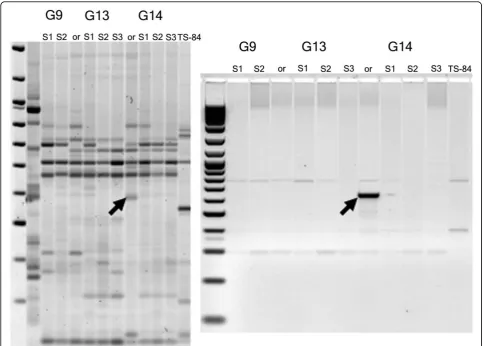
Various forms of recombination may, of course, bring TEs sufficiently close that a new IRAP band would appear in the absence of a new integration event. For any given IRAP polymorphism, its origin as an integra-tion event can be explicitly proven only by identifying an empty site, from a plant line missing the IRAP pro-duct, for one of the two TEs that together served as the template. To find evidence for individual transformation events, we cloned and sequenced 20 unique IRAP bands (Figure 3). At least half of the new insertion sites were in repetitive DNA, and therefore unsuited for identifying the original empty sites. Of the 20, (Table S2 in Addi-tional file 2), 4 of them (a Daniela, aWis2, and 2 Suk-kulainsertions) were in non-repetitive sites that could be identified in a sequence database. The advent of new, unique, amplified IRAP bands that resulted from new TE insertions confirms the existence of transpositionally active TEs in the three genotypes ofAe. speltoides. Multivariate analyses
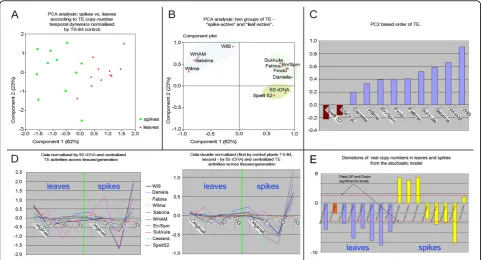
The data distribution in principle component analysis (PCA) (Figure 4a) demonstrates the clear separation of leaves and spikes for each generation, normalized pair-wise for each TE and non-TE repeat in control plants. The separation is along the first principal component (PC1), which covers 62% of initial data variability. The PC1 (Figure 4b) contrasts a group of TEs (Sukkula, Fatima, Cassandra, En/Spm, andDaniela) and two non-TE sequences (Spelt 52 and 5S rDNA) versus another group of TEs (Wilma, Sabrina, Wham, and WIS2). Therefore, the patterns of relative generational copy number variation of these two groups of TEs regarding their numbers in control plants are different in spikes and leaves. The first group of TEs and both non-TE sequences show larger fluctuations in leaves over suc-cessive generations, and the TEs of the second group show larger changes in spikes.
52 with respect to 5S rDNA is insignificant across tis-sues and generations (broken red line) while fluctuations of TE sequences are high; (ii) the intergenerational pat-tern of copy number changes for all TEs is highly corre-lated; (iii) there is little relative TE copy number variation in leaves though it is very strong in spikes. It shows a minimum in the S2 generation, and a maxi-mum in the S3 generation. In sum, the separation of TE and non-TE sequences in PC2 appears related to their
different patterns of copy number dynamics across gen-erations in spikes.
Deviations of real copy numbers in leaves and spikes from the stochastic model
The original plants of cross-pollinated Ae. speltoides
are heterozygous for repetitive DNA sequences, chro-mosomal patterns, and chrochro-mosomal rearrangements (Figures 5 and 6). In order to separate the role of the pre-existing heterozygosity on the TE copy number in
Figure 2Inter-retrotransposon amplified polymorphism (IRAP) analyses for several transposable elements (TEs) in the progeny of three genotypes. Unique bands that appear in S2 and are inherited in S3 are shown by red arrows. An example of heterozygosity displayed in the IRAP pattern is shown in the blue square. An example of band loss in S2 and S3 is shown in the green square. An example of band appearance in S2 and S3 is shown in the yellow square.
Belyayevet al.Mobile DNA2010,1:6
http://www.mobilednajournal.com/content/1/1/6
the original plants from other mechanisms that can change TE amounts in successive generations, such as transposition, excision, or recombinational elimination, we created a‘naïve’ model in which the segregation of parental chromosomes in selfed progenies was simu-lated. The null hypothesis implies that: (i) cross-polli-nated parental plants were initially heterozygous for the content of TEs in the homologues; (ii) only the random segregation of homologues in meiosis during male and female gametogenesis leads to a change in TE copy number in inbred offspring. For modeling we took only the G13 genotype as the genotype with a stable chromosome number, and only the dynamics of Class I elements were simulated.
We carried out 100 realizations for stochastic time course simulations of copy numbers in spikes and leaves across ten generations. Thus, the copy numbers in leaves and spikes were calculated in 100 simulated siblings of each generation of plants, and these 100 simulated siblings
from each of the first three plant generations form the generation-specific basic distributions of copy numbers in leaves and spikes. The deviations of copy numbers in real siblings from the basic simulated distributions, separately in leaves and spikes, test the null hypothesis.
The significance of deviations in each generation was calculated by a t-test and the non-parametric Mann-Whitney U test (Table S7 in Additional file 2). The sig-nificance results of two tests are in good mutual concor-dance. Taking this into consideration, the F-test statistics were used for significance estimation of the cumulative deviation in positive or negative directions of real data from simulated siblings across three genera-tions for each type of TE separately. The F statistic is:
FWmax /Wmin
whereWmaxandWminare eitherWpor Wndepending on which one is larger. The statisticWpis defined as the sum of squares either of real t-test values, if t-test is
positive, or alternative expected positivet-tests (a small value for Q25 left quantile oft-test value distribution), if the realt-test is negative:
Wpt testP12( , )r a t testP22( , )r a t testP32( , )r a
Similarly:
Wn t testN12( , )r a t testN22( , )r a t testN32( , )r a
Statistics WpandWnare chi-square distributed with degrees of freedom equaling three each. Thus, the F-test has (3,3) degrees of freedom. The test shows how corro-borative t-test directions and values are across three plant generations for the particular TE type. The + and - logP values of this F-test statistic across TE types are shown in Figure 4e. The sign of the logP value reflects the voting oft-tests either up (Wmax=Wp;Wmin=Wn) or down (Wmax = Wn; Wmin =Wp) from simulations. Thus, long down bars indicate significant cumulative deviation of real data down from simulations across three plant generations.
The graph (Figure 4e) shows that copy numbers of all TE types besides Daniela in leaves of G13 were signifi-cantly downregulated in relation to the simulations, but this is not true for spikes. The explanation could be that
a high TE copy number in the male gametes of the ori-ginal plant infers a generally high simulated level of copy numbers in spikes and leaves. However, a plant could survive only if the TE copy number is relatively low in diploid cells, permitting, however, a high copy number in gametes. Thus, plants with high copy num-bers, both in gametes and diploid cells, will be elimi-nated from the population, providing the observed difference between real copy numbers in gametes and in diploid cells for survivors.
Morphological and karyotypical changes in successive generations
Ae. speltoides is a dimorphic species appearing in nat-ural populations as two morphotypes or subspecies;Ae. speltoides ssp. ligusticaand Ae. speltoides ssp.aucheri. The aucheritype is characterized by cylindrical spikes with widely interspersed spikelets. The apical spikelet is awned, and the rachis is tough. The ligustica type is characterized by denser, two-rowed ears in which the lateral spikelets are also awned and the rachis is brittle (Figure 1b). Significant morphological and karyotypic abnormalities in successive generations were observed, particularly: reduction of spike awns, appearance of intermediate ligustica-aucheri phenotypes, abnormal quantity of spikelets and florets, and spike size reduction (Figure 1b).
Figure 4Principle component analysis (PCA).(a)PCA analysis: spikes versus leaves for transposable element (TE) copy number changes over the generations, normalized by the TS-84 control.(b)PCA analysis: two groups of TE, spike active and leaf active.(c)Second principal
component (PC2)-based order of TE activation.(d)Normalized and centralized patterns of the three genotypes forSpelt 52and TEs across tissues and generations.(e)Deviations of real copy numbers in leaves and spikes from the stochastic model.
Belyayevet al.Mobile DNA2010,1:6
http://www.mobilednajournal.com/content/1/1/6
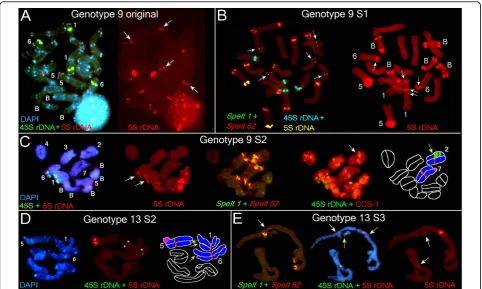
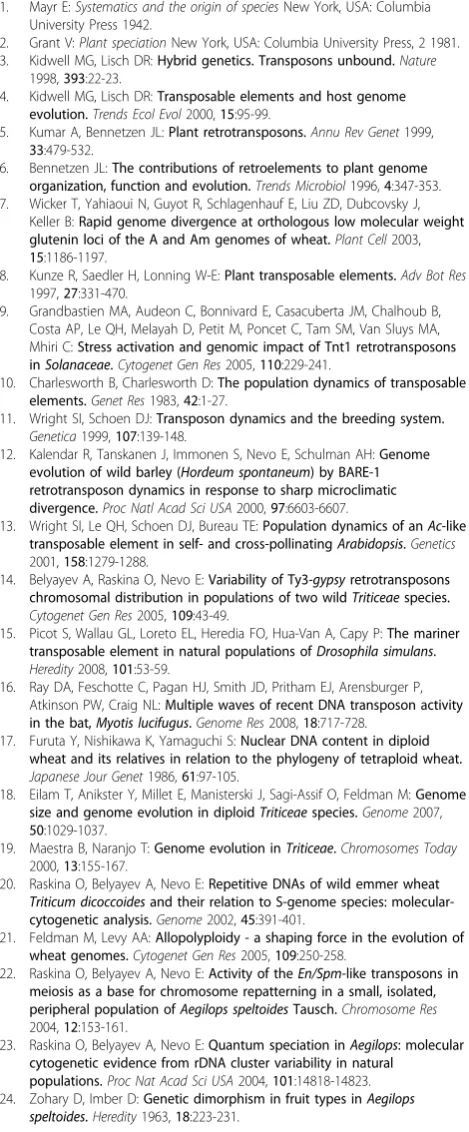
For karyotypic analysis we used several chromosomal markers in fluorescent in situ hybridization (FISH) experiments: 5S rDNA and 45S rDNA probes, cereal centromere-specific sequence 1 (CCS-1) [28], species-specificSpelt 1[29] and tribe-specificSpelt 52[30] tan-dem repeats. These probes were used for chromosome identification and localization of chromosomal rearran-gements. The genomic formulas for the investigated plants were as follows: G9 (2n = 14 + 3B), G9 S1 to S2 (2n = 14 + 5B), G13, S1 to S3 (2n = 14), G14 (2n = 14 + 2B), G14 S1 (2n = 14 + 3B), G14 S2 (2n = 14 + 4B), and G14 S3 (2n = 14 + 3B) (Figures 5 and 6).
Dynamics of Spelt 1, Spelt 52, and 5S rDNA clusters in successive generations revealed by FISH
Cytogenetical analysis revealed dramatic differences between genome organizations of plants from the
Kishon population in comparison with TS-84 plants representing the center of theAe. speltoidesdistribution. First, Kishon plants lost a majority of species-specific tandem repeatSpelt 1, which appears usually as a com-ponent of terminal adenine and thymine (AT) -rich het-erochromatic blocks in both arms of almost all chromosomes in TS-84 (Figure 6d). Only one or two terminal clusters of Spelt 1 per diploid genome were revealed in all studied genotypes, which means that up to 97% of the clusters were eliminated (Figure 5b, c, e and Figure 6c, Table 1). We observed a similar picture forSpelt 52distal clusters: 57% to 82% were eliminated in genotypes from the Kishon population (Figures 5 and 6, Table 1). Thus, the amount of Spelt 1is 13 times lower and Spelt 521.5 times lower than in the control genotype TS-84 from the center of the species
distribution. These data show that in the marginal Kishon population a high ratio of recombination occurs in terminal and distal chromosomal regions. Evidently, terminal clusters ofSpelt 1 are the primary targets for deletions, followed by distally locatedSpelt 52 clusters. To the extent that chromosome termini have a similar structure (AT-rich heterochromatic bands enriched with clusters ofSpelt 1and/or Spelt 52 tandem repeats and TEs), they could be involved not only in homologous but also in heterologous recombination followed by chromosomal rearrangements. In the Kishon population we observed an irreversible elimination of terminal, spe-cies-specific Spelt 1 tandem repeats and a significant reduction of the distal, tribe-specific tandem repeat
Spelt 52 as a result of high rates of homologous and heterologous recombination in this small inbred population.
FISH experiments revealed that a significant increase or decrease in copy number might happen without change in the cluster quantity. For example, we traced a significant reduction inSpelt 52copy number from the
G9 original plant to G9 S2 (Figure 1a), while cluster numbers increase from 9 to 11 in S1 and drop again to 9 in S2 (Table 1). In spikes of G14 S2 9,200 copies of
Spelt 52are shared between 9 clusters while in S3 only 3,800 copies are assigned to 10 chromosomal clusters (Table 1 and Additional file 1). The dynamics of Spelt 52clusters in G14 are as follows: the G14 original line, 10 clusters; G14 S1 to S8; G14 S2 to S9; and G14 S3 to S10 clusters per diploid genome. However, the chromo-somal distribution of Spelt 52clusters significantly dif-fers between these genotypes. Thus, both homologues of chromosome 6 carrySpelt 52clusters in the long arms of the original (Figure 6a) and S1 plants, while no clus-ters were detected (that is, all clusclus-ters have been deleted) as early as in S1 (not shown), S2, and S3 (Fig-ure 6a and 6b). One homologue of chromosome 5 in the G14 original plant carries two clusters in the hetero-zygote in the long arm, where the second cluster is a result of translocation (Figure 6a). In S1 and S2 only one cluster still exists in the heterozygote, which pro-vides evidence for deletion of a second cluster as a
Figure 6Fluorescencein situhybridization (FISH) and differential staining with 4’,6-diamidino-2-phenylindole (DAPI) on somatic and meiotic chromosomes ofAegilops speltoides(part 2).(a)From left to right: DAPI and FISH with the CCS-1 and 45S rDNA on the meiotic chromosomes of the original G14 plant; FISH withSpelt 52andSpelt 1. The clusters ofSpelt 1that mark a homozygous paracentric inversion on chromosome 4, and aSpelt 1cluster on the B chromosome are arrowed. FISH with 5S rDNA and 45S rDNA on the same chromosomes. A scheme of the main chromosomal rearrangements.(b)FISH withSpelt 52andSpelt 1on the meiotic chromosomes of the G14 S2 plant (left). The clusters ofSpelt 1that mark a homozygous paracentric inversion on chromosome 4 and cluster ofSpelt 52that marks a heterozygous inversion on the chromosome 5 are arrowed. FISH with 5S rDNA and 45S rDNA (middle). B chromosomes carry 5S rDNA clusters in both arms. The scheme of the main chromosomal rearrangements (right).(c)FISH withSpelt 52andSpelt 1on the meiotic chromosomes of the G14 S3 plant (left). Homozygous paracentric inversion on chromosome 4 is arrowed. FISH with 5S rDNA and 45S rDNA on the same chromosomes (right).(d)Somatic chromosomes of TS 84, staining with DAPI (left). FISH withSpelt 52andSpelt 1on the same chromosomes (right). The DNA probes and staining:(a-d)5S rDNA,Spelt 52and cereal centromere-specific sequence 1 (CCS-1) in red; 45S rDNA andSpelt 1in green; differential staining with DAPI in blue;(a)5S rDNA (yellow) and 45S rDNA (blue) in pseudocolors.
Belyayevet al.Mobile DNA2010,1:6
http://www.mobilednajournal.com/content/1/1/6
result of, most probably, homologous recombination. Thereafter, in S3, both homologues carrySpelt 52 clus-ters in the long arms, which is in accordance with
sim-ple chromosome segregation (Figure 6b, c).
Chromosome 4 in the original plant is heterozygous for theSpelt 52cluster due to a deletion in the 4L, while in S1 to S3 both homologues are normal and carry Spelt 52clusters in the long arms, which might have occurred by simple inheritance. Therefore, the number of Spelt 52clusters in successive generations follows chromoso-mal segregation, while copy number abundance of this tandem repeat in each successive genome is subject to amplification or reduction as a consequence of homolo-gous and/or heterolohomolo-gous recombination in distal or terminal chromosomal regions.
We traced similar tendencies for 5S rDNA. The num-ber of clusters and the copy numnum-ber are not correlated. The abundance of 5S rDNA jumped from 8,000 in the original plant up to 14,500 copies in G9 S1 spikes and thereafter dropped to 9,000 in S3. At the same time, the number of B chromosomes which carry additional 5S sites, and through which we can propose 5S rDNA copy number change, was three in the G9 original plant and five in S1 and S2 generations. The numbers of
additional 5S rDNA sites (four in total) in chromosomes 1 and 6 were constant in G14 successive generations (Table 1 and Additional file 1, Figure 1a); consequently, their impact on total 5S rDNA copy number abundance, including regular 5S rDNA clusters on chromosome 5 could be a function of intracluster amplification or reduction.
The occurrence of additional 5S rDNA clusters on both homologues of chromosomes 1 and 6 in the nucleolar organizing regions (NORs) in the G13 S3 plant requires special discussion (Table 1, Figure 5e). Additional 5S rDNA clusters on chromosomes 1 and 6 and the cluster inheritance and elimination in successive generations were reported previously [22,23]. In contrast to G9 and G14, there were no extranumerary 5S rDNA sites in the G13 original plant, and we selected this gen-otype as a representative sample having the normal chromosomal number of 2n = 14 (no B chromosomes) and two normal 5S rDNA clusters on chromosome 5. There were no additional 5S rDNA clusters in chromo-somes 1 and 6 in the offspring in S1 and S2 (Table 1): thus, 5S rDNA clusters arise in the S3 generation. An insignificant variation in 5S rDNA copy number from S2 to S3 provides evidence for genesis of additional 5S Table 1 Number ofSpelt 1, Spelt 52, and 5S ribosomal DNA (rDNA) clusters and percentage of major chromosomal rearrangements per diploid genome in studied genotypes
Genotype Spelt 1 Spelt 52 Inversions
(paracentric and pericentric)
Translocations B chromosomes 5S rDNA (chromosomes 5, 1, 6, B
chromosomes)
Sum Deletions terminal % Sum Deletions distal % Sum % Sum % Sum Sum %
Norm* 28 0 28 0 0 0 0 0 0 2 100
TS 84 26 7.14 18 35.71 2 7.14 0 0 0 2 100
G9 original 2 92.86 9 67.86 0 0 2 7.14 3 12 600
G9 S1 2 92.86 11 60.71 0 0 1 3.57 5 16 800
G9 S2 2 92.86 9 67.86 2 7.14 1 3.57 5 16 800
G13 original 2 92.86 12 57.14 1 3.57 2 7.14 0 2 100
G13 S1 1 96.43 12 57.14 0 0 2 7.14 0 2 100
G13 S2 2 92.86 6 78.57 2 7.14 2 7.14 0 2 100
G13 S3 1 96.43 6 82.14 2 7.14 2 7.14 0 6 300
G14 original 2 92.86 10 64.29 2 7.14 0 0 2 10 500
G14 S1 2 92.86 8 71.43 0 0 2 7.14 3 12 600
G14 S2 2 92.86 9 67.86 1 3.57 2 7.14 4 14 700
G14 S3 2 92.86 10 64.29 2 7.14 2 7.14 3 12 600
*Norm = each chromosome in diploid genome (2n = 14, 28 chromosome arms) potentially carries 1Spelt 1and 1Spelt 52cluster in each arm (that is, 28 clusters in total ofSpelt 1equated to 100%, and 28 clusters ofSpelt 52equated to 100%). Deficiency of 1Spelt 1cluster (that is, single terminal deletion per 28 chromosome arms) equated to 3.57%, the same as deficiency of oneSpelt 52cluster (single distal deletion) equated to 3.57% per diploid genome.
Inversions and translocations: single inversion or translocation per 28 chromosome arms equated to 3.57%. Markers for inversions: CCS-1, telomeric probe,Spelt 1, Spelt 52, and AT-positive heterochromatic bands.
Normally chromosome 5 carries one 5S rDNA cluster (two clusters per diploid genome equated to 100%).
Extranumerary B chromosomes regularly carry one 5S rDNA cluster in each arm, thus a single B chromosome adds two 5S rDNA clusters per diploid genome accordingly.
Chromosomes 1 and 6 could carry additional 5S rDNA clusters in homozygote and heterozygote, consequently each among them could add a single additional 5S rDNA cluster, from one to four clusters per diploid genome.
rDNA clusters as a result of simultaneous heterologous recombination involving chromosomes 1, 6, and 5 [22,23]. In the genotypes studied, a number of inver-sions and translocations were also revealed. Major chro-mosomal rearrangements are shown in Table 1.
Comparison of TE dynamics and karyotypic events Despite the fact that fluctuations in copy number are TE-family specific, we can specify at least one common tendency. The maximum copy number dropped in spikes for a majority of TEs, exceptWilma, which was detected in the S2 generation (Figure 1a, Additional file 1), strongly correlating with the increase in chromoso-mal rearrangements and particularly with distal or term-inal deletions of Spelt 52 clusters and AT-rich heterochromatic blocks (Table 1, Figures 5 and 6). For G14 this peak partly shifted to S1 because the original plant was already self-pollinated for at least one genera-tion. This may be related to a homozygous inversion in chromosome 4 (Figure 6a). Most probably, not only the quantity of chromosomal rearrangements, but also their peculiarities (that is, a pericentric inversion on chromo-some 2 in G9 S2 causes semi-sterility; non-reciprocal translocation in chromosome 5, plus two deletions on chromosomes 1 and 6 in G13 S2; or deletion plus inver-sion in the chromosome 5 in G14 S2, and so on) signifi-cantly affect the whole genome.
Discussion
TE dynamics over time
When we traced the dynamics of TEs over three rounds of selfing, it was discovered that various families of TEs vary tremendously in copy number between individuals from the same population and the selfed progenies, and that fluctuations in copy number are TE-family specific (Additional file 1, Figures 1a and 4b, c). This was espe-cially true in generative tissues at the stage of male gametogenesis, where a greater than sixfold change in a single generation was seen for Sabrina elements, for instance. In vegetative tissues, the maximum increase observed was only twofold (Wilmaelements). We pro-pose that, more than the differences between tissues, this phenomenon reflects differences between the alter-nating sporophyte and gametophyte generations.
The gametophyte generation in higher plants is pro-duced following many clonal, somatic divisions, unlike in animals, but in virtually all cases (except plants such asKalanchoe pinnata) the leaf does not contribute to the production of the gametophyte. We carried out principal component analysis (Figure 4a) and normaliza-tion of TE copy number by non-TE sequences (5S rDNA) and by the number of TEs in the control popu-lation from the center of the species distribution (Figure 4d). These analyses revealed that the abundance of TE families as a group was almost constant across
generations in the sporophyte, whereas the TE copy numbers in gametophytes reached a minimum at the S2 generation and a maximum at the S3 generation. The latter correlates with karyotypic change (Figures 5 and 6). Modeling of TE copy number temporal dynamics also showed that, in gametophytes, the observed amount of retroelements in the progeny of a single genotype cannot be accounted for by simple chromosomal inheri-tance, but requires additional mechanisms (Figure 4e).
Therefore, at least a part of the variation observed in TE abundance can be explained by TE activation and subsequent insertion of new copies and by specific loss of integrated TEs. The IRAP display data, in particular the appearance of unique novel bands, are consistent with TE activation. In IRAP, the insertion of a retrotran-sposon near another creates a new template for PCR amplification. IRAP data and cloning of the unique IRAP bands make it possible to propose that a small percentage of TEs that increase in copy number are transpositionally active and can actually insert at novel locations serving as abona fidemutagen.
We were unable to estimate TE abundance per indivi-dual pollen mother cell or monitor the impact of each chromosomal mutation in the total TE dynamic and morphological changes in individual plants. Moreover, the real pattern of chromosomal abnormalities is likely to be much more complex than we can recognize using a limited number of chromosomal markers (Table 1, Figures 5 and 6). Nevertheless, two kinds of chromoso-mal mutations that occur simultaneously in the same anther, genome-specific and cell-specific mutations, could be recognized in male gametogenesis. The latter could reach approximately 3% to 8% per anther (that is, per single cytological slide containing 20 to 40 well spread cells appropriated for analysis) [22]. Evidently, selection against deleterious mutations additionally reduces our possibility for analysis: we lose a set of data with a number of lethal genotypes in each inbreed generation.
The surviving plants showed a range of cytological changes, and the observed changes in TE abundance could reflect the loss or gain of chromosomal segments that differ in their complement of TEs. We applied a set of non-TE markers (5S rDNA, Spelt 1, and Spelt 52) that could be followed both cytologically and by their copy number in order to separate TE activity from chro-mosomal aberrations and reorganization per se. It is very likely that distal or terminal deletions of heterochroma-tin and intracluster copy number reduction ofSpelt 52
and 5S rDNA tandem repeats physically causes a total decrease in TE amount. As it was repeatedly shown, dif-ferent types of transposons are clustered in and around ribosomal sites. TEs form chromosomal miniclusters in euchromatin, and also comprise a huge part of the Belyayevet al.Mobile DNA2010,1:6
http://www.mobilednajournal.com/content/1/1/6
heterochromatin (for review see [31]). Any TE cluster could be considered as an additional target for homolo-gous and heterolohomolo-gous recombination that may cause full or partial deletions of heterochromatic blocks enriched with TEs [32]. In this way chromosomal rear-rangements may affect TE copy numbers. Regarding the extranumerary B chromosomes, we could not separate their affect on TE dynamics from other chromosomal abnormalities [33-36]. Our data set does not show a dis-tinct correlation between an increase in the number of B chromosomes and a simultaneous jump in the TE copy number. The precise TE content of B chromo-somes is unknown. In this work we explored only 9 of the TEs from more than 100 that were found for Ae. speltoidesin the GenBank and Triticeae Repeat (TREP) databases. Nevertheless, a certain correlation could be seen. In G9, for instance, increasing B chromosomes from 3 to 5 correlate with significant increase of copy number of WIS2, Daniela, Fatima, and En/Spm ele-ments in S2 (Figure 1, Additional file 1). In the next generation repetitive DNAs of B chromosomes serve as additional targets for illegitimate recombination, which is proposed as the main driving force behind genome size decrease [37]. Thus, one event (increase of B chro-mosomes) induces the other (illegitimate recombination) as a response, and this correlates with a decrease of copy number of the several elements. For G14 these trends are not seen so distinctly, perhaps because B chromosome numbers do not change so significantly.
Plant architecture is very highly multigenic. In Ae. Speltoides, differences in spike morphology were pro-posed to be encoded by tightly linked genes with a
dom-inance of ligustica over aucheri [38]. Some
chromosomal rearrangements may target gene com-plexes, even if these rearrangements are in the heterozy-gote. This assumption is supported by very significant changes in spike morphology of G13 S2 and G 14 S2 (Figure 1b). Reduction of spike size, reduction of awns, and duplicated floret numbers prove that the gene com-plex encoding spike morphology is affected. Evidently, these morphological changes could be re-established in the next generation, as is seen for G14 S3, due to chro-mosomal segregation and selection against the majority of the deleterious aberrations. In other cases, these dis-orders could be even more profound in the next genera-tion, as we see in G13 S3 (Figure 1b). The particular loci responsible for the spike morphology variations we discuss have not yet been positionally cloned. Further-more, there are numerous potential mechanisms by which TE expression or integration might affect the expression of the genes determining plant architecture. These range from insertional activation in promoters or coding regions to readthrough induction of RNA inter-ference (RNAi) effects to epigenetic mechanisms,
including TE-targeted methylation islands. What role(s) TEs play in chromosome structure, aside from general correlations between TE abundance and heterochroma-tization on the one hand, or the role of specialized telo-meric TEs in telomere structure on the other hand [39,40] are still unknown. TheBrca1gene [41] presents a striking example in humans of how a defective repair mechanism can be associated both with TE activation and with chromosomal aberrations, as well as phenoty-pic changes; however, the cause and effect relationships among these phenomena, even given a clear etiology, are not trivial.
Possible mechanisms of TE activation
The data raise two key questions: what induces the mass amplification of TE following selfing, and what are the consequences of this process forsuccessive generations? The TEs, particularly retrotransposons, are well known to be activated by biotic and abiotic stress [42-44]. A reduction in DNA methylation is likewise known to activate TEs [45]. McClintock, furthermore, referred to ‘genome shock’as an activator of TEs [46]; the phenom-ena we have observed in Aegilops mirror her descrip-tions. Taking these strands together, TE may be activated globally through chromatin hypomethylation or more specifically via changes in the expression of transcriptional or other interacting cellular factors. The observation that not all TEs were activated in spikes supports the latter interpretation.
Consequences of TE activation
Fluctuations in TE copy number may reflect propaga-tion without fixapropaga-tion. For a new TE inserpropaga-tion to be heri-table, it must occur in a cell clonally giving rise to a germ cell. Of the TE families we examined, WIS2, Wham, Sabrina, andWilmawere the most spike-active, showing the highest levels of copy number change in the gametophyte, whereas Fatima, Daniela, Sukkula, Cassandra, and En/Spm showed the greatest fluctua-tions from generation to generation in leaves. The var-ious steps of the retrotransposon life cycle, from transcription of mRNA to integration of cDNA, are likely involving interactions with cellular proteins. The distinct behavior of these two groups of retrotranspo-sons may reflect differences in these interactions.
of solo LTRs [47], and by illegitimate recombination [37]. Ultimately, the fate and fixation of new TE inser-tions depends on events not only at the level of the nucleus, but also at the population level.
In natural plant populations, TE dynamics may be associated with changes in pollination direction [11,48]. Under critical external conditions, outcrossing plants very often transit to self-pollination [25,26,49,50]. We have observed transitions between cross-pollination and self-pollination not only in Ae. speltoides, but also in closely related Ae. sharonensisas well as in Hordeum spontaneum (unpublished results). We simulated this process by artificially transiting cross-pollinated plants of Ae. speltoidesto self-pollination in the greenhouse. Inbreeding in plants [51] and Drosophila[52] can have diverse physiological and phenotypic consequences, which have been hypothesized to derive from the epige-netic effects of pairing interactions between chromo-somes [53]. Epigenetic changes may in turn lead to TE activation, which is associated with high rates of karyo-typic change [6], genetic variation (though limited in marginal populations) and epigenetic alteration, an important source for phenotypic variability [54]. Some of these mutations could be heritable [22,23,55]. It is therefore tempting to hypothesize that the TE activation we observed might be a primary or secondary effect of the mating system change, though substantiating evi-dence is still lacking.
Theory predicts that it is difficult for a genetic variant to become fixed except in small, inbred populations [56]. Population size reduction increases the probability of fixation of deleterious mutations [57] and also leads to genome diversification via the accumulation of mole-cular changes [58]. Moreover, smaller population sizes may facilitate the passive accumulation of TE insertions [59]. From 2000 to 2005, the population under study here decreased threefold in size. It is also essential to note that this population is located on the southern edge of the species range, where it is under abiotic stress. These stresses, therefore, may simultaneously activate TEs directly, increase self-fertilization and thereby set off the phenomena we observed here, and limit population size, increasing the likelihood of the fixation of genomic changes. The combination of genetic and epigenetic alterations with karyotypic change allows species with plastic genomes to survive as new forms or possibly species under intensive environmental pressure.
Methods
Plant material and DNA extraction
Individual spikes of cross-pollinatedAe. speltoides(2n = 14) were collected in the year 2000 from the Kishon populations. The population is small (approximately 100 m2) and represents the southern extent of the species
range.Ae. speltoidesis a dimorphic species (ssp.aucheri
and ssp. ligustica) (Figure 1b), and the differences in spike morphology are controlled by a block of closely linked genes [24,38]. Analysis of spike size, the morphol-ogy of glumes (presence or absence of the keel tooth), and the degree of lateral awn expression (for ssp. ligus-tica) revealed significant intrapopulation morphological variability in Ae. speltoides, which guided cytogenetical screening thereafter.
Based on previous cytogenetic data, we selected three original plants ofAe. speltoidesfor further investigation, each from different spikes. Earlier data showed that some siblings can carry chromosomal abnormalities and extranumerary B chromosomes [22,23]. Thus, we expected that extranumerary B chromosomes and other chromosomal rearrangements could appear in the off-spring of the chosen maternal genotypes. Phenotypically, genotype 9 (G9) exhibitedligusticafeatures, while geno-types 13 (G13) and 14 (G14) were confirmed as the
aucheritype (Figure 1b).
Young spikes (two to five, depending on individual plant vigor) at the male gametogenesis stage (when spikes are approximately two-thirds to three-quarters of a flag leaf) were selected for meiotic chromosome analy-sis and, at the same time, for DNA extraction. We used total DNA from two sources, one from young leaves and the other from spikes at the microsporogenesis stage, extracted by the cetyltrimethylammonium bro-mide (CTAB) method. The DNA showed equal purity and quality from all samples. At the same time, other spikes from the same plants were used for meiotic chro-mosome analysis, and the rest of the spikes were selfed in order to produce seeds for the next generation. Plants ofAe. speltoidesssp.aucheriTS-84 (Latakia, Syria), from the center of the species range, were used as controls. TE sequence sources and primer design
Sequences of transposable elements were taken from the TREP database (see Table S3 in Additional file 2; [60]). For each TE family, sequence accessions were aligned and conservation assessed with the multiple alignment procedure of MULTALIN [61]. The conserved segments of the LTR or internal domain of the retrotransposons were used for the design of PCR primers, which was carried out with the program FastPCR [62]. We designed several primer pairs for each repeated element or TE to compare the efficiency and reproducibility of amplification. None of the primer pairs that were cho-sen formed dimers and all show high PCR efficiency. The chosen primers match motifs sufficiently conserved to allow amplification of almost all TE family members in the genome.
PCR and IRAP methods
For molecular genetic procedures we used standard pro-tocols. IRAP analysis was made according to Kalendar Belyayevet al.Mobile DNA2010,1:6
http://www.mobilednajournal.com/content/1/1/6
and Schulman [27]. Protocol details and primer sets for quantitative real-time PCR, long-range PCR, dot blot hybridization and analysis, and IRAP can be found in the Tables S4-S6 in Additional file 2, and in Supplemen-tal methods in Additional file 2. A toSupplemen-tal of 20 unique IRAP bands were cloned and sequenced (see Table S2 in Additional file 2, Figures 2 and 3).
Data normalization and centralization
We used three types of data normalization (Figure 4). In the first, the temporal dynamics of nine TE and two non-TE sequences (Spelt 52 and 5S rDNA) at the S1, S2, and S3 generations were contrasted with the tem-poral dynamics of the same TE in the control genotype (TS-84). The normalization was tissue and TE-specific: leaves against leaves and spikes against spikes. Thus, the ratio of copy numbers measures the effect of TE activity in the genotype under study regarding activity of the same TE in the control genotype. The second type of data normalization applied to the temporal dynamics of the TE as a group, and served to evaluate the data with respect to one of the non-TE sequences from the same generation and tissue. The third method of normaliza-tion applied was a combinanormaliza-tion of the first two: first by tissue and TE against control plants, and then against non-TE sequences from the same generation and tissue. To centralize a pattern of temporal dynamics for an individual TE, we subtracted the pattern for non-TE sequences from that of the TE at each tissue and gen-eration point.
Principal component analysis
The temporal pattern of TE copy number by tissue, gen-eration, and genotype was represented by the vector of the normalized copy number for the control genotype over time for the 9 TE and 2 non-TE sequences (11 values; Figure 4a-c). For the other dimension, the pat-tern of TE copy number dynamics for each TE and non-TE sequence was represented by its 16 control-nor-malized activities across genotype, generation, and tis-sue. The 2-dimensional PCA space covers 85% of control normalized data variability and this space has a good representation of the distribution of genotypes, generations, and tissues in 11-dimensional original space (and distribution of 9 TE and 2 non-TE sequences in 16-dimensional dual space).
The stochastic simulation of TE-specific copy numbers in leaves and spikes across plant generations
The distribution of copy numbers of different TEs in spikes and leaves across generations of the G13 geno-type was contrasted with the computationally simu-lated distribution of TE copy numbers. For each TE type separately, the stochastic model starts from spikes with equal distribution of TEs over fragments of seven paternal and seven maternal chromosomes in prophase
I of male and female meiosis, when synapsis and cross-over occur. The TE copy number in male gametes (pollen mother cells (PMC)) was estimated according to observed copy numbers in spikes and leaves of the original plant under the assumption that each spike contains 50% of diploid cells (before telophase I) and 50% of haploid male gametes when four daughter cells are formed, each having only one recombinant chro-mosome of each homologous pair. Thus, the average copy number in spike’s male gametes (M1) was calcu-lated as follows:
S0(F0M0M1) /3
where S0 is the measured total TEs copy number in spikes of original plant; F0, TE copy number in maternal haplome; M0, in paternal haplome; M1, in male gametes (PMCs).
The measured TE copy number in leaves (L0) is an average of two haploid genomes: maternal (F0) and paternal (M0). Therefore:
L F M or
F M L
0 0 0 2
0 0 2 0
( ) / ,
As a result:
3S0 2 L0M1
and, finally M1 is estimated as:
M1 3 S0 2 L0
The F1 TEs copy number in female gametes could be estimated as L0 on average because this haplome con-tains one parent recombinant chromosome set.
selection is equivalent to selection of 7 × 10 fragments out of 28 × 10 fragments after the stochastic crossover. After determining M2 and F2 copy numbers, S1 and L2 were estimated as above, and S2 plus L3 were estimated after simulation of the next generation. The further gen-erations were simulated according to the same template. Chromosome spread preparation, probe labeling, in situ hybridization, detection, and differential staining procedures
Forin situhybridization experiments, 2 to 3 cytological slides (that is, 2 to 3 individual anthers) containing 20 to 50 well spread chromosomal plates at the diakinesis or metaphase I stage were used. The rest of the spikes were selfed in order to produce seeds for the next gen-eration. To prevent contamination, these spikes were bagged at least 5 to 7 days before pollination. Chromo-some procedures were as described previously [22,23]. Protocol details can be found in the Supplemental meth-ods in Additional file 2 (see also [63]).
Additional file 1: Transposable element (TE) copy numbers in three self-pollinated generations of three genotypes from the Kishon population ofAe. speltoides.
Click here for file
[ http://www.biomedcentral.com/content/supplementary/1759-8753-1-6-S1.DOC ]
Additional file 2: Various. Supplementary methods. Quantitative real-time polymerase chain reaction (PCR) and relative quantification. Long distance PCR for transposable elements (TEs). Dot blot hybridization and analysis. Inter-retrotransposon amplified polymorphism (IRAP) for TE transposition. Cloning and sequencing of unique IRAP bands. Chromosome spread preparation, probe labeling, in situ hybridization, detection, and differential staining procedures. Table S1. Relative TE copy numbers in sibs of explored genotypes. Table S2. Sequences with new TE insertions. Table S3. Transposable element accessions. Table S4. Specific primers and primer sets forAegilops speltoidesTEs, 5S ribosomal RNA (rRNA) genes andSpelt 52tandem repeats. Table S5. Primer combinations for quantitative PCR. Table S6. Primers for IRAP analysis. Table S7. The significance of deviations in each generation via thet-test and non-parametric Mann-Whitney U test.
Click here for file
[ http://www.biomedcentral.com/content/supplementary/1759-8753-1-6-S2.DOC ]
Acknowledgements
The authors are most grateful to Avraham Levy, Eduard Akhunov, Abraham Korol and anonymous reviewers for helpful comments. This work is supported by grants from the Israel Science Foundation for AB and OR (grant number 723/07) and from the Academy of Finland (project 207484) for RK.
Author details 1
Institute of Evolution, University of Haifa, Mount Carmel, Haifa, Israel.2MTT/ BI Plant Genomics Laboratory, Institute of Biotechnology, Viikki Biocenter, University of Helsinki, Helsinki, Finland.3Plant Genomics, Biotechnology and Food Research, MTT Agrifood Research, Jokioinen, Finland.
Authors’contributions
AB, EN, AS and OR conceived and designed the experiments. AB, RK and OR performed the experiments. AB, RK, LB, AS and OR analyzed the data. AB, LB, AS and OR wrote the paper.
Competing interests
The authors declare that they have no competing interests.
Received: 1 June 2009
Accepted: 1 February 2010 Published: 1 February 2010
References
1. Mayr E:Systematics and the origin of speciesNew York, USA: Columbia University Press 1942.
2. Grant V:Plant speciationNew York, USA: Columbia University Press, 2 1981. 3. Kidwell MG, Lisch DR:Hybrid genetics. Transposons unbound.Nature
1998,393:22-23.
4. Kidwell MG, Lisch DR:Transposable elements and host genome evolution.Trends Ecol Evol2000,15:95-99.
5. Kumar A, Bennetzen JL:Plant retrotransposons.Annu Rev Genet1999,
33:479-532.
6. Bennetzen JL:The contributions of retroelements to plant genome organization, function and evolution.Trends Microbiol1996,4:347-353. 7. Wicker T, Yahiaoui N, Guyot R, Schlagenhauf E, Liu ZD, Dubcovsky J,
Keller B:Rapid genome divergence at orthologous low molecular weight glutenin loci of the A and Am genomes of wheat.Plant Cell2003,
15:1186-1197.
8. Kunze R, Saedler H, Lonning W-E:Plant transposable elements.Adv Bot Res 1997,27:331-470.
9. Grandbastien MA, Audeon C, Bonnivard E, Casacuberta JM, Chalhoub B, Costa AP, Le QH, Melayah D, Petit M, Poncet C, Tam SM, Van Sluys MA, Mhiri C:Stress activation and genomic impact of Tnt1 retrotransposons inSolanaceae.Cytogenet Gen Res2005,110:229-241.
10. Charlesworth B, Charlesworth D:The population dynamics of transposable elements.Genet Res1983,42:1-27.
11. Wright SI, Schoen DJ:Transposon dynamics and the breeding system.
Genetica1999,107:139-148.
12. Kalendar R, Tanskanen J, Immonen S, Nevo E, Schulman AH:Genome evolution of wild barley (Hordeum spontaneum) by BARE-1 retrotransposon dynamics in response to sharp microclimatic divergence.Proc Natl Acad Sci USA2000,97:6603-6607.
13. Wright SI, Le QH, Schoen DJ, Bureau TE:Population dynamics of anAc-like transposable element in self- and cross-pollinatingArabidopsis.Genetics 2001,158:1279-1288.
14. Belyayev A, Raskina O, Nevo E:Variability of Ty3-gypsyretrotransposons chromosomal distribution in populations of two wildTriticeaespecies.
Cytogenet Gen Res2005,109:43-49.
15. Picot S, Wallau GL, Loreto EL, Heredia FO, Hua-Van A, Capy P:The mariner transposable element in natural populations ofDrosophila simulans.
Heredity2008,101:53-59.
16. Ray DA, Feschotte C, Pagan HJ, Smith JD, Pritham EJ, Arensburger P, Atkinson PW, Craig NL:Multiple waves of recent DNA transposon activity in the bat,Myotis lucifugus.Genome Res2008,18:717-728.
17. Furuta Y, Nishikawa K, Yamaguchi S:Nuclear DNA content in diploid wheat and its relatives in relation to the phylogeny of tetraploid wheat.
Japanese Jour Genet1986,61:97-105.
18. Eilam T, Anikster Y, Millet E, Manisterski J, Sagi-Assif O, Feldman M:Genome size and genome evolution in diploidTriticeaespecies.Genome2007,
50:1029-1037.
19. Maestra B, Naranjo T:Genome evolution inTriticeae.Chromosomes Today 2000,13:155-167.
20. Raskina O, Belyayev A, Nevo E:Repetitive DNAs of wild emmer wheat
Triticum dicoccoidesand their relation to S-genome species: molecular-cytogenetic analysis.Genome2002,45:391-401.
21. Feldman M, Levy AA:Allopolyploidy - a shaping force in the evolution of wheat genomes.Cytogenet Gen Res2005,109:250-258.
22. Raskina O, Belyayev A, Nevo E:Activity of theEn/Spm-like transposons in meiosis as a base for chromosome repatterning in a small, isolated, peripheral population ofAegilops speltoidesTausch.Chromosome Res 2004,12:153-161.
23. Raskina O, Belyayev A, Nevo E:Quantum speciation inAegilops: molecular cytogenetic evidence from rDNA cluster variability in natural
populations.Proc Nat Acad Sci USA2004,101:14818-14823. 24. Zohary D, Imber D:Genetic dimorphism in fruit types inAegilops
speltoides.Heredity1963,18:223-231.
Belyayevet al.Mobile DNA2010,1:6
http://www.mobilednajournal.com/content/1/1/6
25. Darwin CD:On the origin of species by means of natural selection, or preservation of favoured races in the struggle for life.London, UK: John Murray 1859.
26. Stebbins GL:Adaptive radiation of reproductive characteristics in angiosperms. 1. Pollination mechanisms.Ann Rev Ecol Syst1970,
1:307-326.
27. Kalendar R, Schulman AH:IRAP and REMAP for retrotransposon-based genotyping and fingerprinting.Nat Protoc2006,1:2478-2484. 28. Aragon-Alcaide L, Miller T, Schwarzacher T, Reader S, Moore G:A cereal
centromere sequence.Chromosoma1996,105:261-268.
29. Salina EA, Pestsova EG, Vershinin AV:Spelt1 - new family of cereal tandem repeats.Russian J Genet1997,33:352-357.
30. Anamthawat-Jonsson K, Heslop-Harrison JS:Isolation and characterization of genome-specific DNA sequences inTriticeaespecies.Mol Gen Genet 1993,240:151-158.
31. Raskina O, Barber JC, Nevo E, Belyayev A:Repetitive DNA and chromosomal rearrangements: speciation-related events in plant genomes.Cytogenet Gen Res2008,120:351-357.
32. Belyayev A, Raskina O, Nevo E:Chromosomal distribution of reverse transcriptase containing retroelements in twoTriticeaespecies.
Chromosome Res2001,9:129-136.
33. Mendelson D, Zohary D:Behaviour and transmission of supernumerary chromosomes inAegilops speltoides.Heredity1972,29:329-339. 34. Zarchi Y, Hillel J, Simchen G:Supernumerary chromosomes and chiasma
distribution inTriticum speltoides.Heredity1974,33:73-180.
35. Puertas MJ:Nature and evolution of B chromosomes in plants: a non-coding but information-rich part of plant genomes.Cytogenet Gen Res 2002,96:198-205.
36. Jones N, Houben A:B chromosomes in plants: escapees from the A chromosome genome?.Trends Plant Sci2003,8:417-423.
37. Devos KM, Brown JK, Bennetzen JL:Genome size reduction through illegitimate recombination counteracts genome expansion in
Arabidopsis.Genome Res2002,12:1075-1079.
38. Sears E:Amphidiploids in the seven-chromosomeTriticinae.Univ Missouri Agric Exper Sta Res Bull1941,336:1-46.
39. Danilevskaya O, Slot F, Pavlova M, Pardue ML:Structure of theDrosophila
HeT-A transposon: a retrotransposon-like element forming telomeres.
Chromosoma1994,103:215-224.
40. Castro JP, Carareto CM:Drosophila melanogasterP transposable elements: mechanisms of transposition and regulation.Genetica2004,121:107-118. 41. Turner JM, Mahadevaiah SK, Fernandez-Capetillo O, Nussenzweig A, Xu X,
Deng CX, Burgoyne PS:Silencing of unsynapsed meiotic chromosomes in the mouse.Nat Genet2005,37:41-47.
42. Ansari KI, Walter S, Brennan JM, Lemmens M, Kessans S, McGahern A, Egan D, Doohan FM:Retrotransposon and gene activation in wheat in response to mycotoxigenic and non-mycotoxigenic-associatedFusarium
stress.Theor Appl Genet2007,114:927-937.
43. Wessler SR:Turned on by stress. Plant retrotransposons.Curr Biol1996,
6:959-961.
44. Kashkush K, Feldman M, Levy AA:Transcriptional activation of retrotransposons alters the expression of adjacent genes in wheat.Nat Genet2003,32:102-106.
45. Cheng C, Daigen M, Hirochika H:Epigenetic regulation of the rice retrotransposonTos17.Mol Genet Genomics2006,276:378-390.
46. McClintock B:The significance of responses of the genome to challenge.
Science1984,226:792-801.
47. Shirasu K, Schulman AH, Lahaye T, Schulze-Lefert P:A contiguous 66 kb barley DNA sequence provides evidence for reversible genome expansion.Genome Res2000,10:908-915.
48. Charlesworth D, Charlesworth B:Transposable elements in inbreeding and outbreeding populations.Genetics1995,140:415-417.
49. Lewis H:The mechanism of evolution in the genusClarkia.Evolution 1953,7:1-20.
50. Moeller DA, Geber MA:Ecological context of the evolution of self-pollination inClarkia xantiana: population size, plant communities, and reproductive assurance.Evolution2005,59:786-799.
51. Kelly JK:Family level inbreeding depression and the evolution of plant mating systems.New Phytol2005,165:55-62.
52. Kristensen TN, Sorensen P, Pedersen KS, Kruhoffer M, Loeschcke V:
Inbreeding by environmental interactions affect gene expression in
Drosophila melanogaster.Genetics2006,173:1329-1336.
53. Grant-Downton RT, Dickinson HG:Plants, pairing and phenotypes - two’s company?.Trends Genet2004,20:188-195.
54. Rapp RA, Wendel JF:Epigenetics and plant evolution.New Phytol2005,
168:81-91.
55. Liu ZL, Han FP, Tan M, Shan XH, Dong YZ, Wang XZ, Fedak G, Hao S, Liu B:
Activation of a rice endogenous retrotransposonTos17in tissue culture is accompanied by cytosine demethylation and causes heritable alteration in methylation pattern of flanking genomic regions.Theor Appl Genet2004,109:200-209.
56. Husband BC:Chromosomal variation in plant evolution.Am J Bot2004,
91:621-625.
57. Ohta T:Near-neutrality in evolution of genes and gene regulation.Proc Natl Acad Sci USA2002,99:16134-16137.
58. Lynch M, Conery JS:The origins of genome complexity.Science2003,
302:1401-1404.
59. Flowers JM, Purugganan MD:The evolution of plant genomes: scaling up from a population perspective.Curr Opin Genet Dev2008,18:565-570. 60. REP database.http://wheat.pw.usda.gov/ggpages/ITMI/Repeats/index.shtml. 61. MULTILAN.http://npsa-pbil.ibcp.fr/cgi-bin/npsa_automat.pl?page=/NPSA/
npsa_multalinan.html.
62. FastPCR.http://www.biocenter.helsinki.fi/bi/programs/fastpcr.htm. 63. Belyayev A, Raskina O:Heterochromatin discrimination inAegilops
speltoidesby simultaneous genomicin situhybridization.Chromosome Res1998,6:559-565.
doi:10.1186/1759-8753-1-6
Cite this article as:Belyayevet al.:Transposable elements in a marginal plant population: temporal fluctuations provide
new insights into genome evolution of wild diploid wheat.Mobile DNA
20101:6.
Submit your next manuscript to BioMed Central and take full advantage of:
• Convenient online submission
• Thorough peer review
• No space constraints or color figure charges
• Immediate publication on acceptance
• Inclusion in PubMed, CAS, Scopus and Google Scholar
• Research which is freely available for redistribution