Simple online algorithm for detecting cow’s ECG beat-to-beat
interval using a microcontroller
Tiusanen, M. Johannes
1*, Pastell, Matti
2(1 Department of Agricultural Sciences, University of Helsinki, P.O Box 28, FI-00014 University of Helsinki, Finland
2 Natural Resources Institute Finland (Luke), Green Technology, Viikinkaari 4, FI-00790, Helsinki, Finland)
Abstract: This paper describes an online algorithm for detecting cow’s beat-to-beat interval on a small embedded microcontroller. The target device is an ECG implant which only provides limited calculation power and insufficient storage memory for long term complete ECG data logging. No common computationally efficient method for detecting the human R-wave was found successful for cattle ECG data with the used measurement configuration. Our algorithm detects a cow’s S-wave, which is the most distinguishable part of the QRS-complex. The offset and amplitude adaptive algorithm utilizes only arithmetic operations and logic conditions.
Keywords: cow, ECG, HRV, detector.
Citation: Tiusanen, M. J., and M. Pastell. 2016. Simple online algorithm for detecting cow’s ECG beat-to-beat interval using a microcontroller. Agric Eng Int: CIGR Journal, 18(1):411-418.
1 Introduction
1Heart rate variability is recognized as an interesting
parameter for studying welfare of cattle (von Borell et al.,
2008). It has been used to study for instance the stress
level of cows in different milking systems (Gygax et al.,
2008; Hagen at al. 2005), temperament of cow (Frondelius
et al. 2015), and dehorning pain in calves (Stewart et al.,
2009).
However, measuring electrocardiogram (ECG) with
surface electrodes in normal production environments is
very impractical and the measurements are generally noisy
(Chen et al. 2000). Our research group has been working
on an implantable ECG device for measuring heart rate
variability in dairy cows (Riistama and Vuorela, 2011).
The aim of this study was to develop a simple and fast
real-time algorithm for detecting beat-to-beat intervals
from bovine ECG measured with an implantable device.
This would enable the device to only store the interval
Received date: 2015-09-09 Accepted date: 2015-12-10
*Corresponding author: Tiusanen, M.J. Department of Agricultural Sciences, University of Helsinki, P.O Box 28, FI-00014 University of Helsinki, Finland Email: [email protected]
times instead of raw ECG reducing the storage space
considerably. The implantable measurement device, on
which the algorithm will be embedded on, has a 16-bit
ultralow power RISC microcontroller running at 8 MHz
clock speed (Riistama and Vuorela, 2011).
As the highest possible ADC speed will be 340 Hz,
the detector algorithm must execute in much less than 3
ms. This leads to a high demand of simplicity in the
algorithm computation. After testing several simple
derivative based methods developed for human ECG
(Friesen et al. 1990) with poor performance we developed
our own method. In more complex existing algorithms
the baseline wander is often removed by higher arithmetic
methods, such as ensemble averaging, finite impulse
response filters or cubic splines (Jane et al., 1992). A
derivative high-pass filter is more suitable considering our
target application, where peak timing is essential but true
voltage values insignificant.
This paper demonstrates the development and
operation of the developed algorithm using ECG measured
with surface electrodes.
2.1 Data collection
Surface ECG was recorded from 11 cows using
portable Embla titanium recorder device that weighed 0.3
kg and measured 12 cm × 8 cm × 3 cm (Embla Titanium,
Embla Systems Inc., Broomfield, USA). The cables,
mobile recording device and a counter-weight were fixed
to the udder holder on the back of the cow. Ten curves
were recorded at 256 Hz and 4 curves at 512 Hz. The
cows were kept free in individual pens (3 m × 3 m) during
the recording.
The cows were moved and restrained in a pen used
normally for veterinary purposes and prepared for the
experiment. The left side of the cows behind the
shoulders was first shaved with clippers and afterwards
with a manual razor. The shaved area (left side 15 cm ×
30 cm was cleaned with a liquid disinfectant.
The positive ECG electrode was placed on the left
side of the cow over the heart area at the level of the
elbow and over the 5th intercostal space, the negative
electrode was placed 10 cm above it vertically, and the
ground electrode was placed caudally of the horn base.
The used connection corresponds to the one used in
the implantable device.
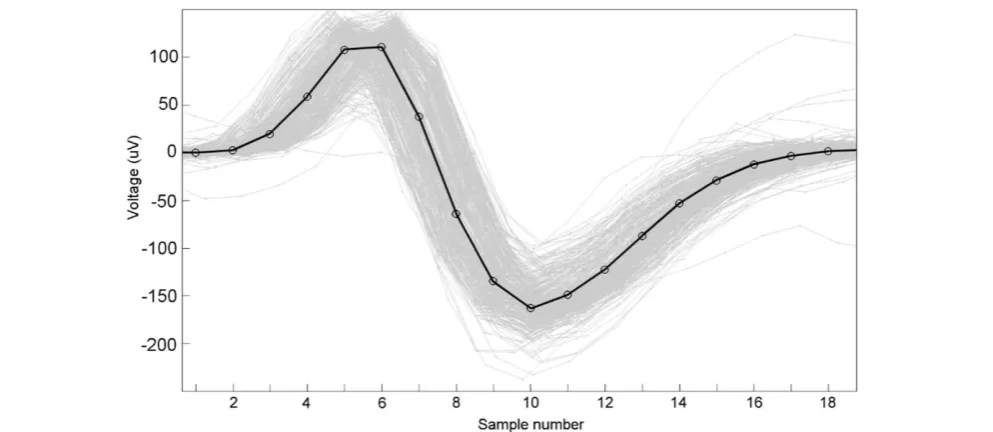
2.2 Cow’s QRS-complex
The shape of the QRS-complex (Figure 1) depends
on both the individual animal and the installation of the
implant. The Q-wave was not detectable in any of our
measurements but to avoid confusion we still use the
well-established abbreviation ―QRS‖. The R-wave,
when present at all, is also too weak to be distinguished
from relaxation waves such as the T-wave, which is higher
in amplitude. In some cows the R-wave did not rise
above the noise level at all. The S-wave is the most
specific component of the ECG data and was thus chosen
as the target for the detection algorithm. Similar
observations and thorough explanations on lactating
Holstein cow ECG can be found in (Deroth, 1980). This
is why we refer to the SS-interval instead of the commonly
used term ―successive RR-interval‖ (Tiusanen et al., 2015).
2.3 The algorithm
The intended embedded platform would allow quite
heavy calculations, but we decided to apply only
multiplication, division, addition, subtraction and logical
conditions in order to serve even lower-level future
devices.
A simple pace error detector assisted us during
algorithm development and parameter tuning by giving a
preliminary count of detection errors. The final
evaluation was performed by counting and classifying
every heart beat manually.
Both the amplitude and the baseline of our ECG
recordings were unstable. Reliable S-peak detection
required an adaptive algorithm. Therefore the algorithm
includes simple amplitude monitoring and baseline
tracking.
2.3.1 Amplitude monitoring
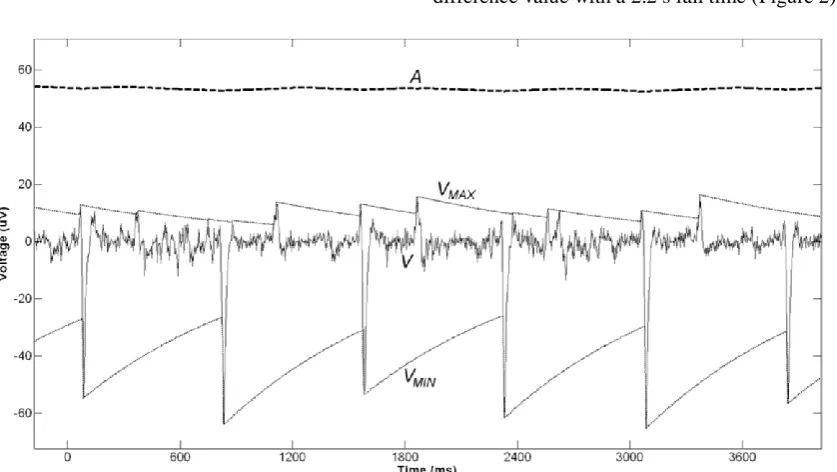
The amplitude A (μV) was calculated as the
difference between the highest positive and the lowest
negative voltage values by Equation (1) whenever a new
voltage sample VNEW is measured.
MIN MAX OLD MIN NEW MIN MAX NEW MAX V V f A f A f V V V f V V V / 1 / 1 1 / 1 1 , min / 1 1 , max (1)where VMAX is the positive and VMIN the negative
envelopes, AOLD the previously calculated amplitude value
(μV) and f the sampling frequency (Hz).
The envelope values are multiplied by 1 - 1/f to give
them a sampling frequency independent 2.2 s fall time
towards zero. The old amplitude value AOLD has the
weight 1-1/f over the present envelope difference weight
1/f. Thereby A moves towards the present envelope
difference value with a 2.2 s fall time (Figure 2).
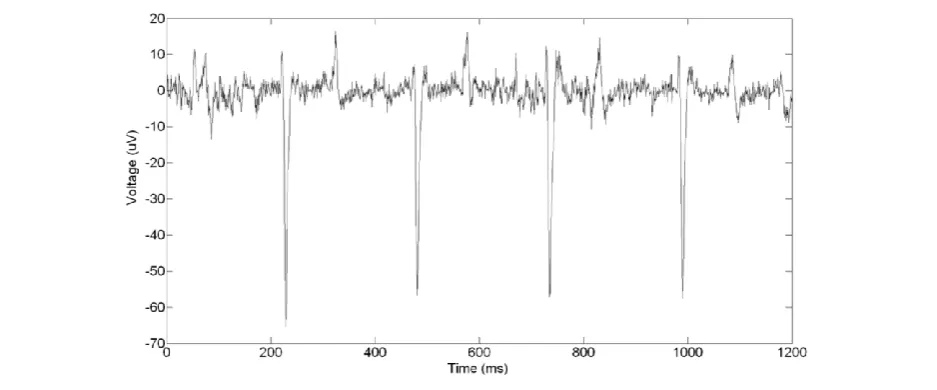
2.3.2 Signal normalization
The baseline tracker is a custom high-pass filter,
which simultaneously increases the signal dynamics and
calculates the baseline B by the four steps in Equation (2).
B V V B B d V V p A f V V p d OLD NORM B OLD V OLD NEW B B OLD NEW V V / / 2 (2)where dV is the amplified square of the derivate, pV
the amplification coefficient for the difference, VNEW and
VOLD the newest and previous voltage sample values (μV)
respectively, f the sampling frequency (Hz), A the
amplitude (μV), ∆B the step change in the baseline (μV), B
and BOLD the present and previous baselines (μV)
respectively and VNORM the normalized voltage sample
(μV).
Fast changes in VNEW input result in a high dV value
which forces ∆B close to zero and the baseline level B will
not change. On the other hand, B level will follow all
slow VNEW changes (Figure 3). Appropriate tuning of
coefficients pV and pB produce a VNORM curve where the
QRS-complex remains sharp but most of other waves are
attenuated (Figure 4).
In some occasions the input V changes very little, dV
gets values close to zero, ∆B becomes excessively high
and produces a large step in B. For this reason we
limited ∆B to 5% of the amplitude per sample. This
value does not affect filter response but prevents undesired
steps in B when unpredicted cases such as disturbance in
the signal occur.
2.3.3 S-peak detection trigger
The actual triggering of the S-wave is a difference
formula similar to those evaluated in (Friesen et al. 1990).
A one-sample difference is too sensitive to noise and
causes false alarms. The duration of the falling S-wave for
a cow (as seen in Figure 1) is 15-18 ms. We found 15 ms
to be the best differencing time to detect the S-wave
reliably but to not react on noise or T-waves. At our
sampling frequency 256 Hz this means differencing over 4
samples. This interval must be adjusted for every f.
The S-wave trigger T is the square of the difference
over four samples dT in relation to the amplitude A in
Equation (3). Squaring improves dynamics which
reduces false trigs. For our data, the S-wave has started
when T > 0.02.
2
) 4 ( )
(
/
4 /
A d T
V V
d
T
i NORM i
NORM T
(3)
2.3.4 Peak location search time
Once the condition T > 0.02 is met, the algorithm will
keep searching for the lowest VNORM value for 300 ms.
This search time allows a heart rate as high as 200 Figure 3 The raw ECG input VNEW and the tracked baseline B.
beats/min without multiple S-waves occurring during the
search. The search time is not critical to the algorithm
performance, but a long search is beneficial in noisy signal
analysis since it gives the algorithm the opportunity to find
the S-wave bottom peak even if triggered by a false T
alarm. On the downside, if noise amplitude exceeds the
signal, faulty peaks will be detected. Once the peak is
detected, new triggering is prohibited until 300 ms has
elapsed from the S-wave peak.
2.4 Validation
We developed the algorithm using complete ECG
curves from 11 individual cows and by programming the
detector into a MATLAB graphical user interface. The
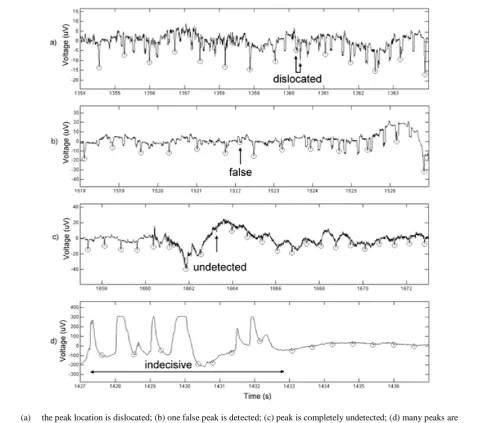
detector errors were divided into four categories, which
are presented in the examples in Figure 5.
Since the primary application will be the comparison
of lying time HRV we recorded 14 complete 10 min ECG
curves from 10 individual cows during lying time. 10
curves were recorded at 256 Hz and 4 curves at 512 Hz.
After executing the detector program we counted all
detection errors and classified them according to Figure 5.
The errors were found from the large data by evaluating
every peak where the successive SS-interval was more
than 30 ms. Most of these peaks were correctly detected,
but this approach reduced the amount of hand work.
(a) the peak location is dislocated; (b) one false peak is detected; (c) peak is completely undetected; (d) many peaks are indecisive on whether the detector works correctly or not
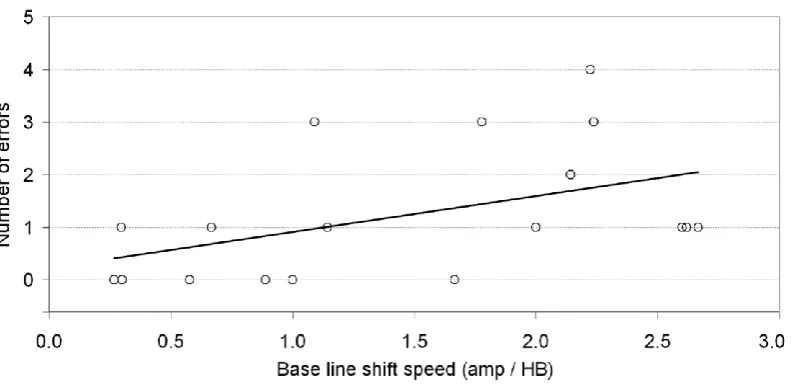
The detector performance was also evaluated during
cow’s free movement in an individual pen. All the
examples in Figure 5 are from these recordings. The
baseline would shift up to 10 amplitudes during only a few
heart beats but always returned to the zero level. Since
the baseline shifts clearly hampered the detector
performance, we evaluated 20 such cases and classified
the baseline shift speed visually as in Figure 6 in order to
estimate the baseline shift influence on detection errors.
Our device also picked up different kinds of
interference. In Figure 5 the RFID reader induction
pulses can be noticed in the right hand part in Figures 5a
and 5b. Where the pulses were higher in amplitude than
the actual S-waves, they corrupted these periods of the
data into the indecisive category. These sections of data
were not evaluated in detail.
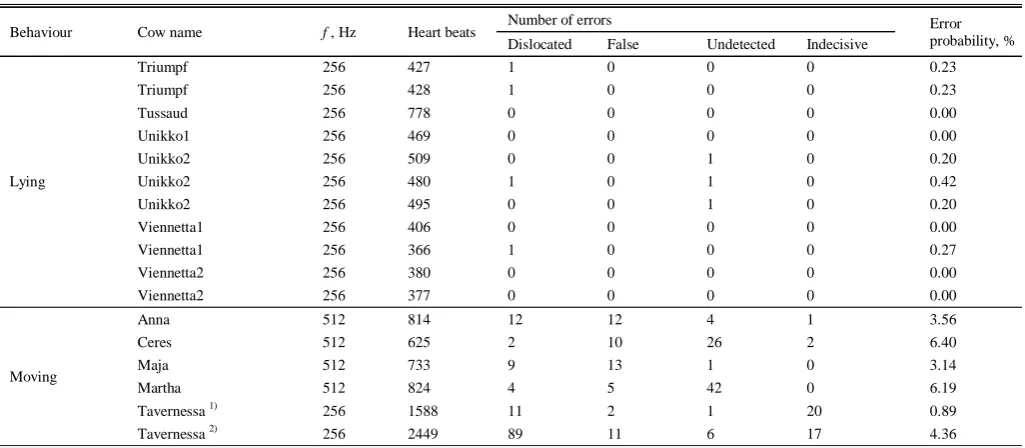
3 Results
Table 1 presents the results from the error
calculations. The detector algorithm performs very well on
the lying time ECG. Only 7 of all the 5115 heart beats
were misinterpreted. The performance becomes much
worse once the cows start moving in the barn. An
average 3.7% of the heart beats go wrong, when the
indecisive beats are excluded.
Figure 6 Example of baseline shift speed, which is 2 amplitudes per beat interpreted visually from the data
Table 1 ECG detection algorithm validation results
Behaviour Cow name f , Hz Heart beats Number of errors Error
probability, % Dislocated False Undetected Indecisive
Lying
Triumpf 256 427 1 0 0 0 0.23
Triumpf 256 428 1 0 0 0 0.23
Tussaud 256 778 0 0 0 0 0.00
Unikko1 256 469 0 0 0 0 0.00
Unikko2 256 509 0 0 1 0 0.20
Unikko2 256 480 1 0 1 0 0.42
Unikko2 256 495 0 0 1 0 0.20
Viennetta1 256 406 0 0 0 0 0.00
Viennetta1 256 366 1 0 0 0 0.27
Viennetta2 256 380 0 0 0 0 0.00
Viennetta2 256 377 0 0 0 0 0.00
Moving
Anna 512 814 12 12 4 1 3.56
Ceres 512 625 2 10 26 2 6.40
Maja 512 733 9 13 1 0 3.14
Martha 512 824 4 5 42 0 6.19
Tavernessa 1) 256 1588 11 2 1 20 0.89
Tavernessa 2) 256 2449 89 11 6 17 4.36
According to the simple baseline shift test (Figure 7)
a shift slower than 1 amplitudes per heart beat causes
errors only randomly. When the baseline shifts faster
than 2 amp/HB, it is likely for the detector to make one or
several errors.
4 Discussion
We have successfully developed a new algorithm for
detecting beat-to-beat intervals from cattle ECG that can
run on a resource constrained implant. The algorithm
performs well during rest, but the detection performance
decreases on surface recordings during movement. The
developed algorithm worked for all of the tested cows,
whereas the tested human algorithms from Friesen et al.
(1990) were completely unable to detect the R or S wave
for most of the animals in the dataset.
We found that the amplitude of the R-peak in cow
ECG is very small as compared to humans. This is in
accordance to the findings in (Tiusanen et al. 2015;
Marques, 2008; Rezakhani, 1980). Therefore we focused
on detecting the SS-interval which is a lot less susceptible
to noise.
Eventually the changes in HRV will be monitored by
comparing measurements during cow’s lying times. This
excludes many problems concerning muscular EEG
interference and sensor movement. Therefore the
detector algorithm was primarily validated using ECG
data measured from lying animals. Further, the implant
measurements have less noise than surface measurements
that were used for the algorithm development.
The dT could be restricted to negative values, but we
did not find it necessary. A noise figure could be used to
adjust T threshold and search time.
In noisy conditions a too fast drop in V could be
excluded from triggering the search, since it probably is
distortion instead of an S-wave. This would still not help
detecting a heartbeat occurring simultaneously with the
disturbance.
5 Conclusions
The developed algorithm can be used to record
beat-to-beat intervals from adult cows in real time using
an implantable ECG monitor. The algorithm is included in
MATLAB based graphical user interface for simple use in
animal welfare research.
Acknowledgements
We would like to acknowledge the Finnish Ministry
of Agriculture and Forestry for funding this project as part
of Remowel-project.
References
Chen, W., N. Tetsu, T. Kobayashi, T. Saito, E. Kasuya, and Y. Honda. 2000. ECG and heart rate detection of prenatal
cattle foetus using adaptive digital filtering. In Proc. 22nd Annual International Conference of the IEEE, 2:962-965. Engineering in Medicine and Biology Society.
DeRoth, L. 1980. Electrocardiographic Parameters in the Normal Lactating Holstein Cow. Canadian Veterinary Journal, 21(10): 271–277.
Friesen, G. M., T. C. Jannett, M. A. Jadallah, S. L. Yates, S. R. Quint and H. T. Nagle. 1990. A Comparison of the Noise Sensitivity of Nine QRS Detection Algorithms. IEEE Transactions on Biomediacal Engineering, 37(1):85–98. Frondelius, L., K. Järvenranta, T. Koponen, and J. Mononen. 2015.
The effects of body posture and temperament on heart rate variability in dairy cows. Physiology and Behavior 139:437-441.
Gygax, L., I. Neuffer, C. Kaufmann, R. Hauser, and B. Wechsler. 2008. Restlessness Behaviour, Heart Rate and Heart-Rate Variability of Dairy Cows Milked in Two Types of Automatic Milking Systems and Auto-Tandem Milking Parlours. Applied Animal Behaviour Science, 109(2-4):167-179.
Hagen, K., J., Langbein, C. Schmied, D. Lexer, and S. Waiblinger. 2005. Heart Rate Variability in Dairy cows—influences of Breed and Milking System. Physiology and Behavior, 85(2):195-204.
Jane, R., P. Laguna, N. V. Thakov, and P. Caminal. 1992. Adaptive Baseline Wander Removal: Comparative Analysis With Cubic Spline Technique (Published Conference Proceedings style), in Proc. IEEE Computers in Cardiology. Durham, pp. 143–146.
Marques. F. J. 2008. Cardiac arrhythmias in large animal species: Is it worth worrying about? Large Animal veterinary rounds 8(5): 1-6.
Rezakhani, A., A. A. Paphan, and S. Shekarfroush. 2004. Analysis of base apex lead electrocardiograms of normal dairy cows. Veteniarski arhiv, 74(5): 331–358.
Riistama, J., and T. Vuorela. 2011. Implantable measurement device to assist in determining the psychophysiological well-being of dairy cattle, Presented at the Biomed 2011 Int. Conf. Biomedical Engineering, Innsbruck, Austria. Stewart, M. J., M. Stookey, K. J. Stafford, C. B. Tucker, A. R.
Rogers, S. K. Dowling, G. A. Verkerk, A. L. Schaefer, and J. R. Webster. 2009. Effects of Local Anesthetic and a Nonsteroidal Antiinflammatory Drug on Pain Responses of Dairy Calves to Hot-Iron Dehorning. Journal of Dairy Science, 92(4): 1512-1519.
Tiusanen, M. J., M. I. Hautala, E. M. Ternman, and M. E. Pastell. 2015. Geometrical method for interpolating S-peaks from cow ECG using a microcontroller. Biosystems Engineering, 129: 324-328.