ISSN: 2374-2380 (Print), 2374-2399 (Online) Copyright © The Author(s). 2015. All Rights Reserved. Published by American Research Institute for Policy Development DOI: 10.15640/jpbs.v3n1a6 URL: http://dx.doi.org/10.15640/jpbs.v3n1a6
Can Satisfy with Life People be Unwilling to Live?
Associate Professor Aist
ė Diržytė
1Abstract
Positive psychology is an umbrella term for models and exploration about what makes life most worthy living. Even though positive experiences such as a satisfied life are among the central concerns of positive psychology, no studies were conducted to evaluate whether people, who express unwillingness to live, still can experience positive emotions and states, for example, gratitude, compassion, or happiness. Many countries in the world are considering legislation on suicide with help, and there is an opinion that a person who chooses death can reflect on his situation constructively, and he is still capable to experience positive emotions. From psychological point of view, could it be said that people unwilling to live should have a right not to live (even more, should be helped not to live) as they still can judge critically and their decisions are not emotionally biased? According to the latest statistics (2012) from the World Health Organization, 61, 3 men and 10, 4 women per 100,000 inhabitants commit suicide in Lithuania annually. Therefore, we have chosen highest suicide rates in Europe manifesting Lithuanian population as a target group; moreover, Lithuanians’ cognitions towards life and death as well as unwillingness to live still have not been explored thoroughly. This paper presents some results of the survey (representative sample, n=1002) which was conducted in Lithuania in February – April 2014. Based on the findings of various authors, the research aimed at exploring the link between unwillingness to live, certain attitudes towards life and emotional states. The present study showed that unwillingness to live is statistically significantly related to negative emotional states and cognitions. Therefore, regarding the suicides with help, the opinion that a person who chooses death can reflect on his situation constructively, and he is still capable to experience positive emotions, is not evidence – based. Nonetheless, supplementary research is needed to explore further the different factors contributing to unwillingness to live which is a sign of diminished psychological wellbeing.
Keywords: unwillingness to live, emotional states, suicides
1. Introduction
Positive psychology is an umbrella term for models and exploration about what makes life most worthy living (Seligman & Csikszentmihalyi, 2000). Even though positive experiences such as a satisfied lifeare among the central concerns of positive psychology (McCullough & Snyder, 2000; Seligman, 2002), no studies were conducted to evaluate whether people who express unwillingness to live, still can experience positive emotions and states, for example, gratitude, compassion, or peace. Many countries in the world are considering legislation on suicide with help, and there is an opinion that a person who chooses death can reflect on his situation constructively, and he is still capable to experience positive emotions. Is that really so? Could it be said that a person who is unwilling to live still can judge constructively about life and make critical decisions? Wouldn’t these decisions be emotionally biased? Life satisfaction reflects the individual’s appraisal of his or her life as a whole (Diener, 2000). Could a person, who is satisfied with life, be unwilling to live? Could this person keep positive attitudes towards life? Research shows that high life satisfaction correlates with the absence of psychological problems such as depression (e.g., Furr & Funder, 1998; Lewinsohn, Redner, & Seeley, 1991).
1
Furthermore, individuals who are satisfied with life are good problem–solvers, and tend to be more resistant to stress (Frisch, 2000; Beethoven, 1989). Therefore, from psychological point of view, could it be said that people unwilling to live should have a right not to live (even more, should be helped not to live) as they still can judge critically and their decisions are not emotionally biased? According to the latest statistics (2012) from the World Health Organization, 61, 3 men and 10, 4 women per 100,000 inhabitants commit suicide in Lithuania annually. Therefore, we have chosen highest suicide rates in Europe manifesting Lithuanian population as a target group; moreover, Lithuanians’ cognitions towards life and death as well as unwillingness to live still have not been explored thoroughly. Based on the findings of various authors we aimed at exploring the link between unwillingness to live, certain attitudes towards life and emotional states. Furthermore, we aimed at analyzing socio-demographic variables related to unwillingness to live.
2. Aim
This study aimed to explore how Lithuanians’ unwillingness to live is associated with positive life perceptions (statements) and different emotional states.
3.Method
3.1. Samples and Procedure
This study used a test design utilizing a heterogeneous random sample of 1002 persons representing Lithuanian population. All the participants were personally asked to participate in the study and were personally interviewed at their home in February – April 2014. This research was funded by the European Social Fund under the Global Grant measure (No. VP1-3.1-ŠMM-07-K-03-032).The interview of one person on average took up to 60 minutes. The sample was selected in a multiscaled probabilistic way so that every citizen of Lithuania might have an equal probability to be interviewed. The data were collected in 20 cities and 29 villages of Lithuania. The subjects of the study were 469 men (46,8 percent) and 533 (53,2 percent) women. Additional demographics of the sample included a mean age of 49.29 years (Minimum – 18 years old, Maximum – 90 years old, Std. Deviation – 16,206). The majority of the participants were married (48,9 percent), some respondents lived with a partner (9,7 percent), some indicated they are separated (12,2 percent), some were widows (13,8 percent) or lived alone (12 percent). The mean height of the respondents was 170, 93 cm (Minimum – 142 cm, Maximum – 205 cm, Std. Deviation – 8,99), and the mean weight was 77,37 kg. (Minimum – 42 cm, Maximum – 270 cm, Std. Deviation – 16,699); the mean BMI of Lithuanians in this research was 26.33. The majority of respondents have a higher education (51,4 percent), but some have just primary (2,7 percent) or secondary (6,5 percent) education. The income of the interviewed Lithuanians per family is distributed as follows (not including taxes): the income of the majority of the sample (44,7 percent) is just 500 dollars or less per month, some (37,4 percent) get 501-1000 dollars per month, some (13,3 percent) get 1001-2000 dollars per month, and just a minority (2,2 percent) get more than 2000 dollars per month, with some of them (0,1 percent) reaching up to 6500 dollars per month.
3.2. Measures
The measures used in this study included:
1) Positive, Negative and Suicidal risk related states scale. To assess specific states of Lithuanian population, we have created
Table 1: Varimax-Rotated Factor Loadings of the Positive, Negative, and Suicidal States
(Past Week Instructions, n = 1002)
Negative states
Pique ,734
Anger ,774
Anxiety ,776
Psychological pain ,677
Guilt ,513
Sadness ,706
Fear ,604
Stress ,690
Suicidal risk related states
Unwillingness to live ,854
Hopelessness ,808
Helplessness ,747
Meaninglessness ,801
Shame ,486
Positive states
Joy ,816
Gratefulness ,826
Enthusiasm ,869
Trust ,867
Confidence ,880
Compassion ,711
Hopefulness ,878
Happiness ,889
Peacefulness ,801
Rotation Method: Varimax with Kaiser Normalization.
Positive, Negative and Suicidal risk related states scale’s subscales demonstrated acceptable reliability in this study: Positive states subscale’s (9 items) Cronbach’s alpha for this sample was = .94, Negative states subscale’s (8 items) Cronbach’s
alpha for this sample was = .90, Suicidal risk related states subscale’s (5 items) Cronbach’s alpha for this sample was = .89 (n=1002).
2) Life Perceptions scale. To assess Lithuanians’ attitudes towards life, we have created a 8 – item questionnaire based on
4.Results
Table 2 displays frequencies of unwillingness to live during the last week of Lithuanian population’s representative sample (n=1002). Almost 70 percent of respondents never experienced unwillingness to live during the last week, but more than 7 percent felt this way from “often” to “always and very strongly”.
Table 2: Frequencies of Lithuanian Population Representative’s Sample Unwillingness to live during the last week (n=1002)
N %
Never 694 69,3%
Almost never 149 14,9%
Rarely 79 7,9%
Often 38 3,8%
Almost always 17 1,7%
Always, very strongly 16 1,6%
Not answered 9 ,9%
Total 1002 100,0%
Table 3: Frequencies of Unwillingness to live during the last week of Lithuanian Population’s Representative Sample (n=1002) in Relation to Gender, age, Living area, Marital Status, and Children
Never Almost
never
Rarely Often Almost
always Always, strongly Not answer-red Total
Gender Male N 325 76 33 14 9 6 6 469
% 69,3% 16,2% 7,0% 3,0% 1,9% 1,3% 1,3% 100,0%
Female N 369 73 46 24 8 10 3 533
% 69,2% 13,7% 8,6% 4,5% 1,5% 1,9% ,6% 100,0%
Age Up to 29 yrs. N 116 14 9 6 1 1 1 148
% 78,4% 9,5% 6,1% 4,1% ,7% ,7% ,7% 100,0%
30-39 yrs. N 106 20 11 3 2 2 1 145
% 73,1% 13,8% 7,6% 2,1% 1,4% 1,4% ,7% 100,0%
40-49 yrs. N 144 23 9 6 5 6 2 195
% 73,8% 11,8% 4,6% 3,1% 2,6% 3,1% 1,0% 100,0%
50-59 yrs. N 154 39 22 11 2 3 1 232
% 66,4% 16,8% 9,5% 4,7% ,9% 1,3% ,4% 100,0%
60-69 yrs. N 96 25 20 3 3 3 3 153
% 62,7% 16,3% 13,1% 2,0% 2,0% 2,0% 2,0% 100,0%
70 and more yrs. N 78 28 8 9 4 1 1 129
% 60,5% 21,7% 6,2% 7,0% 3,1% ,8% ,8% 100,0%
Living area Countryside, rural area
(less than 3000 citizens)
N 200 55 28 13 3 6 3 308
% 64,9% 17,9% 9,1% 4,2% 1,0% 1,9% 1,0% 100,0%
Village (from 3000 to 5000 citizens)
N 14 4 1 2 21
% 66,7% 19,0% 4,8% 9,5% 100,0%
City (from 5000 to 80000 citizens)
N 121 45 31 14 7 5 3 226
% 53,5% 19,9% 13,7% 6,2% 3,1% 2,2% 1,3% 100,0%
Kaunas, Klaipėda, Šiauliai, Panevėžys
N 216 36 12 6 3 3 2 278
% 77,7% 12,9% 4,3% 2,2% 1,1% 1,1% ,7% 100,0%
Vilnius (capital, >400000 citizens)
N 143 9 7 3 4 2 1 169
% 84,6% 5,3% 4,1% 1,8% 2,4% 1,2% ,6% 100,0%
Marital status
Married N 358 70 34 12 9 5 2 490
% 73,1% 14,3% 6,9% 2,4% 1,8% 1,0% ,4% 100,0%
Lives with a partner N 73 11 6 3 2 2 97
% 75,3% 11,3% 6,2% 3,1% 2,1% 2,1% 100,0%
Divorced N 74 24 10 7 3 3 1 122
% 60,7% 19,7% 8,2% 5,7% 2,5% 2,5% ,8% 100,0%
Widowed N 84 27 13 5 1 5 3 138
% 60,9% 19,6% 9,4% 3,6% ,7% 3,6% 2,2% 100,0%
Lives alone N 79 13 12 11 2 1 2 120
% 65,8% 10,8% 10,0% 9,2% 1,7% ,8% 1,7% 100,0%
Other N 20 3 4 1 28
% 71,4% 10,7% 14,3% 3,6% 100,0%
Children No children N 484 115 63 33 13 13 9 730
% 66,3% 15,8% 8,6% 4,5% 1,8% 1,8% 1,2% 100,0%
1 child N 134 20 10 3 1 168
% 79,8% 11,9% 6,0% 1,8% ,6% 100,0%
2 children N 53 11 6 1 2 3 76
% 69,7% 14,5% 7,9% 1,3% 2,6% 3,9% 100,0%
3 and more children N 23 3 1 1 28
N 82,1% 10,7% 3,6% 3,6% 100,0%
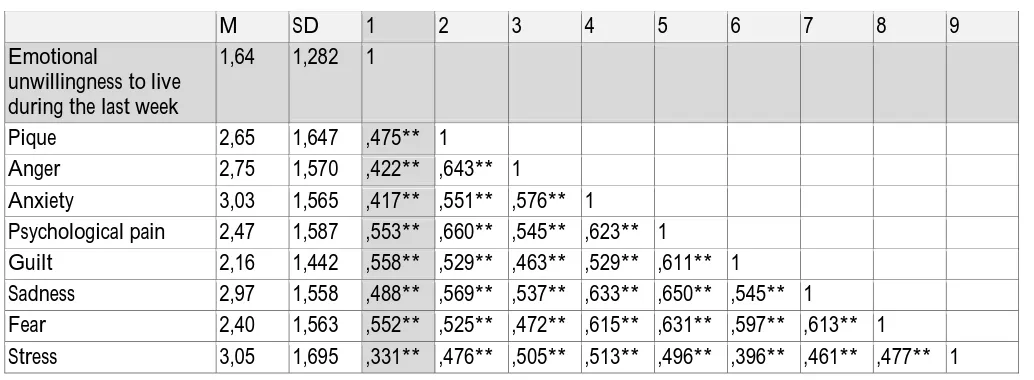
Table 4: Means, Standard Deviations, and Correlations of Lithuanians Emotional Unwillingness to live and Negative Emotions during the Last Week (n=1002)
M SD 1 2 3 4 5 6 7 8 9
Emotional
unwillingness to live during the last week
1,64 1,282 1
Pique 2,65 1,647 ,475** 1
Anger 2,75 1,570 ,422** ,643** 1
Anxiety 3,03 1,565 ,417** ,551** ,576** 1
Psychological pain 2,47 1,587 ,553** ,660** ,545** ,623** 1
Guilt 2,16 1,442 ,558** ,529** ,463** ,529** ,611** 1
Sadness 2,97 1,558 ,488** ,569** ,537** ,633** ,650** ,545** 1
Fear 2,40 1,563 ,552** ,525** ,472** ,615** ,631** ,597** ,613** 1
Stress 3,05 1,695 ,331** ,476** ,505** ,513** ,496** ,396** ,461** ,477** 1
** - Correlation is significant at 0,01 level (2-tailed).
The results demonstrated statistically significant strong relationship between emotional unwillingness to live during the last week and negative emotional states: pique (r=.47, p<0,01), anger (r=.42, p<0,01), anxiety (r=.41, p<0,01), psychological pain (r=.55, p<0,01), guilt (r=.55, p<0,01), sadness (r=.48, p<0,01), fear (r=.55, p<0,01), stress (r=.33, p<0,01). As it could be observed in Table 4, experiences of various negative emotional states were correlated as well. Interestingly, the highest correlations could be observed between psychological pain during the last week, and the lately experienced pique (r=.66,p<0,01), guilt (r=.61, p<0,01), sadness (r=.65, p<0,01), fear (r=.63,p<0,01), anxiety (r=.62,p<0,01). Furthermore, we analyzed relationship between emotional unwillingness to live during the last week and other suicidal–risk related states such as hopelessness, helplessness, meaningfulness. Table 5 displays means, standard deviations and correlations for study variables: Lithuanians’ emotional unwillingness to live during the last week and other suicidal –risk related states.
Table 5: Means, Standard Deviations, and Correlations of Lithuanians Emotional Unwillingness to live and other Suicidal –Risk Related States during the Last Week (n=1002)
M SD 1 2 3 4 5
Emotional unwillingness to live during the last week 1,64 1,282 1
Hopelessness 2,02 1,493 ,735** 1
Helplessness 2,25 1,553 ,650** ,753** 1
Meaninglessness 2,11 1,484 ,719** ,754** ,794** 1
Shame 1,95 1,479 ,487** ,472** ,419** ,442** 1
** - Correlation is significant at 0, 01 level (2-tailed).
Table 6: Means, Standard Deviations, and Correlations of Lithuanians Emotional Unwillingness to live and Positive States during the Last Week (n=1002)
M SD 1 2 3 4 5 6 7 8 9
Emotional unwillingness to live during the last week
1,64 1,282 1
Joy 4,00 1,527 -,146** 1
Gratefulness 3,94 1,536 -,067* ,709** 1
Enthusiasm 3,58 1,635 -,025 ,662** ,664** 1
Trust 3,74 1,605 -,102** ,607** ,631** ,770** 1
Confidence 3,91 1,524 -,154** ,634** ,603** ,705** ,746** 1
Compassion 3,84 1,621 ,000 ,425** ,534** ,500** ,551** ,561** 1
Hopefulness 3,89 1,555 -,145** ,625** ,593** ,735** ,696** ,737** ,549** 1
Happiness 3,93 1,548 -,132** ,533** ,559** ,551** ,563** ,624** ,461** ,608** 1
**. Correlation is significant at 0, 01 level (2-tailed). *.Correlation is significant at 0, 05 level (2-tailed).
The results demonstrated statistically significant negative relationship between emotional unwillingness to live during the last week and positive emotional states: joy .146, p<0, 01), gratefulness .067, p<0, 05), trust (r=-.102, p<0, 01), confidence (r=-.154, p<0,01), hopefulness (r=-.145, p<0,01), happiness (r=-.132, p<0, 01). As it could be observed in Table 6, the last week experiences of various positive states were correlated as well. Interestingly, the highest correlations could be observed between gratefulness and joy (r=.70, p<0, 01), trust and enthusiasm (r=.77, p<0, 01). Furthermore, we analyzed the link between perceptions of life and emotional unwillingness to live. Table 7 displays means, standard deviations and correlations for study variables: Lithuanians’ emotional unwillingness to live during the last week and life perceptions.
Table 7: Means, Standard Deviations, and Correlations of Lithuanians Emotional Unwillingness to live during the Last Week and Life Perceptions (n=1002)
M SD 1 2 3 4 5 6 7 8 9
Emotional unwillingness to live during the last week
1,64 1,282 1
I have clear goals in life 4,21 1,214 -,173** 1
My life is fulfilled 4,14 1,178 -,242** ,530** 1
Life is worthy living 4,77 1,204 -,305** ,370** ,452** 1
Life is pleasant 4,08 1,123 -,212** ,426** ,604** ,596** 1
Life is meaningful 4,38 1,253 -,294** ,478** ,561** ,662** ,660** 1
Any experience, even painful, is meaningful
3,59 1,424 -,068* ,195** ,278** ,307** ,325** ,400** 1
I am satisfied with my life 4,08 1,154 -,231** ,438** ,604** ,563** ,833** ,632** ,309** 1 I will be happy with my life in 10
years
3,94 1,417 -,200** ,390** ,481** ,505** ,576** ,591** ,332** ,568** 1
** - Correlation is significant at 0, 01 level (2-tailed). *.Correlation is significant at 0, 05 level (2-tailed).
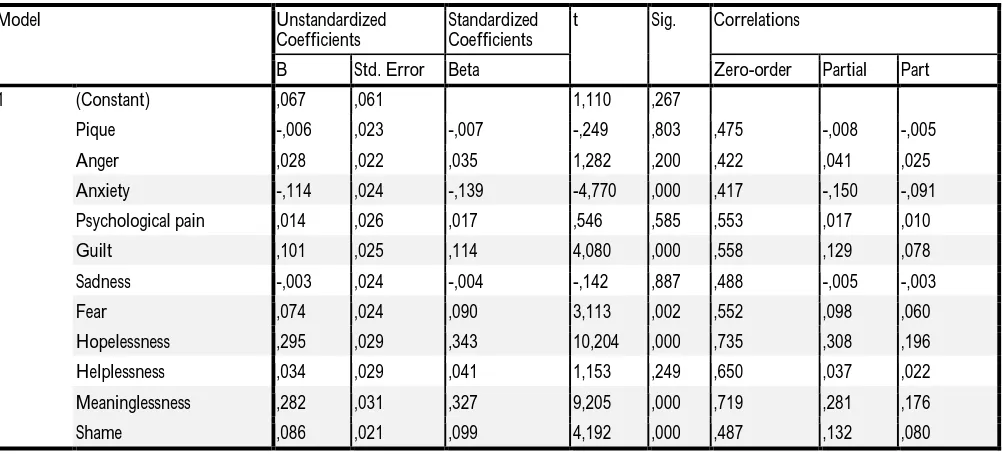
Interestingly, the strongest correlation could be observed between statement “Life is pleasant”, and statement “I am satisfied with my life” (r=.833, p<0, 01). In order to determine the relationship between negative emotional states (pique, anger, anxiety, psychological pain, guilt, sadness, fear, hopelessness, helplessness, meaninglessness, shame)and unwillingness to live (dependent variable was unwillingness to live), we used linear regression analysis procedure (Enter model). The results of regression analysis are presented in Table 8.
Table 8: Linear Regression Analysis (n=1002)
Model Summary
Model R R Square Adjusted R
Square
Std. Error of the Estimate
Change Statistics
R Square Change
F Change df1 df2 Sig. F
Change
1 ,798a ,636 ,632 ,778 ,636 157,371 11 990 ,000
a. Predictors: (Constant), pique, anger, anxiety, psychological pain, guilt, sadness, fear, hopelessness, helplessness, meaninglessness, shame. b. Dependent Variable: Unwillingness to live.
ANOVAb
Model Sum of Squares df Mean Square F Sig.
1 Regression 1046,467 11 95,133 157,371 ,000a
Residual 598,472 990 ,605
Total 1644,939 1001
a. Predictors: (Constant), pique, anger, anxiety, psychological pain, guilt, sadness, fear, hopelessness, helplessness, meaninglessness, shame. b. Dependent Variable: Unwillingness to live.
Coefficientsa
Model Unstandardized
Coefficients
Standardized Coefficients
t Sig. Correlations
B Std. Error Beta Zero-order Partial Part
1 (Constant) ,067 ,061 1,110 ,267
Pique -,006 ,023 -,007 -,249 ,803 ,475 -,008 -,005
Anger ,028 ,022 ,035 1,282 ,200 ,422 ,041 ,025
Anxiety -,114 ,024 -,139 -4,770 ,000 ,417 -,150 -,091
Psychological pain ,014 ,026 ,017 ,546 ,585 ,553 ,017 ,010
Guilt ,101 ,025 ,114 4,080 ,000 ,558 ,129 ,078
Sadness -,003 ,024 -,004 -,142 ,887 ,488 -,005 -,003
Fear ,074 ,024 ,090 3,113 ,002 ,552 ,098 ,060
Hopelessness ,295 ,029 ,343 10,204 ,000 ,735 ,308 ,196
Helplessness ,034 ,029 ,041 1,153 ,249 ,650 ,037 ,022
Meaninglessness ,282 ,031 ,327 9,205 ,000 ,719 ,281 ,176
Shame ,086 ,021 ,099 4,192 ,000 ,487 ,132 ,080
a. Dependent Variable: Unwillingness to live.
To sum up, unwillingness to live is statistically significantly related to negative emotional states, and statistically significantly negatively related to positive states and life perceptions in the representative sample of Lithuanian population.
5. Conclusions
The clear answer to the question whether unwilling to live people can be satisfied with life, as showed our research results, is: no, unwilling to live people are not satisfied with life, they feel miserably and cannot think about this life as meaningful, worthy living, purposeful, pleasant, fulfilled. The study complements research done in other countries (Andres, Collings, Qin, 2010; Brown, Beck, Steer, & Grisham, 2000; Arria et al., 2009; Brown et al., 2000; Khan, Leventhal et al., 2002;Sareen, Cox, Afifi, de Graaf, Asmundson, et al., 2005; Have, de Graaf, van Dorsselaer, Verdurmen et al., 2009; Crump, Sundquist, Sundquist, Winkleby, 2013; Ishtiak-Ahmed, Perski, Mittendorfer-Rutz, 2013). The present study showed that:
1) Unwillingness to live was more expressed in Lithuanian women than in men. To compare with other age groups, it was higher in 70 and more year’s age group. Unwillingness to live was most expressed in cities (from 5000 to 80000 citizens), it was mostly typical for people living alone and having no children.
2) The results demonstrated statistically significant strong relationship between emotional unwillingness to live during the last week and negative emotional states: pique (r=.47, p<0,01), anger (r=.42, p<0,01), anxiety (r=.41, p<0,01), psychological pain (r=.55, p<0,01), guilt (r=.55, p<0,01), sadness (r=.48, p<0,01), fear (r=.55, p<0,01), stress (r=.33, p<0,01).
3) The results demonstrated statistically significant strong relationship between emotional unwillingness to live during the last week and suicidal – risk related emotional states: hopelessness (r=.73, p<0,01), helplessness (r=.65, p<0,01), meaninglessness (r=.71, p<0,01), shame (r=.48, p<0,01).
4) The results demonstrated statistically significant negative relationship between emotional unwillingness to live during the last week and positive emotional states: joy .146, p<0,01), gratefulness .067, p<0,05), trust (r=-.102, p<0,01), confidence (r=-.154, p<0,01), hopefulness (r=-.145, p<0,01), happiness (r=-.132, p<0,01).
5) The results demonstrated statistically significant negative correlations between unwillingness to live and positive life perceptions: “I have clear goals in life” (r=-.173, p<0,01), ‘”My life is fulfilled” (r=-.242, p<0,01), “Life is worthy living” (r=-.305, p<0,01), “Life is pleasant” (r=-.212, p<0,01), “Life is meaningful” (r=-.294, p<0,01), “Any experience, even painful, is meaningful” (r=-.068, p<0,05), “I am satisfied with my life” (r=-.231, p<0,01), “I will be happy with my life in 10 years” (r=-.200, p<0,01).
6) The rates of unwillingness to live heightens in regard to the rates of lately experienced strong anxiety (t = 4,47; p = 0,00), guilt (t = 4,08; p = 0,00), fear (t = 3,11; p = 0,02), hopelessness (t = 10,20; p = 0,00), meaninglessness (t = 9,20; p = 0,00), and shame (t = 4,19; p = 0,00).
References
Abramson, L. Y., Alloy, L. B., Hogan, M. E., Whitehouse, W. G., Cornette, M., Akhavan, S., & Chiara, A. (1998). Suicidality and cognitive vulnerability to depression among college students: A prospective study. Journal of Adolescence, 21, 473–487. doi:10.1006/jado.1998.0167
Abramson, L. Y., Metalsky, G. I., & Alloy, L. W. (1989). Hopelessness depression: A theory-based subtype of depression. Psychological Review, 96, 358–372. doi:10.1037/0033-295X.96.2.358
Andres AR, Collings S, Qin P (2010) Sex-specific impact of socio-economic factors on suicide risk: a population-based case-control study in Denmark. European Journal of Public Health 20: 265–270.
Arria AM, O’Grady KE, Caldeira KM, Vincent KB, Wilcox HC, Wish ED. Suicide ideation among college students: A multivariate analysis. Arch Suicide Res 2009; 13:230-46.
Brown, G. K., Beck, A. T., Steer, R. A., & Grisham, J. R. (2000). Risk factors for suicide in psychiatric outpatients: A 20-year prospective study. Journal of Consulting and Clinical Psychology, 68, 371–377. doi:10.1037/0022-006X.68.3.371
Cavanagh JTO, Carson AJ, Sharpe M, Lawrie SM (2003) Psychological autopsy studies of suicide: a systematic review. Psychological Medicine 33: 395–405.
Christensen, H., Batterham, P. J., Soubelet, A., & Mackinnon, A. J. (2013). A test of the interpersonal theory of suicide in a large community-based cohort. Journal of Affective Disorders, 144, 225–234. doi:10.1016/j.jad .2012.07.002
Crump C, Sundquist K, Sundquist J, Winkleby MA (2013) Sociodemographic, psychiatric and somatic risk factors for suicide: a Swedish national cohort study. Psychological Medicine: 1–11.
Diener, E. (1994). Assessing subjective well–being: Progress and opportunities. Social Indicators Research, 31, 103– 157.
Diener, E. (2000). Subjective well–being: The science of happiness and a proposal for a national index. American Psychologist, 55, 34–43.
Diener, E. (2003). What is positive about positive psychology: The curmudgeon and Pollyanna. Psychological Inquiry, 14, 115–120.
Diener, E., & Seligman, M. E. P. (2004). Beyond money: Toward an economy of well-being.
Diener, E., Emmons, R. A., Larsen, R. J., & Griffin, S. (1985). The satisfaction with life scale. Journal of Personality Assessment, 49 , 71–75.
Diener, E., Oishi, S., & Lucas, R. E. (2003). Personality, culture, and subjective well–being. Annual Review of Psychology, 54, 403–425.
Diener, E., Wirtz, D., Tov, W., Kim-Prieto, C., Choi, D., Oishi, S., & Biswas-Diener, R. (2010). New well-being measures: Short scales to assess flourishing and positive and negative feelings. Social Indicators Research, 97 , 143–156.
Diener, E., & Seligman, M.E. P. (2002).Very happy people. Psychological Science, 13, 80–83. Durkheim, E., Spaulding, J. A., & Simpson, G. (2010). Suicide. New York: Free Press.
Fredrickson, B. L. (2001). The role of positive emotions in positive psychology: The broaden-and-build theory of positive emotions. American Psychologist, 56 , 219–226.
Frisch, M. B. (2006). Quality of life therapy: Applying a life satisfaction approach to positive psychology and cognitive therapy. New York: Wiley.
Gili-Planas M, Roca-Bennasar M, Ferrer-Perez V, Bernardo-Arroyo M. Suicidal ideation, psychiatric disorder, and medical illness in a community epidemiological study. Suicide Life Threat Behav 2001; 31:207-13.
Harris EC, Barraclough B (1997) Suicide as an outcome for mental disorders. A meta-analysis. Br J Psychiatry 170: 205–228.
Have M, de Graaf R, van Dorsselaer S, Verdurmen J, van ’t Land H, et al. (2009) Incidence and course of suicidal ideation and suicide attempts in the general population. Canadian Journal of Psychiatry 54: 824–833.
Hawton K (2000) Sex and suicide. Gender differences in suicidal behaviour. British Journal of Psychiatry 177: 484– 485.
Hawton K, van Heeringen K (2009) Suicide. Lancet 373: 1372–1381.
Hayborn, D. M. (2008). The pursuit of unhappiness . Oxford, UK: Oxford University Press.
Ishtiak-Ahmed K, Perski A, Mittendorfer-Rutz E (2013) Predictors of suicidal behaviour in 36,304 individuals sickness absent due to stress-related mental disorders — a Swedish register linkage cohort study. BMCPublic Health 13.
Jablonska B, Lindberg L, Lindblad F, Hjern A. Ethnicity, socio-economic status and self-harm in Swedish youth: A national cohort study. Psychol Med 2009; 39:87-94.
Khan A, Leventhal RM, Khan S, Brown WA (2002) Suicide risk in patients with anxiety disorders: a meta-analysis of the FDA database. J Affect Disord 68: 183– 190.
Lewinsohn, P. M., Rohde, P., & Seeley, J. R. (1994). Psychosocial risk factors for future adolescent suicide attempts. Journal of Consulting and Clinical Psychology, 62, 297–305. doi:10.1037/0022-006X.62.2.297
Luoma, J. B., Martin, C. E., & Pearson, J. L. (2002). Contact with mental health and primary care providers before suicide: A review of the evidence. The American Journal of Psychiatry, 159, 909–916. doi:10.1176/appi.ajp .159.6.909
McIntosh, J., & Drapeau, C. (2012). U.S.A. suicide 2010: Official final data. Washington, DC: American Association of Suicidology.
Parducci, A. (1995). Happiness, pleasure, and judgment: The contextual theory and its applications. Mahwah, NJ: Lawrence Erlbaum Associates.
Qin P, Agerbo E, Mortensen PB (2003) Suicide risk in relation to socioeconomic, demographic, psychiatric, and familial factors: a national register-based study of all suicides in Denmark, 1981–1997. American Journal of Psychiatry 160: 765– 772.
Romens, S. E., Abramson, L. Y., & Alloy, L. B. (2009). High and low cognitive risk for depression. Cognitive Therapy
and Research, 33, 480–498. doi:10.1007/s10608-008-9219-5.
Ryan, R. M., &Deci, E. L. (2000). Self-determination theory and the facilitation of intrinsic motivation, social development, and well-being. American Psychologist, 55, 68–78.
Ryff, C. D., & Singer, B. (1996). Psychological well-being: Meaning, measurement, and implications for psychotherapy research. Psychotherapy and Psychosomatics, 65, 14–23.
Sareen J, Cox BJ, Afifi TO, de Graaf R, Asmundson GJ, et al. (2005) Anxiety disorders and risk for suicidal ideation and suicide attempts: a population-based longitudinal study of adults. Arch Gen Psychiatry 62: 1249–1257. Seligman, M. E. P. (2002). Authentic happiness: Using the new positive psychology to realize your potential for lasting
fulfillment . New York: The Free Press.
Sirgy M. J. (2012). The Psychology of Quality of Life. Hedonic Well-Being, Life Satisfaction, and Eudaimonia. Springer Science+Business Media B.V. 2012.
Sirgy, M. J., & Wu, J. (2009). The pleasant life, the engaged life, and the meaningful life: What about the balanced life? Journal of Happiness Studies, 10, 183–196.
Spicer RS, Miller TR. Suicide acts in 8 states: Incidence and case fatality rates by demographics and method. am J Public Health 2000; 90:1885-91.
Taliaferro LA, Rienzo BA, Miller MD, Pigg RM Jr, Dodd VJ. High school youth and suicide risk: Exploring protection afforded through physical activity and sport participation. J Sch Health 2008; 78:545-53.
Tov, W., & Diener, E. (2009). The well-being of nations: Linking together trust, cooperation, and democracy. In E. Diener (Ed.), The science of well-being: The collected works of Ed Diener(pp. 155–173). Dordrecht, the Netherlands: Springer.
Veenhoven, R. (2000). The four qualities of life. Journal of Happiness Studies, 1, 1–39. Veenhoven, R. (2003). Hedonism and happiness. Journal of Happiness Studies, 4, 437–457.
Warburton, D. (1996). The functions of pleasure. In D. Warburton & N. Sherwood (Eds.), Pleasure and quality of life .Chichester, UK: Wiley.