Birth Order Impact on Public and Private School Enrolment Rates in Pakistan
Author’s Details: (1)
Hassnain Javed- (2)Dragana Ostic (3)Saba Fazal Firdousi -(1) (2)(3)Jiangsu University, School of Management, China
Abstract
Education is a basic human right of every individual it is a reflection of cultural identity and society at large. Education is one the most important factor that can make individually skilled, provide social justice, improve the standard of living or reduce inequalities which translate as leading factor to contribute towards sustainable growth. Therefore, education plays a key role in improving the social, political, cultural and economic conditions. Moreover, in today’s world education is divided between public and the private sector in both developed and developing countries. In a nutshell, the existing literature both theoretical and empirical provided significant evidence on the relationship between on average household size and educational attainments by using different methodologies and experiments in both the developed and developing world. This study will contribute in the existing literature by determining the impact of birth order on both public and private school enrolments at primary, secondary and high school level by using the most recent data set. As the existing literature on birth order in the context of Pakistan only provides evidence of primary school and secondary enrolments rates. Moreover, this study will not only focus on one province but provide evidence from all provinces. This paper conducts a household level analysis using PSLM (Pakistan Social Living standard Measurement) 2010-2011 data for observing the birth order impact on public and private school enrolments in rural and urban regions and four major provinces of Pakistan: Punjab, Sindh, Balochistan and Khyber Pakhtunkhwa (KPK). Furthermore, Ordinary Least Square (OLS), probit model and logit model will be used in this paper for empirical estimations. The remaining paper is organized as follows. Section II discusses the data set and its summary statistics. Section III provides the theoretical framework for this study. Section IV will discuss the findings and implication. Lastly, Section V will conclude the study followed by limitations and policy recommendations
Keywords: Education, Public Schooling, Private Schooling, Birth Order and School Enrollment
Introduction:
Education is a basic human right of every individual it is a reflection of cultural identity and society at large. Education is one the most important factor that can make individually skilled, provide social justice, improve the standard of living or reduce inequalities which translate as leading factor to contribute towards sustainable growth. Therefore, education plays a key role in improving the social, political, cultural and economic conditions. Moreover, in today’s world education is divided between public and the private sector in both developed and developing countries.
Besides the significant benefits attach to education and division between two educational sectors there is still around 774 million children, and adults in the world who are not classified as educated that is unable to read and write, and out of which about two third is female.1 Moreover, there are some 57 million children of primary schooling age who did not attend school out of which 20 percent are from West Asia and Sub-Saharan Africa.1 Moreover, developing countries are suffering from another education constraint in the form of rising primary school dropout ratio as in 2010 there were 69 million young individuals of secondary school going age did not attend school.1
1
Since the past decade, there have been several transformations in the educational landscape of Pakistan as well. The school enrolment has shown a positive trend in all of the provinces of Pakistan. The net primary enrollment rate for children in 5-9 years of age bracket has increased to 57 % in 2009 (PSLM 2008-09) in comparison it was 42% in 1999(PIHS 1998-99). It shows a drastic increase of 36% over a span of two decades.2 Moreover, gender parity index for net school enrollments has also improved to 0.84 in 2009 from 0.68 in 2001 (PSLM 2010-11). It reflects reducing gender inequality in the education sector. Besides this, with structural developments in Pakistan it is not only confined to public schooling, but now education is being delivered by different non-state providers which include private sector with the aim of profit, non- profit organizations and religious schools. Furthermore, educational sector development has also been expanded in both rural and urban areas of Pakistan.
In addition, a statistical comparison of an annual report by National Education Statistics 2011-12 and 1999-2000 showed that public school which includes pre-primary, primary, and the secondary and high school has increased by 36.14 percent over the time frame of one decade.3 In contrast, private school enrollment has also shown a drastic increase of 113.68 percent.3 Similarly, rising trend of both public and private school enrolment has been depicted in different provinces of Pakistan. Balochistan has the highest change in public school enrolment of 86.55 percent followed by Sindh with 68.51 percent, KPK with 63.35 percent and Punjab 16.36 percent over the last decade.3 But, private school enrolment has mostly been twice more than public schools in all provinces.3 Punjab, and KPK has the highest change increase in private school enrolment of 116.98 percent followed by Balochistan and Sindh.3
Besides this, theoretical literature also attaches significant importance to education as it modeled by various authors. For instance, Lucas (1988) explained the importance of human capital attainment which acts as the main driver for economic growth. Similarly, Azariadis and Drazen (1990) emphasized the existence of multiple growth paths namely high growth and low growth paths which are dependent upon the time allocation in education by the previous generation. If the previous generation had allocated sufficient time in education, then their children find it attractive to invest in education which translates into higher economic growth. Furthermore, Galor and Zeira (1993) has also provided insight on investment in human capital and explained that it is costly to attain education due to existing income inequalities and credit market imperfections. Therefore, individuals with high income and access to finance will have high capital accumulation and become skilled in comparison to the poor.
In addition, empirical studies further validate the theoretical findings and explain different channels that can impact education both in public and private sector. Over the years private school enrollment rates have improved significantly not only in the developed world but also in developing the world. An empirical study conducted by Langouet and Leger (2000) provided evidence that since late 1970’s more than one-third of the French population is enrolled in private schooling either permanently or for short term. Almost one member from each house is attending private school due to a better quality of educational attainment though some families are still loyal to public schooling. Moreover, another study conducted by Wrinkle et al. (1999) suggested two different viewpoints with regard to public and private school enrollments. The author had collected data on school enrollments from seventy three Texas counties in the United States and found that due to poor public school performance more children got enrolled in private schools. Furthermore, another view is the cultural, racial and religious factors that lead to higher enrollment in private schools.
Furthermore, developing world also share similar mechanics for school enrollments. A study conducted by Muralidharan and Kremer (2006) in rural India presented that over the span of five years while data was
2 The calculations are made by extracting the information and statistical figures from Annual report of Pakistan Social and Living
Standards measures.
3
collected for study there was a significant amount of establishment of private schools, and around 28 percent of the population of rural India had access to free charge private school. Private schools had high enrollments due to varied reasons such as high quality education, better qualified teachers and low cost in the form of fewer salaries to the teacher in comparison to public school.
In contrast, a study conducted by Alderman et al. (2001) provided the evidence of rising trend of private school enrollments in Pakistan. The increasing demand for private schools is due to many factors, but most important one is quality, proximity and lower cost. Moreover, in developing countries, there is gender discrimination for access to education. To determine the linkage, a study was conducted by Aslam (2009) presenting a case of Pakistan in which he determined the effectiveness of private and public school enrollments at primary and secondary level. He concluded that household prefers to enroll boys in private schools in comparison to girls due to high quality and better learning. Furthermore, there is a distinction in productivity of both public and private schools in different countries. But the magnitude of differences is dependent on the well functioning of the public sector. For developed economies like the United States, there were fewer productivity differences in both public and private schools in comparison to countries like Pakistan and India (Pritchett and Viarengo, 2008).
Moreover, there are varied channels that can impact public and private school enrollments, and one of them is family size. The large family size implies a further division of household expenditure and resource allocation which translates into a choice between school either public or private. In Pakistan average household family size plays a significant role in educational attainments. Over the past decade, the family size which includes the average number of member, male, female and children per household has shown a gradual reduction. Overall, Pakistan has experienced 7.90 percent change in an average number of member per household with 8.26 percent fall in male, 7.25 percent fall in female and 15.71 percent decrease in children per household over the past decade.4 Similarly, both rural and urban regions of Pakistan have shown a declining trend, but it is higher for urban regions in comparison to rural areas. Moreover, Sindh has shown the highest decrease of 13.13 percent of an average number of member per household followed by Punjab with 7.03 percent and KPK 5.74 percent.4 But, Balochistan has shown a drastic increase of 11.80 percent of average member per household. Similarly, an average number of children per household has also shown a decrease in all provinces except Balochistan which has 11.37 percent increase (PSLM 2011-12, HIES 2001-2002).4
This paper broadly aims to find the relationship of household size and educational attainments by exploring the birth order impact on public and private schooling in Pakistan by controlling for some important child specific, parent’s specific, household specific and region specific characteristics. These control variables include age factor, household income, parents working status, parent’s education, and parent’s perception about school quality, gender differences, birth space, and family size, proximity to the school, number of siblings, provinces, and region.
Research has shown that they are varied reasons for the significance of birth order effects. The reasons and explanations can be broadly divided into four parts which include financial constraints, household structure and environment, biological factors and history and culture (Ejrnaes and Portner, 2004)
Over the life cycle parents faced financial and time constraints, therefore, it is difficult for them to equalize their resources among children. In general, when parents are faced with financial and time constraints then first born and last born children will be an advantage in comparison to middle born children as they tend to spend more time in smaller families. Moreover, the firstborn child will have more time, and resource allocation by parents and last born will benefit because the elder siblings might have started earning and overall household income have improved (Parish and Willis, 1993). Besides this, another study conducted by Birdsall (1991) explains parents especially mother time allocation to children could be varied across time and cannot be transferred
4 Appendix Table 1 b, the statistical figures are taken from PSLM
across periods. Further, results indicate that birth order has a significant impact when the mother is not part of the labor force in contrast to working mothers who are time constrained and have a high opportunity cost of time.
Household structure and the environment is another leading factor to account for birth order effects. Therefore the number of children and their respective age does matter. A study conducted by Zajonc (1976) had hypothesized that intellectual environment to have a significant impact on children human capital attainment. His theory explains that household with high intellect and education will benefit the firstborn which will be further transmitted to later born.
Biological reasoning also accounts for birth order effects. As the mother at the time of firstborn is more healthy and young, therefore a baby is likely to have higher birth weight and more healthy. In contrast, high birth order babies will be of low weight but will also be an an advantage as mothers will be more experienced (Behrman, 1988).
Moreover, historical and cultural factors also account for birth order effects. In general, household residing in developing countries tend to have large family sizes as they believe that more children will be a source of earning and security for old age. Moreover, preferences for son heirs are another reason for birth order effects (Horton, 1988).
Apart from this, family economics explains that parental choice of fertility and human capital attainment is closely linked to each other. As discussed earlier parents face a tradeoff between resource allocation and a number of children. As the family size increases, there will be resource dilution. Therefore, education of mother plays an important role. If the mother is educated and working she will incur the opportunity cost of child rearing thus prefer to have few numbers of children and invest more in their education. In contrast, parents who are less educated especially mother and not working tend to have more children and invest little in the human capital attainment of children. This phenomenon was explained by Becker and Lewis (1973) in a quantity-quality tradeoff in children decision making.
Besides this, existing literature provides evidence that birth order has a significant negative impact on child educational attainment. There are different theories which help to estimate a birth order effect which includes stopping models, dilution of parent resources at their young age and physiological differences. Historically, it was difficult to estimate birth order impacts due to limited data (Blake, 1986) but now in recent times a lot of work has been carried out in this domain.A study conducted in Taiwan found that a sister with highest birth order translates into more educational opportunities for younger siblings as they either get married earlier or provide domestic labor (Greenhalgh, 1985; Parish and Willis, 1993). Moreover, a study conducted on Pakistan found higher birth order to have a significant positive impact on primary school enrollment because with the addition of more siblings in the family the household income remains limited but divided among more individuals. Therefore, children with lowest birth order get enrolled in primary school and were an an added advantage as they did not have to suffer from parent’s resource dilution or either competes with other siblings (Sathar and Lloyd, 1994). In contrast another study conducted on Pakistan found that elder brothers in birth order and youngest in birth order were found to have higher probability of attending secondary and post secondary school level because parents have more resources available to spend for first born child and high level of education attained translates into providing educational support for his younger siblings (Sawada, 1997; Alderman et al. 2000).
context of Pakistan only provides evidence of primary school and secondary enrolments rates. Moreover, this study will not only focus on one province but provide evidence from all provinces.
This paper conducts a household level analysis using PSLM (Pakistan Social Living standard Measurement) 2010-2011 data for observing the birth order impact on public and private school enrolments in rural and urban regions and four major provinces of Pakistan: Punjab, Sindh, Balochistan and Khyber Pakhtunkhwa (KPK). Furthermore, Ordinary Least Square (OLS), probit model and logit model will be used in this paper for empirical estimations. The remaining paper is organized as follows. Section II discusses the data set and its summary statistics. Section III provides the theoretical framework for this study. Section IV will discuss the findings and implication. Lastly, Section V will conclude the study followed by limitations and policy recommendations.
Date Set
For our research, we use the Pakistan Social and Living Standards Measurement Survey (PSLM) dataset for 2010-2011. PSLM surveys are conducted at the individual, district, and provincial level. PSLM main indicators on which data is collected are education, population welfare, health, employment, household amenities at the provincial district and national level. Indicators are disaggregated for each gender covering all four provinces, each district, i.e., Islamabad, Lahore, Karachi, and Rawalpindi and further each regional level, i.e., urban and rural.
Methodology
The hypothesis tested in our research is whether children born earlier in the family reap the educational benefits as compared to children born later in the family. Our sample comprises of children enrolled in either public or private schools at the primary and secondary level.
In order to look at the impact of birth order on enrolment of public or private schooling, we have incorporated child, parent and household specific factors. Integrating all of these factors, we have specified the following models three models which include Linear Probability model, Logit model, and Probit model:
= σ + + + + + +
BO, W, X, Y, Z) = ϕ (γ + + + + + + )
BO, W, X, Y, Z) = F (α + + + + + + )
Where is a dummy variable that is equal to 1 if the child is enrolled in a public school and 0 if the child is enrolled in a private school with i represInting every child as it is a child level analysis.
The main variable of our analysis is birth order ( . In order to look at the impact of birth the order of the children on enrolment in public and private schooling, we have included dummy a variable for each rank of birth order.
is a vector which includes parent specific factors controlled for such as the parents age, education level attained, employment status of the parents and the nature of employment.
is a vector which includes household specific factors controlled for such as the income of the household, household size.
is a vector which capture the provincial impacts on publthe ic and private school we have included a categorical variable for each province, taking Punjab as the base category. Further disaggregating the data, regional impacts are included by incorporating a dummy variable which is equal to 1 for urban areas and 0 for rural areas.
Data Description:
The PSLM Dataset of 2010 to 2011 included where parents of 239343 children were surveyed. Out of these children, 111236 children are of school going age at the primary, middle or high school level from which 81186 children are currently enrolled in school while 37276 children are not enrolled in school. Disaggregating by the gender of the children, 44 percent are males who are currently attending school whereas 28 percent are female. The table 2 below in Appendix A shows the overall enrolment of children disaggregated in terms of gender and school type. Out of the children who are in the age bracket of either going to the primary or high school, 72.98 percent are enrolled while 23.52 percent have dropped out. As there were instances of missing data percent in our dataset, thus we could not distinguish which children had never attended school or whether it was an instance of missing data. Enrolment is highest in the public sector with the majority of the children enrolled in the public sector, while enrolment in Madrassa and other school are very low at 0.49 and 0.67 percent respectively. Similarly, it is seen that there is enrolment in the private sector as well however it is much lower than the public sector. There is a greater enrolment for males than females in all types of schooling, indicating gender disparities within the education sector.
Table 3shows the enrolment at each level of school in terms of gender and the type of schooling. Data shows that as the level of education increases, the enrolment decreases, with the least amount of enrolment in the tertiary sector. Majority of the children are enrolled in the primary level with almost 70 percent in the public sector while 23.54 percent enrolment in the private sector. This again shows that the education sector focuses mainly on the primary level with public sector being the provider of education for these children. As enrolment at each level of education is higher for males than females evidence of gender disparities amongst school level are also evident.
Table 4 shows the further disaggregation of the enrolment rates for each province. The highest enrolment rates are in Punjab with 26.4 percent in the public sector, and 13.05 percent in the private sector, followed by Sindh while the lowest are in Balochistan with 13.12 percent enrolled in the public sector and 0.78 percent in the private sector. For each province enrolment in the public sector is higher than the private sector while enrolment is higher for boys than for girls. Differences across these could be due to differences in the household, parent-specific or individual parent-specific characteristics for the sample. Table 4 below provides the summary statistics of these characteristics.
education of mothers is till the primary level. Furthermore, on average both the parents of these were mainly either self-employed or paid employees.
Results:
This table provides the results of our study. We have applied the linear probability model, probit and logit estimation techniques. The table above shows the results for the effect of child specific factors on the enrolment on public or private schooling. Column 1 provides the estimates for the Linear probability model. Firstly it should be noted that almost all of the variables are significant. Gender has a statistically positive impact on boys having a higher probability of going to private schools than girls, on average. This provides evidence of gender discrimination within households. This result is consistent with a study conducted in Pakistan by Aslam et al. (2008) showed that there is evidence of pro male bias in education expenditure within households. Thus parents spend more on the education of sons rather than daughters. As time taken to travel to school is taken a measure of distance to school, therefore the greater the distance, children would prefer to go to schools nearby, i.e., public schools.
The results indicate that the more time it takes for a child to travel to primary the probability of going to private school are lower, on average. However, if the time taken to travel to school rises for high school the probability of going to private school rises. The effect of middle school is insignificant. This shows that as parents value higher education more, they would prefer to send their children to private schools in higher classes even if it takes more time to travel. Households with lower income are more sensitive to public and private school fees, proximity and school quality therefore individual from lower family income will tend to prefer a school which is nearest to its home to cut down the travel cost (Alderman, Orazem, Paterno, 2001).
The mode of transport also has a significant effect on the enrolment of private schools. The results indicate that if the children have mechanized methods of transportation, they have a probability of going to private schools. If the children have mechanized modes of transport, this also indicates that the income of the household is respectable, who can afford private schooling.
The most important variable of our analysis is the birth order of the children. It can be seen that’s the level of significance falls as the birth order increases. If the child is born first the probability of going to private school is higher than the probability if the child is second born, and so on. The effect of birth order becomes insignificant in the fifth order, indicating that at that stage birth order does not matter for the choice of schooling.
The table above shows the results for the parent specific factors which affect the enrolment in public or private school for the children. The results indicate that if the mother is older, there is a lower probability of the child going to private school. However, if the father is older, the probability is higher. Even though these variables are significant, the impact is small. The education of both the parents has a positive impact on private school enrolment for the children. The mechanism for this is that the parents, who are educated, can assess the quality of a school better than a non-educated parent (Andrabi, Das, &Khwaja, 2002).
Finally, the employment status of the parents has a significant effect on the choice between public and private schooling. If the parents are self-employed or own their own businesses, there is a higher probability of sending their children to private school. On the other hand, if the children are farmers, and work in agriculture, those parents send their children to public schools.
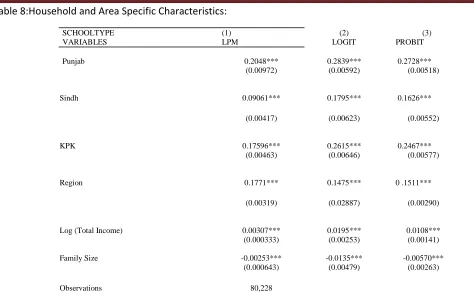
dummy examines the effect of being in an urban or a rural area. The results indicate that children in the urban areas have a higher probability, on average of going to private schools than children in rural areas.
Turning to the household specific characteristics, family size has a negative impact on the enrolment in private school. This is because if the family size is large, and resources are fixed, thus there are fewer resources per child, and the probability of going to private school is lower. This is consistent with literature arguing that in case of large family size, keeping household income constant it is likely that resources will fall for another child born (Booth and Kee, 2009).
Finally, income has a positive impact on the enrolment in private school. This is in line with literature where Checchi&Jappelli (2003) have found that the proportion of private school income rates are positively affected by income: majority of the students in private schools come from households which lie in the top quartile of the income distribution enrolment in private schools is higher for privileged households as they have more resources to support their children’s educational attainment
Conclusion
In order to conclude, this study explores the birth order impact on public and private school enrollments by accounting for child specific, parent’s specific, household specific and regional factors. The higher birth order has a significant negative impact on private school enrollments. Moreover, there is an element of pro-male bias in Pakistani culture and economy, and this evidence is further validated from our results which explains there is preference attach for sending a male child to private schools. Furthermore, interesting results are generated will considering for parent’s specific factors such as mother age to have a negative impact on private school enrollment in contrast to father age to have a positive impact. Besides this, acquisition of education is costly therefore richer, and wealthy households can afford private education. In addition, lack of resources and large family sizes in rural areas translate into a higher probability of enrolling a child in public schools. On the whole, all factors have a significant impact on public and private school enrollments and in line with theoretical linkages and economic intuitions.
Recommendations
In my view, lack of resources and family planning is the major reason for the birth order to have a negative impact on public and private school enrollments. Therefore, the government of Pakistan should take the initiative by providing small scale microfinance educational loans starting from the primary level of education. Moreover, there should be strict enforcement of quality standards and regular check of public schools administration and curriculum to improve the enrollment rates and reduce the school dropout ratio. Furthermore, there should be extensive awareness programs with regard to family planning especially in rural areas for efficient allocation of resources within a household for better education and future prospects. In addition, the government might launch an incentive based program for poor families like pension schemes or health insurance to encourage small family size as developing countries have large family sizes due to old age dependency.
References
i. Ahmed, H., Amjad, S., Habib, M., & Shah, S. A. (2013). Determinants of School Choice: Evidence from Rural Punjab, Pakistan (No. 1-2013). Centre for Research in Economics and Business, The Lahore School of Economics.
ii. Alderman, H., Behrman, J. R., Lavy, V., & Menon, R. (2001). Child health and school enrollment:A longitudinal analysis. Journal of Human Resources, 185-205.
iv. Andrabi, T., Das, J., &Khwaja, A. I. (2002). The rise of private schooling in Pakistan: Catering to the urban elite or educating the rural poor? (Mimeo). Washington, DC: World Bank.
v. Andrabi, T., Das, J., Khwaja, A. I., Vishwanath, T., &Zajonc, T. (2007).Learning and education achievements in Punjab schools (LEAPS):Insights to inform the education policy debate. Washington, DC:World Bank.
vi. Annual Status of Education Report. (2010). Annual status of educationreport (rural): Pakistan (2010). Lahore, Pakistan: South Asian Forum for Education Development.
vii. Aslam, M. (2009). The relative effectiveness of government and private schools in Pakistan: are girlsworse off?. Education Economics, 17(3), 329-354.
viii. Azariadis, C. &Drazen, A. (1990).Threshold Externalities inEconomic Development. Quarterly Journal of Economics, pp. 501-526.
ix. Becker, G., & Tomes, N. (1976). Child endowments, and the quantity and quality of children.
x. Behrman, J. R., &Deolalikar, A. B. (1990). The intrahousehold demand for nutrients in rural south India: Individual estimates, fixed effects, and permanent income. Journal of human resources, 665-696.
xi. Behrman, Jere R., and Paul Taubman. 1986. “Birth Order, Schooling, and Earnings.” Journal a. OfLabor Economics 4(3):S121–S45.
xii. Behrman, J. R., Pollak, R. A., &Taubman, P. (1982). Parental preferences and provision for progeny. The Journal of Political Economy, 52-73.
xiii. Birdsall, Nancy. 1979. “Siblings and Schooling in Urban Columbia.” Dissertation, YaleUniversity, Department of Economics.
xiv. Black, S. E., Devereux, P. J., &Salvanes, K. G. (2005). The more the merrier? The effect of family size and birth order on children's education. The Quarterly Journal of Economics, 669-700.
xv. Booth, A. L., &Kee, H. J. (2009). Birth order matters: the effect of family size and birth order on educational attainment. Journal of Population Economics, 22(2), 367-397.
xvi. Checchi, D., &Jappelli, T. (2003).School choice and quality (No. 828).IZA Discussion paper series. xvii. Deolalikar, A. B. (1993). Gender differences in the returns to schooling and in school
enrolment rates in Indonesia. Journal of Human Resources, 899-932.
xviii. Ejrnæs, M., & Pörtner, C. C. (2004). Birth order and the intrahousehold allocation of time and education. Review of Economics and Statistics, 86(4), 1008-1019.
xix. Dreze, J., &Kingdon, G. G. (2001).School participation in rural India.Review of Development Economics, 5(1), 1–24.
xx. Galor.O&Zeira.J. (1993).Income Distribution and Macroeconomics. The Review of Economic Studies, Vol.60, No.1, pp. 35-52.
xxi. Greenhalgh, S. (1985). Sexual stratification: The other side of" growth with equity" in east Asia. Population and Development Review, 265-314.
xxii. Hanushek, E. A. (1992). The trade-off between child quantity and quality.Journal of political economy, 84-117.
xxiii. Horton, S. (1988). Birth order and child nutritional status: Evidence from the Philippines. Economic Development and Cultural Change, 341-354.
xxiv. Iram, N., Hussain, Z., Anwar, S., Hussain, I., &Akram, W. (2008).Determinants of child school choice in Punjab: Policy implications.European Journal of Scientific Research, 23(2), 285–293. xxv. Jepsen, C., & Montgomery, M. (2009). Miles to go before I learn: The effect of travel
distance on the mature person's choice of a community college. Journal of Urban Economics, 65(1), 64-73.
xxvi. Kornrich, S., & Furstenberg, F. (2013).Investing in Children: Changes in parental spending on children, 1972-2007. Demography, 50, 1-23.
xxviii. Lloyd, C. B., Mete, C., &Sathar, Z. A. (2005).The effect of gender differences in primary school access, type, and quality on the decision to enroll in rural Pakistan. Economic Development
andCultural Change, 53(3), 685–710.
xxix. Lopez-Turley, Ruth N. 2003. “Are Children of Young Mothers Disadvantaged Because of a. Their Mother’s Age or Family Background?” Child Development 74(2):465–74.
xxx. Lucas, Robert E., Jr. (1988). On the Mechanics of Economic Development.Journal of Monetary Economics.22 pp.3-42.
xxxi. Muralidharan, K., & Kremer, M. (2006). Public and private schools in rural India.Harvard University, Department of Economics, Cambridge, MA.
xxxii. Parish, W. L., & Willis, R. J. (1993). Daughters, education, and family budgets Taiwan experiences. Journal of Human Resources, 863-898.
xxxiii. Pritchett, L., & Viarengo, M. (2008). The State, Socialization and Private Schooling: When Will Governments Support Alternative Producers?. Retrieved July, 7, 2011.
xxxiv. Rosenzweig, M. R., &Wolpin, K. I. (1980). Testing the quantity-quality fertility model: The use of twins as a natural experiment. Econometrica: journal of the Econometric Society, 227-240.
xxxv. Rosenzweig, M. R., & Zhang, J. (2009). Do population control policies induce more human capital investment? Twins, birth weight and China's “one-child” policy. The Review of Economic Studies, 76(3), 1149-1174.
xxxvi. Sathar, Z. A., & Lloyd, C. B. (1994). Who gets primary schooling in Pakistan: Inequalities among and within families. The Pakistan Development Review, 103-134.
xxxvii. Srivastava, P. (2007). Neither voice nor loyalty: School choice and the lowfeeprivate sector in India (Occasional Paper No. 134, Research Publications Series), New York, NY:
National Center for the Study of Privatization in Education.
xxxviii. Strauss, J., Mwabu, G., &Beegle, K. (2000). Intrahousehold allocations: a review of theories and empirical evidence. Journal of African Economies,9(Supplement 1), 83-143.
xxxix. Sawada, Y., &Burki, A. A. (1997). Human Capital Investments in Pakistan: Implications of Micro Evidence from Rural Households [with Comments]. The Pakistan Development Review, 695-712.
xl. World Bank. (1996). Improving basic education in Pakistan (Report No.14960-PAK). Washington, DC: Author.
xli. Wrinkle, R. D., Stewart Jr, J., & Polinard, J. L. (1999). Public school quality, private schools, and race. American Journal of Political Science, 1248-1253.
Appendix A: Tables: Table 1A:
Public & Private School Enrolments with respect to Population (Pre-primary, Primary, Secondary and High School)
1999-2000 2011-12 1999-2000 2011-12 %
change 1999-2000 2011-12 % change Population Population Public Public Public Private Private Private
Pakistan 132,352,279
182,098,990 0.1109 0.1097 -1.0610 0.0430 0.0668 35.6107
Punjab 73,621,290
96,545,293 0.1230 0.1092 -12.7037 0.0495 0.0819 39.5614
Sindh 30,439,893
42,187,865 0.0830 0.1009 17.7542 0.0423 0.0617 31.3941
Balochistan 17,743,645
23,770,386 0.0324 0.0451 28.1883 0.0054 0.0090 40.1776 KPK 6,565,885 9,063,767 0.3832 0.4535 15.4940 0.1007 0.1581 36.3168 Source: National Education Statistics Report 2011-12, Educational Statistics of Pakistan 1999-2000 and Census of Private
Educational Institutions 1999-2000
in Pakistan, 1999-2000
Table 1B:
Average number of children per household in Pakistan by Province and Rural/Urban Regions
2001-02 2011-12 % change
Pakistan 3.31 2.79 -15.71
Urban 3.01 2.39 -20.60
Rural 3.43 3.00 -12.54
Punjab 3.05 2.57 -15.74
Sindh 3.52 2.86 -18.75
Balochistan 3.87 4.31 11.37
KPK 3.95 3.39 -14.18
Table 2: Overall enrolment by gender and type of schooling (%)
In School Out of School Type of School
Gender Enrolled Dropped Out Private Public Madrassa Other
Overall 72.98 23.52 27.38 85.41 0.49 0.67
Male 44.29 23.34 15.56 52.78 0.26 0.38
Table 3: Gender-disaggregated enrolment patterns by level of schooling (%):
Private Public Madrassa Other
Primary
Overall 23.54 70.41 0.51 0.51
Males 13.41 42.99 0.26 0.26
Females 10.04 27.41 0.25 0.24
Secondary
Overall 4.45 15.18 0.075 0.56
Males 2.47 9.84 0.045 0.31
Females 1.98 5.35 0.029 0.25
Tertiary
Overall 0.69 2.9 0 0.37
Males 0.41 1.77 0 0.19
Females 0.28 1.13 0 0.18
Table 4: Overall and gender-Disaggregation by Province and Type of School (%):
Punjab Sindh KPK Balochistan
Public Private Public Private Public Private Public Private
Overall 26.4 13.05 20.38 5.62 13.14 3.55 13.12 0.78
Males 14.36 7.2 13 3.12 8.23 2.29 10.37 0.51
Females 12.04 5.83 7.38 2.49 4.97 1.26 2.79 0.27
Table 4: Descriptive Statistics:
Variable Observations Mean
Province 455705 2.12
Region 455705 1.62
Gender 455705 1.48
Primary School Time 455705 0.77
Middle School Time 455705 0.35
High School Time 455705 0.14
Primary School Transport 455705 0.67
Middle School Transport 455705 0.31
High School Transport 455705 0.19
School Type 233143 0.23
First Order 80228 0.21
Second Order 80228 0.22
Third Order 80228 0.20
Forth Order 80228 0.16
Fifth Order 80228 0.10
Mother Education 105553 2.36
Father Education 80281 6.09
Employment Status-Father 126445 4.55
Employment Status-Mother 126445 4.54
Log (Total Income) 22977 3.37
TABLE 6:Child Specific Characteristics:
SCHOOLTYPE LPM
(1)
LOGIT (2)
PROBIT (3) VARIABLES
Gender 0.0229*** 0.130*** 0.0750***
(0.00275) (0.0195) (0.0111)
Age -0.00523*** -0.00463*** -.00420***
(0.00067) (.00068) (.00067)
Middle School Time -0.00101 -0.0613** -0.0295*
(0.00321) (0.0283) (0.0151)
Primary School Time -0.0116*** -0.131*** -0.0650***
(0.00301) (0.0279) (0.0147)
High School Time 0.0216*** 0.110* 0.0642*
(0.00793) (0.0643) (0.0347)
Primary School Transport 0.0155** 0.112** 0.0533**
(0.00638) (0.0464) (0.0265)
Middle School Transport 0.0103*** 0.0705** 0.0318*
(0.00390) (0.0315) (0.0173)
High School Transport 0.0184*** 0.0979*** 0.0467**
(0.00436) (0.0332) (0.0185)
First Order 0.0484*** 0.300*** 0.179***
(0.00639) (0.0469) (0.0264)
Second Order 0.0261*** 0.146*** 0.0921***
(0.00604) (0.0447) (0.0251)
Third Order 0.0113* 0.0440 0.0363
(0.00579) (0.0431) (0.0241)
Forth Order 0.0104* 0.0482 0.0359
(0.00575) (0.0427) (0.0239)
Fifth Order 0.00605 0.0282 0.0219
(0.00609) (0.0454) (0.0254)
Constant 0.576*** 1.144*** 0.559***
(0.0189) (0.139) (0.0778)
Observations 80,228
Note: Margin Effects are given. Standard errors are given in parentheses. Significance Level:*** p<0.01, ** p<0.05, * p<0.1
Table 7:Parent Specific Characteristics:
SCHOOLTYPE: (1) (2) (3)
VARIABLES LPM LOGIT PROBIT
Mother Age -0.00167*** -0.0127*** -0.00695***
(0.000232) (0.00187) (0.00102)
Father Age 0.00287*** 0.0187*** 0.0110***
(0.000265) (0.00197) (0.00111)
Mother Education 0.0261*** 0.116*** 0.0703***
(0.000401) (0.00251) (0.00148)
Father Education 0.00625*** 0.0508*** 0.0288***
(0.000290) (0.00212) (0.00119)
Employment Status-Father 0.0166*** 0.128*** 0.0715***
(0.00111) (0.00838) (0.00465)
Employment Status-Mother - - -
Observations 80,228
Table 8:Household and Area Specific Characteristics:
SCHOOLTYPE (1) (2) (3)
VARIABLES LPM LOGIT PROBIT
Punjab 0.2048*** 0.2839*** 0.2728***
(0.00972) (0.00592) (0.00518)
Sindh 0.09061*** 0.1795*** 0.1626***
(0.00417) (0.00623) (0.00552)
KPK 0.17596*** 0.2615*** 0.2467***
(0.00463) (0.00646) (0.00577)
Region 0.1771*** 0.1475*** 0 .1511***
(0.00319) (0.02887) (0.00290)
Log (Total Income) 0.00307*** 0.0195*** 0.0108***
(0.000333) (0.00253) (0.00141)
Family Size -0.00253*** -0.0135*** -0.00570***
(0.000643) (0.00479) (0.00263)
Observations 80,228