ISSN 0975-928X
Research Article
Identification of elite lines and consistent markers linked to yield and yield
components in rice (
Oryza sativa
L.) using association mapping
Ashish Rajurkar, A. Bharathi, S. Reena and R. Chandra Babu*
Centre for Plant Molecular Biology and Biotechnology, Tamil Nadu Agricultural University, Coimbatore 641 003, India
E-mail: [email protected]
(Received: 20 July 2017; Revised: 31 Aug 2017; Accepted: 01 Sep 2017)
Abstract
Genetic variation is the foundation of crop improvement. Identifying donors for yield and yield components will help to develop high yielding cultivars. Yield being a complex trait, understanding its molecular genetics may hasten breeding for high yield. Identifying molecular markers associated with yield traits will improve efficiency of breeding. Forty-nine diverse rice genotypes were evaluated for yield and yield components under irrigated conditions in three separate field trials at Paddy Breeding Station, Coimbatore during February – June, 2014, August – December, 2014 and 2015. Significant variation for yield and yield-related traits was noticed among the genotypes. IR58821 and IR52561 gave consistently higher yield in three and two trials, respectively. Association mapping detected a total of 46 markers associated with growth and yield traits. PSM432, PSM371A and PSM167 were consistently associated with yield and harvest index. IR58821 and IR52561 and markers consistently associated with yield traits may help to develop improved rice cultivars through marker assisted breeding.
Keywords
Rice, Diverse germplasm, Yield, SSRs and Association mapping
Introduction
The demographic increase in the population which is estimated to reach 9 billion by 2050 is a major concern for global food security, placing enormous demands on agriculture and natural resources. Rice is the most important staple crop, feeding more than half of the world’s population. However, there is no major increase in rice productivity since 1990s due to its narrow genetic base and less genetic diversity of germplasm used in rice breeding programs (Xuan et al., 2010). Thus, to feed the increasing world population with limited arable land and declining natural resources, it is important to increase rice productivity during the next two-three decades by improving yield and yield-related traits. Increasing parental genetic diversity can significantly improve rice yield through increased variation in breeding process. Diverse germplasm can play a significant role in expanding the genetic base of cultivated rice varieties. The crosses between parents with maximum genetic divergence are generally the most responsive for genetic improvement. Diverse germplasm helps in broadening the genetic base, identifying recombinants and therefore, giving chance to breeders in selecting lines with favourable alleles.
We used 49 rice genotypes from different geographical regions which included several lines known for their specific adaptation to marginal environments. For example, cultivar, FR 13A is the flood tolerant donor of the submergence tolerance gene, Sub1 (Xu et al., 2006). Dular is a rice cultivar that has drought resistance associated with greater root length and root density (Henry et al., 2011). Rayada also has a large root length and high root
density (Henry et al., 2011). Black Gora is a rice cultivar with high seedling vigour (Redoña and Mackill, 1996) and deep roots (Shrestha et al., 2014). N22 is heat tolerant (Jagadish et al., 2008). Besides the diverse set also include local landraces, Nootripathu, Norungan and Kallurundaikar, which have been selected over generations by farmers for drought adaptation in rainfed production environment and are important repositories of genetic variability. This diverse panel has been recently used in association studies discovering markers linked to phenology, plant production and root traits under drought in target populations of environment (TPE) in this laboratory (Deshmukh et al., 2017).
The grain yield and yield-related traits are often complex in nature regulated by multiple genes. If the amount and distribution of favourable genes are unknown, it is difficult to apply the diverse rice germplasm in traditional breeding. In addition, there are interactions between genes underlying yield and related traits and growing environments. It is important to identify favourable yield related alleles/loci utilizing these diverse rice germplasms in specific ecological environment (Ya-Fang et al.,
2015).
ISSN 0975-928X
simple sequence repeat (SSR) markers is done in molecular genetics studies. Using SSR markers, researchers performed association studies on yield-related traits in different geographic collections of diverse rice varieties (Zhang et al., 2014). The extremely dense genetic markers have provided the potential for discovering genes underlying phenotypic diversity (Rietveld et al., 2013) comparable to low density markers, where the distance between the identified loci and target genes remains large, affecting their subsequent utilization in breeding (Ya-Fang et al., 2015). Genome wide association studies (GWAS) is cost effective and time saving approach for identifying genomic regions linked to traits of interest in plants since broad genetic resources can be scanned for marker-trait associations (Barabaschi
et al., 2016). It enables researchers to exploit natural diversity using modern genetic technologies and locate valuable genes in the genome.
With this background, in the present study, we studied marker-trait associations for yield related traits under irrigated conditions using GWAS to identify novel alleles using diverse rice lines for application in breeding for yield improvement in rice.
Materials and methods
Phenotyping: Field trials were conducted in
experimental fields of the University at Paddy Breeding Station, Tamil Nadu Agricultural University, Coimbatore. The 49 rice genotypes were evaluated for yield and related traits during February – June, 2014 (Trial 1), August – December, 2014 (Trial 2) and August – December, 2015 (Trial 3). Twenty-one day old seedlings were transplanted with a spacing of 20 x 10 cm. The plots were surface irrigated to field capacity once in every four days. NPK fertilizers were applied at the rate of 100:50:50 kg ha-1.
Data on days to 50 per cent flowering, plant height, number of productive tillers, panicle length, number of grains per panicle and yield per plant were collected following standard evaluation system for rice (IRRI, 1996). All the plants in each plot were harvested at maturity and grain yield (GY) and straw yield (SY) were recorded after sun drying. Total above ground biomass was computed by summing grain and straw yields. Harvest index (HI) was calculated as the ratio of grain weight to total above ground biomass for each germplasm.
Genotypic analysis: Genetic diversity analysis and population structure of these diverse rice were studied previously in our laboratory at Centre for Plant Molecular Biology and Biotechnology, TNAU, Coimbatore and reported earlier (Deshmukh et al., 2017). Briefly, genomic DNA was isolated by
CTAB procedure following Gawel and Jarret (1991). Rice lines were genotyped using 1403 SSR markers selected from across the genome by polymerase chain reaction (PCR). Information on primer sequences and PCR amplification conditions for each set of primers are available in public database (www.gramene.org/markers).
Marker-trait associations: Marker-trait association was carried out using TASSEL [Trait Analysis by aSSociation, Evolution and Linkage] version 3.0 software (Bradbury et al., 2007) considering gross level population structure (Q) in GLM analysis. The Q + K (kinship) model was used in the MLM analysis with P3D algorithm. It has been reported that the Q + K model reduces the false positive associations (Lu et al., 2015). Hence, the results of MLM are reported in the study.
Results and Discussion
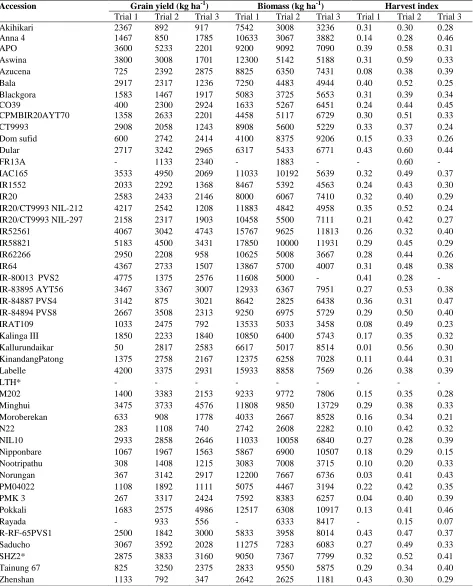
Variation in yield traits: Considerable variation in yield and yield related traits was observed among the rice genotypes in all the trials. The mean and range values of yield and yield components for the three trials are presented (Table 1). IR58821 (5183 kg ha-1), Apo (5233 kg ha-1) and the landrace, Pokkali (4986 kg ha-1) recorded higher yield in trial 1, 2 and 3, respectively (Table 2). In all the three trials, IR58821 consistently gave higher yield and total biomass. IR52561 has recorded significantly higher yield in trial 1 and 3 and total biomass in all three trials. IR58821 and IR52561 differ for a range of drought resistance traits viz.
gross root morphology, root penetration index, root pulling force and osmotic adjustment (Babu et al., 2001). IR58821 has high root penetration index and thicker roots, while IR52561 has low root penetration index and thinner roots (Biji et al., 2008). IR58821 had higher deep root mass under anaerobic flooded conditions (Azhiri-Sigari et al., 2000). IR58821 reported to be contributing favourable alleles for drought resistance and yield traits in a study using a mapping population derived from the cross IR58821xIR52561 (Manickavelu et al., 2006). IR58821 is known to have a deep and thick root system under well-watered conditions and higher water extraction from sub soils (Kamoshita et al., 2000).
ISSN 0975-928X
is an excellent source of salt tolerance and contributed major QTL, Saltol1, associated with Na/K ratio and salinity tolerance (Bonilla et al., 2002). The yield potential of these lines with adaptation to various stress environments will help developing cultivars with increasing rice yields even in marginal environments and sustaining global food security. Rayada showed less number of productive tillers in all the trials and higher harvest index in trial 1 and 3, while Dular recorded lower harvest index in trial 1 and 2. The average spikelet fertility ranged from 73 (trial 3) to 85% (trial 1) consistent with earlier observations of spikelet fertility ranging from 64 to 89% in rice (Yan et al., 2010).
The landrace, Kallurundaikar (50 kg ha-1 in trial 1) and the japonica ecotype, Zhenshan (792 kg ha-1 in trial 2) and (347 kg ha-1 in trial 3) recorded lower yields among the accessions. Zhenshan had shorter panicle length, 16.5 and 13.3 cm in trial 1 and 3, respectively. Panicle length is one aspect of panicle architecture and is usually measured as a yield-related trait together with spikelet number and density and seed setting rate which determines the grain number per panicle, hence yield increase in rice (Liu et al., 2016). Considerable variation of panicle length within subspecies was reported earlier in rice (Jambhulkar and Bose, 2014).
Marker-trait associations: Marker-trait analysis
identified significant markers associated (P < 0.05) with yield traits in all the trials. MLM analysis revealed association of 109, 108 and 157 markers for yield and yield traits in trial 1, 2 and 3, respectively (data not shown). Among them, 46 markers are associated traits in two out of the three trials (Supplementary table 1). Several marker regions showed pleiotropic effect for grain yield and yield components. For instance, PSM371A (Chr 1), RM6650 (Chr 2), PSM 432 (Chr 7) and RM5405 (Chr 7) were associated with grain yield in trial 1. PSM432 and PSM371A were also associated with grain yield in trial 2 and trial 3, respectively. PSM371A was also associated with harvest index (HI) and days to fifty percent flowering (DFF) in trial 3. Zhao et al., (2016) reported association of PSM371A with yield traits in rice. RM6650 was associated with straw yield (SY) and total biomass (TBM) in trial 1 and trial 3. RM6650 was also associated with number of tillers (NTT) and productive tillers (NPT) in trial 3. RM5405 was associated with GY in trial 1 and panicle length (PL) and spikelet fertility (SF) in trial 2. This marker was earlier reported for heading date (HD7) in rice (Ding et al., 2015). RM318 (Chr 2) was associated with GY and TBM in trial 2 and plant height (PH) in trial 2 and 3. Zou
et al., (2005) reported association of RM318 with PL under irrigated and SF and 1000 grain weight under water stress conditions in rice. PSM412 (Chr 11) and RM12 (Chr 12) were associated with GY
in trial 3. PSM412 was also associated with SF in trial 2 and HI in trial 3. RM12 was associated with PH and SY in both trial 2 and 3. RM12 was earlier reported for PH (Yu et al., 2002), yield and spikelet density (Liu et al., 2011) and grain quality traits in rice (Verma et al., 2015).
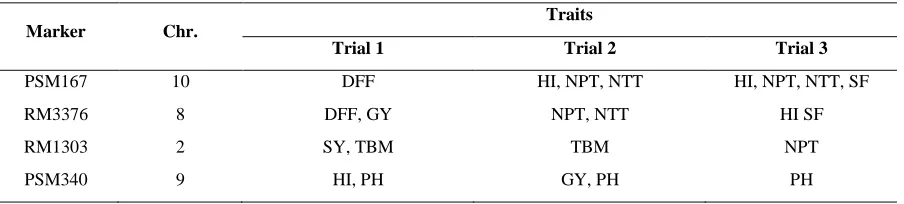
Four markers were detected in all the three trials (Table 3). For instance, PSM167 was associated with DFF in trial 1, HI, NTT and NPT in trial 2 and 3, and SF in trial 3. RM3376 was associated with DFF and GY in trial 1, NTT and NPT in trial 2, HI and SF in trial 3. PSM340 was associated with HI in trial 1, GY in trial 2 and PH in all the three trials. Linkage of plant height and yield QTLs under drought has been recently discussed (Vikram et al., 2016). RM1303 was associated with SY in trial 1 and TBM in trial 1 and trial 2 and NPT in trial 3. Hence these markers consistently detected for plant height (PSM340), biomass (RM1303) and HI (PSM167) may be useful for early selection.
To sum up, the SSR markers viz., PSM432 and PSM371A are consistently linked to yield traits across trials and the four high yielding genotypes
viz. IR58821, IR52561, Apo and Pokkali were identified as a good donors and can be used as better parents while formulating breeding for development of climate smart high yielding rice cultivars. Functional analysis and validation of genes underlying these genomic regions will help hastening breeding for yield increase in rice. Hence, association studies is a useful tool to identify novel alleles for high yield using diverse germplasm, thus saving time and resources required for conventional QTL mapping using biparental population with narrow genetic variation. While conventional linkage analysis works on an experimental population derived from a cross of bi-parents divergent for trait of interest, association mapping applies to collections of samples of much wider germplasm base. Providing the intrinsic nature of exploiting historical recombination events, association mapping offers increased mapping resolution to polymorphism at sequence level and should therefore enhance the efficiency of gene discovery and facilitate marker assisted selection (MAS) in plant breeding (Moose and Mumm, 2008).
References
Azhiri-Sigari, T., Yamauchi, A., Kamoshita, A. and Wade, L. J. 2000. Genotypic variation in response of rainfed lowland rice to drought and rewatering. II. Root growth. Plant Prod. Sci.,3: 180-188. Babu, R. C., Shashidhar, H. E., Lilley, J. M., Thanh, N. D.,
ISSN 0975-928X
Barabaschi, D., Tondelli, A., Desiderio, F., Volante, A., Vaccino, P., Valè, G. and Cattivelli, L. 2016. Next generation breeding. Plant Sci., 242: 3-13.
Biji, K. R., Jeyaprakash, P., Ganesh, S. K., Senthil, A. and Chandra Babu, R., 2008. Quantitative trait loci linked to plant production traits in rice (Oryza sativa) under drought stress in a target environment. Science Asia, 34:265-272. Bonilla, P. S., Dvorak, J., Mackell, D., Deal, K. and
Gregorio, G. 2002. RFLP and SSLP mapping of salinity tolerance genes in chromosome 1 of rice (Oryza sativa L.) using recombinant inbred lines. Philippine Agricultural Scientist (Philippines).
Bradbury, P. J., Zhang, Z., Kroon, D. E., Casstevens, T. M., Ramdoss, Y. and Buckler, E. S. 2007. TASSEL: software for association mapping of complex traits in diverse samples.
Bioinformatics, 23: 2633-2635.
Calingacion, M., Mumm, R., Tan, K., Quiatchon-Baeza, L., Concepcion, J.C., Hageman, J. A., Prakash, S., Fitzgerald, M. and Hall, R. D. 2017. A multidisciplinary phenotyping and genotyping analysis of a mapping population enables quality to be combined with yield in rice.
Front. Mol. Biosci., 4.
Deshmukh, V., Mankar, S., Muthukumar, C., Divahar, P., Bharathi, A., Helen Baby, T., Rajurkar, A., Reena, S., Poornima, R., Senthivel, S. and Chandra Babu, R. 2017. Genome-wide consistent molecular markers associated with phenology, plant production and root traits in diverse rice (Oryza sativa L.) accessions under drought in rainfed target populations of environment. Curr. Sci., (Accepted).
Ding, Z., Lin, Z., Li, Q., Wu, H., Xiang, C., and Wang, J. 2015. DNL1, encodes cellulose synthase-like D4, is a major QTL for plant height and leaf width in rice (Oryza sativa L.). Biochem. Biophys. Res. Commun., 457(2): 133-140. Gawel, N. J. and Jarret, R. L. 1991. A modified CTAB
DNA extraction procedure for musa and ipomoea plant. Mol. Biol. Rep., 9: 262-266. Henry, A., Gowda, V. R., Torres, R. O., McNally, K. L.,
and Serraj, R. 2011. Variation in root system architecture and drought response in rice (Oryza sativa): phenotyping of the OryzaSNP panel in rainfed lowland fields. Field Crops Res., 120(2): 205-214.
IRRI (International Rice Research Institute), International network for genetic evaluation of rice: Standard evaluation system for rice. IRRI, Los Banos, 1996.
Jagadish, S. V. K., Craufurd, P. Q., and Wheeler, T. R. 2008. Phenotyping parents of mapping populations of rice for heat tolerance during anthesis. Crop Sci., 48(3): 1140-1146. Kamoshita, A., Wade, L.J. and Yamauchi, A., 2000.
Genotypic variation in response of rainfed lowland rice to drought and rewatering. III. Water extraction during the drought period.
Plant Prod. Sci.,3(2): 189-196.
Kumar, A., Nayak, A. K., Pani, D. R., and Das, B. S. 2017. Physiological and morphological responses of four different rice cultivars to soil water potential based deficit irrigation management strategies. Field Crops Res., 205: 78-94.
Liu, T., Li, L., Zhang, Y., Xu, C., Li, X. and Xing, Y., 2011. Comparison of quantitative trait loci for rice yield, panicle length and spikelet density across three connected populations. J. Genet.,
90(2): 77-382.
Liu, E., Liu, Y., Wu, G., Zeng, S., Thi, T.G.T., Liang, L., Liang, Y., Dong, Z., She, D., Wang, H. and Zaid, I. U. 2016. Identification of a candidate gene for panicle length in rice (Oryza sativa
L.) via association and linkage analysis. Front. Plant. Sci., 7.
Lu, Q., Zhang, M., Niu, X., Wang, S., Xu, Q., Feng, Y., Wang, C., Deng, H., Yuan, X., Yu, H. and Wang, Y. 2015. Genetic variation and association mapping for 12 agronomic traits in indica rice. BMC genomics, 16(1): 1067. Manickavelu, A., Nadarajan, N., Ganesh, S. K.,
Gnanamalar, R. P., and Chandra Babu, R. 2006. Drought tolerance in rice: morphological and molecular genetic consideration. Plant Growth Regul., 50(2-3): 121-138.
Moose, S.P. and Mumm, R.H., 2008. Molecular plant breeding as the foundation for 21st century crop improvement. Plant physiology, 147(3): 969-977.
Redona, E. D., and Mackill, D. J. 1996. Genetic variation for seedling vigor traits in rice. Crop Sci., 36(2): 285-290.
Rietveld, C. A., Medland, S. E., Derringer, J., Yang, J., Esko, T., Martin, N. W., Westra, H. J., Shakhbazov, K., Abdellaoui, A., Agrawal, A. and Albrecht, E. 2013. GWAS of 126,559 individuals identifies genetic variants associated with educational attainment.
Science, 340(6139): 1467-1471.
Shrestha, R., Al-Shugeairy, Z., Al‐ Ogaidi, F., Munasinghe, M., Radermacher, M., Vandenhirtz, J. and Price, A. H. 2014. Comparing simple root phenotyping methods on a core set of rice genotypes. Plant Biology,
16(3): 632-642.
Venuprasad, R., Lafitte, H.R. and Atlin, G.N., 2007. Response to direct selection for grain yield under drought stress in rice. Crop Sci., 47(1): 285-293.
Verma, H., Pathak, K., Rathi, S., and Sarma, R. N. 2015. Association analysis for grain quality traits in rice. Indian J. Genet., 75(4): 506-509. Vikram, P., Kadam, S., Singh, B. P., Pal, J. K., Singh,
S., Singh, O. N., Swamy, B. M., Thiyagarajan, K., Singh, S. and Singh, N.K. 2016. Genetic diversity analysis reveals importance of green revolution gene (Sd1 locus) for drought tolerance in rice. Agricultural Research, 5(1): 1-12.
Xu, K., Xu, X., Fukao, T., Canlas, P., Maghirang-Rodriguez, R., Heuer, S., Ismail, A.M., Bailey-Serres, J., Ronald, P.C. and Mackill, D.J., 2006. Sub1A is an ethylene-response-factor-like gene that confers submergence tolerance to rice. Nat., 442(7103): 705. Xuan, Y. S., Jiang, W. Z., Liu, X. H., Cheng, Z. H. and
Yuan, D. L., 2010. Comparative analysis of genetic diversity of commercial rice cultivars in north eastern China. J. Plant Genet. Res.,
11(2): 206-212.
ISSN 0975-928X
and Shi-min, Z., 2015. Genome-wide association studies reveal new genetic targets for five panicle traits of international rice varieties. Rice Science, 22(5): 217-226. Yan, J., Yu, J., Tao, G. C., Vos, J., Bouman, B., Xie, G.
H. and Meinke, H., 2010. Yield formation and tillering dynamics of direct-seeded rice in flooded and nonflooded soils in the Huai River Basin of China. Field Crops Res., 116(3): 252-259.
Yu, S. B., Li, J. X., Xu, C. G., Tan, Y. F., Li, X. H., & Zhang, Q. 2002. Identification of quantitative trait loci and epistatic interactions for plant height and heading date in rice. Theor. Appl. Genet. 104(4): 619-625.
Zhao, F., Zhu, H., Zeng, R., Zhang, G., & Xu, S. 2016. Detection of additive and additive× environment interaction effects of QTLs for yield‐ component traits of rice using single‐ segment substitution lines (SSSLs).
Plant Breed., 135(4): 452-458.
Zhang, P., Liu, X., Tong, H., Lu, Y. and Li, J., 2014. Association mapping for important agronomic traits in core collection of rice (Oryza sativa
L.) with SSR markers. PloS one, 9(10): e111508.
ISSN 0975-928X
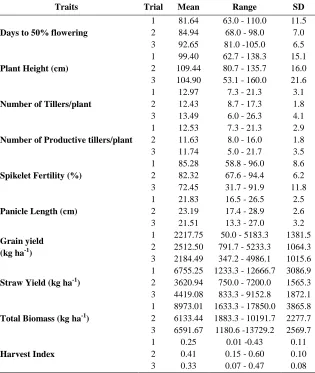
Table 1. Mean and range values of phenology and yield traits for 49 rice lines under irrigated conditions.
Traits Trial Mean Range SD
Days to 50% flowering
1 81.64 63.0 - 110.0 11.5 2 84.94 68.0 - 98.0 7.0 3 92.65 81.0 -105.0 6.5
Plant Height (cm)
1 99.40 62.7 - 138.3 15.1 2 109.44 80.7 - 135.7 16.0 3 104.90 53.1 - 160.0 21.6
Number of Tillers/plant
1 12.97 7.3 - 21.3 3.1 2 12.43 8.7 - 17.3 1.8 3 13.49 6.0 - 26.3 4.1
Number of Productive tillers/plant
1 12.53 7.3 - 21.3 2.9 2 11.63 8.0 - 16.0 1.8 3 11.74 5.0 - 21.7 3.5
Spikelet Fertility (%)
1 85.28 58.8 - 96.0 8.6 2 82.32 67.6 - 94.4 6.2 3 72.45 31.7 - 91.9 11.8
Panicle Length (cm)
1 21.83 16.5 - 26.5 2.5 2 23.19 17.4 - 28.9 2.6 3 21.51 13.3 - 27.0 3.2
Grain yield (kg ha-1)
1 2217.75 50.0 - 5183.3 1381.5 2 2512.50 791.7 - 5233.3 1064.3 3 2184.49 347.2 - 4986.1 1015.6
Straw Yield (kg ha-1)
1 6755.25 1233.3 - 12666.7 3086.9 2 3620.94 750.0 - 7200.0 1565.3 3 4419.08 833.3 - 9152.8 1872.1
Total Biomass (kg ha-1)
1 8973.01 1633.3 - 17850.0 3865.8 2 6133.44 1883.3 - 10191.7 2277.7 3 6591.67 1180.6 -13729.2 2569.7
Harvest Index
ISSN 0975-928X
Table 2. Yield and yield components of 49 rice lines under irrigated conditions across seasons
Accession Grain yield (kg ha-1) Biomass (kg ha-1) Harvest index
Trial 1 Trial 2 Trial 3 Trial 1 Trial 2 Trial 3 Trial 1 Trial 2 Trial 3
Akihikari 2367 892 917 7542 3008 3236 0.31 0.30 0.28
Anna 4 1467 850 1785 10633 3067 3882 0.14 0.28 0.46
APO 3600 5233 2201 9200 9092 7090 0.39 0.58 0.31
Aswina 3800 3008 1701 12300 5142 5188 0.31 0.59 0.33
Azucena 725 2392 2875 8825 6350 7431 0.08 0.38 0.39
Bala 2917 2317 1236 7250 4483 4944 0.40 0.52 0.25
Blackgora 1583 1467 1917 5083 3725 5653 0.31 0.39 0.34
CO39 400 2300 2924 1633 5267 6451 0.24 0.44 0.45
CPMBIR20AYT70 1358 2633 2201 4458 5117 6729 0.30 0.51 0.33
CT9993 2908 2058 1243 8908 5600 5229 0.33 0.37 0.24
Dom sufid 600 2742 2414 4100 8375 9206 0.15 0.33 0.26
Dular 2717 3242 2965 6317 5433 6771 0.43 0.60 0.44
FR13A - 1133 2340 - 1883 - - 0.60 -
IAC165 3533 4950 2069 11033 10192 5639 0.32 0.49 0.37
IR1552 2033 2292 1368 8467 5392 4563 0.24 0.43 0.30
IR20 2583 2433 2146 8000 6067 7410 0.32 0.40 0.29
IR20/CT9993 NIL-212 4217 2542 1208 11883 4842 4958 0.35 0.52 0.24
IR20/CT9993 NIL-297 2158 2317 1903 10458 5500 7111 0.21 0.42 0.27
IR52561 4067 3042 4743 15767 9625 11813 0.26 0.32 0.40
IR58821 5183 4500 3431 17850 10000 11931 0.29 0.45 0.29
IR62266 2950 2208 958 10625 5008 3667 0.28 0.44 0.26
IR64 4367 2733 1507 13867 5700 4007 0.31 0.48 0.38
IR-80013 PVS2 4775 1375 2576 11608 5000 - 0.41 0.28 -
IR-83895 AYT56 3467 3367 3007 12933 6367 7951 0.27 0.53 0.38
IR-84887 PVS4 3142 875 3021 8642 2825 6438 0.36 0.31 0.47
IR-84894 PVS8 2667 3508 2313 9250 6975 5729 0.29 0.50 0.40
IRAT109 1033 2475 792 13533 5033 3458 0.08 0.49 0.23
Kalinga III 1850 2233 1840 10850 6400 5743 0.17 0.35 0.32
Kallurundaikar 50 2817 2583 6617 5017 8514 0.01 0.56 0.30
KinandangPatong 1375 2758 2167 12375 6258 7028 0.11 0.44 0.31
Labelle 4200 3375 2931 15933 8858 7569 0.26 0.38 0.39
LTH* - - - -
M202 1400 3383 2153 9233 9772 7806 0.15 0.35 0.28
Minghui 3475 3733 4576 11808 9850 13729 0.29 0.38 0.33
Moroberekan 633 908 1778 4033 2667 8528 0.16 0.34 0.21
N22 283 1108 740 2742 2608 2282 0.10 0.42 0.32
NIL10 2933 2858 2646 11033 10058 6840 0.27 0.28 0.39
Nipponbare 1067 1967 1563 5867 6900 10507 0.18 0.29 0.15
Nootripathu 308 1408 1215 3083 7008 3715 0.10 0.20 0.33
Norungan 367 3142 2917 12200 7667 6736 0.03 0.41 0.43
PM04022 1108 1892 1111 5075 4467 3194 0.22 0.42 0.35
PMK 3 267 3317 2424 7592 8383 6257 0.04 0.40 0.39
Pokkali 1683 2575 4986 12517 6308 10917 0.13 0.41 0.46
Rayada - 933 556 - 6333 8417 - 0.15 0.07
R-RF-65PVS1 2500 1842 3000 5833 3958 8014 0.43 0.47 0.37
Saducho 3067 3592 2028 11275 7283 6083 0.27 0.49 0.33
SHZ2* 2875 3833 3160 9050 7367 7799 0.32 0.52 0.41
Tainung 67 825 3250 2375 2833 9550 5875 0.29 0.34 0.40
Zhenshan 1133 792 347 2642 2625 1181 0.43 0.30 0.29
ISSN 0975-928X
Table 3. Consistent marker-trait associations in 49 diverse rice accessions across trials conducted under irrigated conditions
Marker Chr.
Traits
Trial 1 Trial 2 Trial 3
PSM167 10 DFF HI, NPT, NTT HI, NPT, NTT, SF
RM3376 8 DFF, GY NPT, NTT HI SF
RM1303 2 SY, TBM TBM NPT
PSM340 9 HI, PH GY, PH PH
Trial 1: Feb., – June 2014, Trial 2: Aug., – Dec., 2014 and Trial 3: Aug., - Dec., 2015