Research Note
Evaluation of elite fine grain aromatic rice lines for agro-morphological
traits under mid hill condition of Uttarakhand
J. P. Aditya*, Anuradha Bhartiya and P.K. Agrawal
Improvement Division, ICAR-Vivekananda Parvatiya Krishi Anusandhan Sansthan, Almora 263 601 (Uttarakhand)
E-mail: [email protected]
(Received: 23 March 2015; Accepted: 20 Oct 2016)
Abstract
The present investigation was carried out to find out the yield performance and extent of genetic variability present in the fine grain aromatic rice advanced lines under mid hill conditions of Uttarakhand. Sixteen fine grain aromatic rice genotypes were evaluated for fifteen quantitative traits in a completely randomized block design with three replications during Kharif season. Highly significant differences were found for most of the traits, indicating the existence of genetic variability varying from lower to higher coefficients. The results found that the highest estimates of genotypic and phenotypic coefficient of variability for grain yield per plot (20.74% and 22.21%) whereas moderate level was observed for plant height (12.19% and 12.27%), panicles per plant (9.78% and15.19%), grains per panicle (11.40% and12.05%) and fertile grains per panicle (11.74% and 12.29%) respectively, indicating considerable amount of variability expressed for these traits. High heritability as well as high genetic advance was exhibited by traits viz., plant height (97.71% and 29.05%), number of grains per panicle (89.49% and 27.81%) and fertile grains per panicle (91.23% and 22.98%) signifying that for the improvement of these traits selection may be rewarding. Grain yield was observed to be significantly and positively correlated with plant height (0.467), flag leaf length (0.389), thousand grain weights (0.523) and kernel length (0.322) suggesting the scope of these traits for improving yield of fine grain aromatic rice through indirect selection. The path coefficient analysis showed that kernel length (1.675) had the highest positive direct effect on grain yield followed by days to maturity (1.053), grains per panicle (0.585), thousand grain weight (0.501), panicles per plant (0.305) and plant height (0.285). Therefore, these traits should be considered as significant while formulating the selection criteria in fine grain aromatic rice breeding for yield under the mid hill conditions of Uttarakhand.
Key words
Correlation, fine grain aromatic rice, variability and path analysis
Globally, rice (Oryza sativa L.) is the most important food crop for more than one third of world’s population (Singh and Singh, 2008) and the only cereal that constitutes a major source of calories for the urban and rural populations (Sasaki and Burr, 2000). About 90% of total world rice is grown and consumed by Asia, in which 50% is contributed by China and India alone. India is known to produce best quality rice worldwide and possesses an immense wealth of rice exhibiting a wide variability in their grain quality, cooking characteristics and fragrance. Among them, aromatic rice is nature’s gift exclusive to Indian sub-continent (Glaszman, 1987) which forms a separate group and preferred by consumers all over the world due to its flavor and palatability (Jewel
et al., 2011). The aroma associated with some domestic rice varieties may have arisen from a gene mutation during evolution or be outcome of a separate domestication event (Bradbury et. al., 2005). Scented rice grow best and produce finest quality grains under cool and humid conditions common in Himalayan Tarai of U.P and Uttarakhand (Bajpai et al., 2012) which is probably the place of origin of aromatic rice (Khush, 2000). Uttarakhand is considered as one of the hot spots for aromatic rice diversity. The highly priced aromatic rice ‘Basmati’ is said to be
originated in the foot hills of Himalayas and characterized by the extra long slender grain, pleasant and distinct aroma coupled with soft and
fluffy texture of the cooked rice (Nagaraju et al.,
2002). In Uttarakhand, production of aromatic rice cultivation is confined to Himalayan foot hills particularly, in Dehradun, Nainital, Udham Singh Nagar and Haridwar districts whereas at mid and high altitudes its cultivation encounters the problem of low temperature stress during reproductive phase, in addition to late maturity and high percentage of sterile grains. So far, no systematic effort has been made to develop the fine grain aromatic rice genotypes suitable for the agro-ecological conditions of hills. Therefore, some elite fine grain aromatic rice advanced lines are evaluated to find out their suitability in hills of Uttarakhand.
A field experiment was conducted with 16 aromatic fine grain irrigated rice genotypes in a completely randomized block design with three replications during kharif, season at Experimental Farm, VPKAS, Almora (29035’N and 79039’E at 1,250 m asl). The seedlings of each genotype were transplanted in 10 rows plots, 2.4 m long, with 20cm x 15cm spacing. Observations were recorded on plant height, days to fifty per cent flowering, days to maturity, tillers per plant, flag leaf length, flag leaf width, panicles per plant, panicle length, grains per panicle, fertile grain per panicle, thousand grain weight, kernel length, kernel width, L/B ratio and grain yield per plot. Ten representative plants of each genotype in each replication were randomly selected and observations were recorded on plant height, tillers per plant, flag leaf length, flag leaf width, panicles per plant, panicle length, grains per panicle, fertile grain per panicle. Five dehulled and milled grains from each genotype were for recording Kernel length, Kernel width and L/B ratio. Days to 50 per cent flowering, days to maturity and grain yield were recorded on plot basis. Seed weight was recorded by weighing thousand grains of each genotype. The mean value of each replication was subjected to statistical analysis using INDOSTAT software package (Version 8.1). In addition, the mean data after computing for each character was subjected to standard method of analysis of variance following Panse and Sukhatme (1985). The phenotypic and genotypic coefficient of variability, heritability in broad sense, genetic advance at 5% selection intensity were computed as suggested by Johanson et al. (1955).The phenotypic correlations coefficients among all the traits under study were calculated following Al-Jibouri et al. (1958) and the path analysis was carried out as per method of Dewey and Lu (1959).
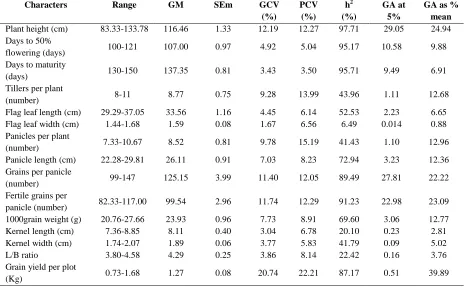
The analysis of variance indicated the existence of highly significant differences among the genotypes for all the characters except flag leaf width, kernel length and L/B ratio (Table1). Range, mean value, genotypic coefficient of variation, phenotypic coefficient of variation, heritability and genetic advance at 5% selection intensity indicate significant variability in most of the characters (Table 2) indicating enough scope for their exploitation. The estimate of standard error was lower than 10% of the population means indicating less role of uncontrollable environment in the experimental results suggesting which showed that results can be accepted with high reliablity. The plant height varies from 83.33cm (VL 31077) to 133.78cm (VL 31152), days to 50 per cent flowering from 100 days (VL 31487) to 121 days (Pusa Basmati 1), maturity from 130 days (VL 31487) to 150 days (Pusa Basmati 1), flag leaf length from 29.29 cm (Pusa Sugandha 2) to 37.05cm (VL 31152), panicles per plant from 7 (VL 31484) to 11 (VL 31211), panicle length from
22.28 cm (VL 31077) to 29.81 cm (VL 31484), grains per panicle from 99 (VL 31218) to 147 (VL 31211), fertile grains per panicle from 82 (VL 31218) to 117 (VL 31211), thousand grain weight from 20.76g (VL 31077) to 27.66g (VL 31487). Kernel length and kernel width are important quality characters and it ranged from 7.36mm (Basmati 370) to 8.85 mm (VL 31487) and 1.74 mm (VL 31528) to 2.07mm (VL 31484), respectively. The grain yield per plot varied from 0.73 kg (Pusa Sugandha 2) to 1.68 kg (VL 31157).
In general, all the traits exhibited higher magnitude of PCV than GCV indicating the effect of environment on the manifestation of these traits. However, the differences between PCV and GCV were very small for most of the characters indicating the lesser contribution of environmental variation towards the expression of these traits. The highest estimate of GCV and PCV was found for grain yield per plot (20.74% and 22.21%, respectively). Padmaja et al. (2008) also recorded similar observation for single plant yield. Moderate level of GCV and PCV was observed for plant height (12.19% and 12.27%, respectively), tillers per plant (9.28 % and 13.99 %, respectively), panicles per plant (9.78% and 15.19%, respectively), grains per panicle (11.40% and 12.05%, respectively) and fertile grains per panicle (11.74% and 12.29%, respectively) indicating considerable amount of variability expressed for these traits. Sharma and Sharma (2007) also reported similar results for these characters. Low GCV and PCV estimates were noticed for days to 50 per cent flowering, days to maturity, flag leaf length and width, panicle length, thousand grain weight, kernel length, kernel width and L/B ratio. These results are in conformity with Sinha et al.
(2004) for days to 50 per cent flowering, Padmaja
et al. (2008) for days to 50 per cent flowering and panicle length. The estimates of PCV were almost similar to the corresponding GCV estimates for plant height, days to 50 % flowering, days to maturity, and fertile grains per panicle indicating that the characters were less influenced by the environment. Therefore, selection on the basis of phenotype alone can be effective for the improvement of these traits. Similar observations were also recorded by Karad and Pol (2008); Ubarhande et al. (2009) in rice genotypes.
progress that can be expected as a result of exercising selection on a population. Genetic advance was observed to be highest for plant height (29.05) followed by grains per panicle (27.81) and fertile grains per panicle (22.98). Sharma and Sharma (2007) also reported similar results for these characters. High heritability as well as high genetic advance was exhibited by traits viz., Plant height (97.71% and 29.05%, respectively), number of grains per panicle (89.49% and 27.81%, respectively) and fertile grains per panicle (91.23% and 22.98%, respectively). It suggests that these characters were predominantly controlled by additive gene action. Therefore, genetic improvement through selection for these traits may be effective. Heritability estimates along with genetic advance are more helpful in predicting gain under selection than heritability estimate alone (Sinha et al. 2004; Johnson et al. 1955).
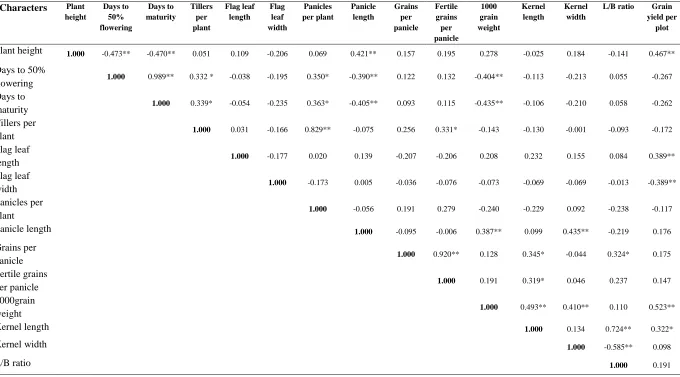
Grain yield was observed to be significantly and positively correlated with plant height (0.467), flag leaf length (0.389), thousand grain weight (0.523) and kernel length (0.322) whereas, with flag leaf width (-0.389) significant negative correlation was observed (Table 3). Sharma and Sharma (2007) also reported similar finding. Plant height was significant and positively correlated with panicle length. Sharma and Sharma (2009); Subudhi and Dikshit (2009) reported significant and positive correlation between plant height and panicle length. Days to 50 per cent flowering, days to maturity, tillers per plant and panicles per plant were mutually correlated with each other. Panicle length exhibited significant and positive correlation with thousand grain weights (0.387) and kernel width (0.435). Grains per panicle showed significant and positive correlation with fertile grains per panicle (0.920), kernel length (0.345) and L/B ratio (0.324). Thousand grain weight was significant and positively correlated with kernel length (0.493) and kernel width (0.410). Kernel length showed significant and positive correlation with L/B ratio (0.724). Simple correlation analysis relates seed yield to a single variable may not provide a complete understanding about the importance of each component in determining seed yield. Correlation along with path analysis would give a better insight into cause and effect relationship between different pairs of characters (Jayasudha and Sharma, 2010) than correlation alone. Path coefficient analysis provides an insight into the inter-relationship of various yield components with grain yield and separates the direct effects from the indirect effects and helps in making the selection more effective (Priya and Joel, 2009).
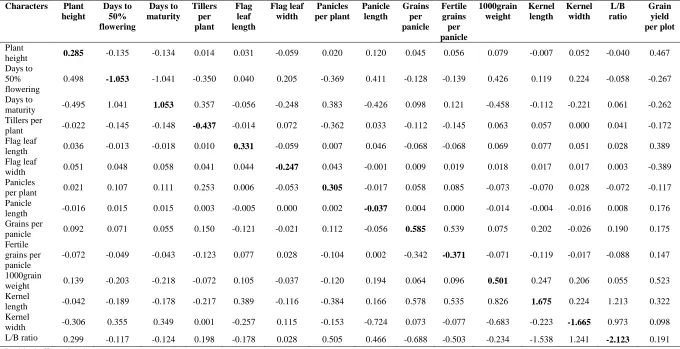
Considering grain yield as the artifact and the correlation coefficients of these causal factors with grain yield is partitioned into direct and indirect
effects (Table 4). The path coefficient analysis showed that kernel length (1.675) had the highest positive direct effect on grain yield followed by days to maturity (1.053), grains per panicle (0.585), thousand grain weight (0.501), flag leaf length(0.331), panicles per plant (0.305) and plant height (0.285) (Table 4). Highest positive but indirect effect was observed for kernel width via L/B ratio (1.241) followed by L/B ratio via kernel length (1.213) and days to 50% flowering via days to maturity (1.041). Plant height, tillers per plant, panicles per plant and panicle length were observed to contribute positively to an appreciable extent via L/B ratio. Direct and indirect effect of yield component traits on grain yield have also been reported earlier by Shivani and Reddy (2000); Kavitha and Reddi (2001); Biao et al. (2002); Shanthala et al. (2004) and Shashidhar et al.
(2005). Therefore, these traits may be considered as significant for formulating a selection criterion in fine grain aromatic rice breeding for yield under the mid hills of Uttarakhand.
References
Al. Jibouri H.A., Miller R.A., Robinson H.F. 1958. Genetic environmental variances and covariances in an upland cotton cross interspecific origin. Agron. J. 50: 633-636.
Bajpai A, Singh Y and Singh US.2012. Evaluation
of Grain Quality Kalanamak
varieties/lines cultivated in Uttar Pradesh.
Int. J. of Scientific and Res. Publications, 2(10): 1-4.
Biao, G.L., Lijun, L., Zhong, X.Y., Yipin, W., Wei, M.H., Qian, Q. and Cunshan, Y. 2002. Path analysis for yield and its component characters in rice. Chinese Rice Res. Newsletter, 10: 5-6.
Bradbury, M.T., Fitzgerald, T.L., Henry, R.J., Jin, Q.S. and Waters, L.E. 2005. The gene for fragrance in rice. Plant biotechnology J., 3: 363-370.
Dewey, D.R. and Lu, K.H. 1959. A correlation and path coefficient analysis of components of crested wheat grass seed populations.
Agron. J., 51: 515-518.
Glaszman, J.J.C.1987. Isozyme and classification of Asian rice varieties. Theor. App. Genet., 74: 21-30.
Jayasudha, S. and Sharma D. 2010. Genetic parameters of variability, correlation and path-coefficient for grain yield and physiological traits in rice (Oryza sativa L.) under shallow lowland situation.
Elect. J. Pl. Breed., 1(5): 33-38.
Johnson, H.N., Robinson, H.F. and Comstock, R.E. 1955. Estimate of genetic and environmental variability in soybean.
Agron. J., 27: 314-318.
Karad, S.R. and Pol, K.M. 2008 Character association, genetic variability and path coefficient analysis in rice (Oryza sativa
L.). Int. J. of Agric. Sci. 4(2): 663-666. Kavitha, S. and Reddi, N.S.R. 2001. Correlation
and path coefficient analysis of yield component in rice (Oryza sativa L.) The Andra Agric. J., 48:311-314.
Khush, G.S. 2000. Taxonomy and origin of rice.
In: Aromatic Rices (Singh R K, Singh U S, and Khush G S, Eds.). Oxford & IBH Publishing Co., New Delhi. 5-14.
Nagaraju, J., Kathirvel, M., Kumar, R.R., Siddiq, E.A. and Hasnain, S.E. 2002. Genetic analysis of traditional and evolved basmati and non basmati rice varieties using fluorescence based ISSR-PCR and SSR markers. Proc. Of Nat. Acad. Sci.
(USA) 99 pp 5836-41.
Padmaja, D., Radhika, K., Subba Rao L.V. and Padma, V. 2008. Studies on variability, heritability and genetic advance for quantitative characters in rice (Oryza sativa L.) Indian J. Plant Genet. Resour., 21(3): 196-198.
Panse, V.G. and Sukhatme, P.V. 1985. Statistical methods for agricultural workers. Indian Council of Agricultural research, New Delhi.
Priya, A.A. and Joel, A.J. 2009. Grain yield response of rice cultivars under upland condition. Elect. J. Pl. Breed., 1: 6-11. Sasaki, T. and Burr, B. 2000. Internationalo rice
genome sequence project: the effort to complete the sequence of rice genome.
Current Opinion in Plant Biology, 3(2): 138-141.
Shanthala, J., Latha, J. and Hittalmani. 2004. Path coefficient analysis for grain yields and in component characters in hybrid rice.
Environment and ecology, 22: 734-736. Sharma, A.K. and Sharma, R.N. 2007. Genetic
variability and character association in early maturing rice. Oryza, 44(4): 300-303.
Sharma, M.K. and Sharma, A.K. 2009. Character association and path analysis of yield and its component in direct seeded upland rice (Oryza sativa L.). Prog. Agric., 9(1): 117-120.
Shashidhar, H.E., Pasha, F., Janamatti, M., Vinod, M.S. and Kanbar, A. 2005. Correlation and path coefficient analysis in traditional cultivars and double haploid lines of rainfed low land rice. Oryza, 42: 156-159. Shivani, D. and Reddy, N.S.R. 2000. Correlation and path analysis in rice (Oryza sativa L.) hybrids. Oryza, 37: 183-186.
Singh, Y. and Singh, U.S. 2008. Genetic diversity analysis in aromatic rice germplasm using agro-morphological traits. J. of Pl. Genet. Resour., 21(1): 32-37.
Sinha, S.K., Tripathi, A.K. and Bisen, U.K. 2004. Study of genetic variability and correlation coefficient analysis in midland land races of rice. Annal. of Agric. Res., 25(1):1-3.
Subudhi, H.N. and Dikshit, N. 2009. Variability and character association of yield components in rainfed lowland rice.
Indian J. Plant Genet. Resour., 22(1): 31-35.
Ubarhande, V.A., Prasad, R., Singh, R.P., Singh,
S.P. and Agrawal, R.K. 2009.
Table 1. Analysis of variance for various yield contributing characters
Source of variance Replication Treatments Error
d.f 2 15 30
Plant height 1.08 607.11** 2.64
Days to 50% flowering 0.25 84.49** 1.41
Days to maturity 0.08 67.53** 0.99
Tillers per plant 2.33 2.83** 0.84
Flag leaf length 2.74 8.71** 2.01
Flag leaf width 0.0001 0.012 0.01
Panicles per plant 0.27 3.06** 0.98
Panicle length 0.64 11.35** 1.25
Grains per panicle 0.33 634.93** 23.91
Fertile grains per panicle 1.89 422.57** 13.12
1000grain weight 0.89 10.87** 1.38
Kernel length 0.15 0.42 0.24
Kernel width 0.002 0.022** 0.007
L/B ratio 0.064 0.177 0.095
Grain yield per plot 0.03 0.212** 0.01
** Significant at 1 per cent level of probability
Table 2. Range, mean and genetic parameters of 15 yield attributing characters in fine grain aromatic rice
Characters Range GM SEm GCV
(%)
PCV (%)
h2 (%)
GA at 5%
GA as % mean Plant height (cm) 83.33-133.78 116.46 1.33 12.19 12.27 97.71 29.05 24.94 Days to 50%
flowering (days) 100-121 107.00 0.97 4.92 5.04 95.17 10.58 9.88
Days to maturity
(days) 130-150 137.35 0.81 3.43 3.50 95.71 9.49 6.91
Tillers per plant
(number) 8-11 8.77 0.75 9.28 13.99 43.96 1.11 12.68
Flag leaf length (cm) 29.29-37.05 33.56 1.16 4.45 6.14 52.53 2.23 6.65 Flag leaf width (cm) 1.44-1.68 1.59 0.08 1.67 6.56 6.49 0.014 0.88 Panicles per plant
(number) 7.33-10.67 8.52 0.81 9.78 15.19 41.43 1.10 12.96
Panicle length (cm) 22.28-29.81 26.11 0.91 7.03 8.23 72.94 3.23 12.36 Grains per panicle
(number) 99-147 125.15 3.99 11.40 12.05 89.49 27.81 22.22
Fertile grains per
panicle (number) 82.33-117.00 99.54 2.96 11.74 12.29 91.23 22.98 23.09 1000grain weight (g) 20.76-27.66 23.93 0.96 7.73 8.91 69.60 3.06 12.77 Kernel length (cm) 7.36-8.85 8.11 0.40 3.04 6.78 20.10 0.23 2.81 Kernel width (cm) 1.74-2.07 1.89 0.06 3.77 5.83 41.79 0.09 5.02
L/B ratio 3.80-4.58 4.29 0.25 3.86 8.14 22.42 0.16 3.76
Grain yield per plot
Table 3. Phenotypic correlation coefficients among grain yield and component traits in fine grain aromatic rice
*, ** Significant at 5 and 1 per cent level, respectively. Characters Plant
height
Days to 50% flowering
Days to maturity
Tillers per plant
Flag leaf length
Flag leaf width
Panicles per plant
Panicle length
Grains per panicle
Fertile grains per panicle
1000 grain weight
Kernel length
Kernel width
L/B ratio Grain
yield per plot
Plant height 1.000 -0.473** -0.470** 0.051 0.109 -0.206 0.069 0.421** 0.157 0.195 0.278 -0.025 0.184 -0.141 0.467**
Days to 50%
flowering 1.000 0.989** 0.332 * -0.038 -0.195 0.350* -0.390** 0.122 0.132 -0.404** -0.113 -0.213 0.055 -0.267
Days to
maturity 1.000 0.339* -0.054 -0.235 0.363* -0.405** 0.093 0.115 -0.435** -0.106 -0.210 0.058 -0.262
Tillers per
plant 1.000 0.031 -0.166 0.829** -0.075 0.256 0.331* -0.143 -0.130 -0.001 -0.093 -0.172
Flag leaf
length 1.000 -0.177 0.020 0.139 -0.207 -0.206 0.208 0.232 0.155 0.084 0.389**
Flag leaf
width 1.000 -0.173 0.005 -0.036 -0.076 -0.073 -0.069 -0.069 -0.013 -0.389**
Panicles per
plant 1.000 -0.056 0.191 0.279 -0.240 -0.229 0.092 -0.238 -0.117
Panicle length 1.000 -0.095 -0.006 0.387** 0.099 0.435** -0.219 0.176
Grains per
panicle 1.000 0.920** 0.128 0.345* -0.044 0.324* 0.175
Fertile grains
per panicle 1.000 0.191 0.319* 0.046 0.237 0.147
1000grain
weight 1.000 0.493** 0.410** 0.110 0.523**
Kernel length 1.000 0.134 0.724** 0.322*
Kernel width 1.000 -0.585** 0.098
Table 4. Phenotypic path coefficient analysis among the quantitative characters in spring sown rainfed upland rice
Characters Plant height
Days to 50% flowering
Days to maturity
Tillers per plant
Flag leaf length
Flag leaf width
Panicles per plant
Panicle length
Grains per panicle
Fertile grains per panicle
1000grain weight
Kernel length
Kernel width
L/B ratio
Grain yield per plot
Plant
height 0.285 -0.135 -0.134 0.014 0.031 -0.059 0.020 0.120 0.045 0.056 0.079 -0.007 0.052 -0.040 0.467 Days to
50% flowering
0.498 -1.053 -1.041 -0.350 0.040 0.205 -0.369 0.411 -0.128 -0.139 0.426 0.119 0.224 -0.058 -0.267
Days to
maturity -0.495 1.041 1.053 0.357 -0.056 -0.248 0.383 -0.426 0.098 0.121 -0.458 -0.112 -0.221 0.061 -0.262 Tillers per
plant -0.022 -0.145 -0.148 -0.437 -0.014 0.072 -0.362 0.033 -0.112 -0.145 0.063 0.057 0.000 0.041 -0.172 Flag leaf
length 0.036 -0.013 -0.018 0.010 0.331 -0.059 0.007 0.046 -0.068 -0.068 0.069 0.077 0.051 0.028 0.389 Flag leaf
width 0.051 0.048 0.058 0.041 0.044 -0.247 0.043 -0.001 0.009 0.019 0.018 0.017 0.017 0.003 -0.389 Panicles
per plant 0.021 0.107 0.111 0.253 0.006 -0.053 0.305 -0.017 0.058 0.085 -0.073 -0.070 0.028 -0.072 -0.117 Panicle
length -0.016 0.015 0.015 0.003 -0.005 0.000 0.002 -0.037 0.004 0.000 -0.014 -0.004 -0.016 0.008 0.176 Grains per
panicle 0.092 0.071 0.055 0.150 -0.121 -0.021 0.112 -0.056 0.585 0.539 0.075 0.202 -0.026 0.190 0.175 Fertile
grains per panicle
-0.072 -0.049 -0.043 -0.123 0.077 0.028 -0.104 0.002 -0.342 -0.371 -0.071 -0.119 -0.017 -0.088 0.147
1000grain
weight 0.139 -0.203 -0.218 -0.072 0.105 -0.037 -0.120 0.194 0.064 0.096 0.501 0.247 0.206 0.055 0.523 Kernel
length -0.042 -0.189 -0.178 -0.217 0.389 -0.116 -0.384 0.166 0.578 0.535 0.826 1.675 0.224 1.213 0.322 Kernel
width -0.306 0.355 0.349 0.001 -0.257 0.115 -0.153 -0.724 0.073 -0.077 -0.683 -0.223 -1.665 0.973 0.098 L/B ratio 0.299 -0.117 -0.124 0.198 -0.178 0.028 0.505 0.466 -0.688 -0.503 -0.234 -1.538 1.241 -2.123 0.191