Vol.8 (2018) No. 5
ISSN: 2088-5334
Robust Features for Elbow Joint Angle Estimation Based on
Electromyography
Triwiyanto
1,3, Oyas Wahyunggoro
1, Hanung Adi Nugroho
1,#, Herianto
2 1Department of Electrical Engineering & Information Technology, Faculty of Engineering, Universitas Gadjah Mada, Grafika No. 2, Yogyakarta, Indonesia
2
Department of Mechanical & Industrial Engineering, Faculty of Engineering, Universitas Gadjah Mada, Grafika No. 2, Yogyakarta, Indonesia
3
Department of Electromedical Engineering,
Politeknik Kesehatan Kementerian Kesehatan Surabaya, Pucang Jajar Timur No 10, Surabaya, Indonesia
#
Abstract—A noisy environment is a major problem which has to be resolved to get a good performance in the estimation. A robust feature is important in order to obtain an accurate position of the elbow joint from the electromyography (EMG) signal. The objective of this research is to modify and assess the time domain features which robust against the white Gaussian noise. In this work, the EMG signal (from biceps) contaminated by artificial white Gaussian noise was extracted using twelve standard time domain features
and one modified feature. The threshold of the modified feature (MYOPM) was calculated based on the root mean square (RMS) of
the contaminated EMG signal. The linear Kalman filter was used to refine the EMG features and to improve the estimation. The robustness of the features was calculated using the root mean square error (RMSE). Based on the RMSE values, it shows that the
proposed feature MYOPM is the most robust feature (the lowest median RMSE of 9º) for the signal to noise ratio (SNR) ranged
between 17.96 and 60 dB, compared with the others’ features. The mean RMSE of the MYOPM feature improves by 27.91% from the
prior feature (MYOP).
Keywords— EMG; feature extraction; Kalman filter; white Gaussian noise; elbow joint angle estimation.
I. INTRODUCTION
Recently, the electromyography (EMG) has been used a lot in many applications to support human for better life, such as prosthetic devices, exoskeleton robotic (as an assistive or rehabilitative function) [1]. Generally, the EMG signal has a low amplitude, so it is easy to be contaminated by external or internal noise [2] [3]. The internal noise may come from the electrocardiography (ECG) signal. The external noise may come from the motion of artifact, the interference from the power line (50 Hz), the electronic circuits, and white Gaussian noise. If the characteristics of the noise are known, then a filter can be constructed to reduce the noise. The white Gaussian noise (WGN) is difficult to reduce or cancel out because it covers a wide range of frequency spectrum and random amplitude and frequency [4].
Smital used an adaptive wavelet Wiener to reduce the white Gaussian noise on the ECG signal [5]. The threshold
level of the wavelet Wiener for each level of the decomposition was constructed using the standard error of the noise. Although the method could increase the SNR, the noise needed to be identified first. Thongpanja could identify the white Gaussian noise, power line interference, and motion artifact noise using a statistical method to estimate the probability density function (PDF) [6]. However, as the limitations of his study, he did not calculate the SNR and did not measure the EMG signal in motion condition.
robustness, class discrimination, and computational complexity parameters [8]. From his study, the EMG histogram was the most effective feature for class discrimination. However, there was no calculation of SNR as a standard of measure when the robustness against the noise was considered in the feature extraction. Guo [9] developed a threshold detector system to detect and minimize the known noise. However, his proposed method is dedicated to independent non-Gaussian noise.
Generally, the devices controlled using EMG signal are classified into two approaches namely machine learning and non-machine learning methods [10]. Oskei evaluated six of the time domain features to discriminate between five classes of motion using a support vector machine (SVM) [11]. However, the performance increased when the SVM used multi features as the input of the classifier. Tach studied the stability and robustness of time domain features to identify five different movements using linear discriminant analysis (LDA) [12]. However, the results showed that the accuracy would enhance by using at least four combined features. The use of machine learning approach as a classifier, as mentioned by the prior study, is easy, but it needs to reconfigure the network each time the subject is changed. The non-machine learning methods were also developed by some previous studies which using EMG signal to predict the position of the elbow, such as Kalman filtering [13], Hill-based muscle model [14], and a combination of time domain feature and low-pass filter [15]. A wide range of application such as in digital signal processing, mobile tracking, and robotic have used Kalman filter as an estimator. Kalman filter gives an effective estimation by utilizing the prior state, measurement noise (R) and process noise (Q).
The previous studies concerned more in evaluating the robustness of the feature as the input of the classifier, which was discriminated into some classes. The studies that evaluated the robustness of the features for elbow joint estimation based on the EMG signal were rarely found in the literature. Thus, the objective of this study is to modify and assess the time domain features which robust against the white Gaussian noise. In order to perform the proposed method, the twelve standard time domain features and one modified time domain feature are investigated to predict the position of the elbow joint using EMG signal. A linear Kalman filter is used in this study to filter the output of the features and to improve the performance of the estimation. The performance and robustness are evaluated to find the effectiveness of the features. The performance is calculated using the root mean square error (RMSE). The robustness of the features is examined by contaminating an artificial white Gaussian noise to the original EMG signal.
This paper is arranged as follows: Section 2 introduces the materials and methods used in this study. Section 3 shows the results of the experiment, data analysis, and discussion. Section 4 presents the conclusions.
II. MATERIALS AND METHODS
A. Data Acquisition
The ethics committee of Health Polytechnic of Surabaya, Ministry of Health, Indonesia, has approved the
experimental protocol of this research. In this experiment, we invited four healthy male participants. The participants should not have any prior injuries, especially in the elbow.
Two surface electrodes were placed at the biceps muscle and one surface electrode was placed at the other place which is not electrically related to the biceps. The subjects wore an exoskeleton which was built with aluminum frames. In this experiment, the exoskeleton was used to guide the motion of the elbow in flexion and extension. In the recording process, subjects were instructed to change the angle of the elbow in flexion and extension motions following the period of motion from the metronome program. The metronome program was set to run in 8-seconds period.
The EMG amplifier consisted of pre-amplifier, bandpass filter and summing amplifier. The EMG signal was filtered using a second-order Butterworth bandpass filter. By the EMG characteristics, the EMG signal was filtered to allow the signal for the frequency between 20 and 500 Hz. A built-in analog to digital converter (ADC) which the part of ARM STM32 microcontroller was used to record the EMG signal and the voltage output from the potentiometer sensor. The real position of the elbow joint was measured using a linear potentiometer with a sampling rate of 2,000 Hz.
During the 8-cycles of movement, the EMG and position of the elbow were recorded. For each one cycle of the movement was consisted of one flexion and one extension motions. In this study, the range of flexion and extension motion covered from 0o to 145o. The feature extraction process and the performance calculation were conducted using the MATLAB programming (Student version, Math Works, Inc., USA). The statistical analysis and the graphics plotting used Microsoft Excel (Microsoft Corporation).
B. Signal to Noise Ratio
Signal to noise ratio (SNR) represents the ratio between the power of the signal and noise. The power of the EMG and the noise were formulated using the average of the square absolute of the signal using Eq. (1) [16]. The SNR was formulated using equation (2) [16] [5].
=
=
Ni i
x
N
P
1 2
|
|
1
(1)
The robustness of the features was examined by adding an artificial white Gaussian noise (AWGN) to the original EMG signal [3] [5]. The AWGN was generated randomly with zero mean and adjusted standard deviation (SD). The SD of the AWGN was set such that the signal to noise ratio (SNR) could range from 60 to 0 dB as written as follows:
n s
P
P
dB
SNR
(
)
=
10
log
10 (2)where xi represents the EMG signal, N represents the window length of the EMG signal, Ps is the power of the EMG signal, and Pn is the power of noise.
C. Feature Extraction
features are lower than others and do not require for domain transformation. These features are Root Mean Square (RMS), Myopulse Percentage rate (MYOP), Integrated EMG (IEMG), Wilson Amplitude (WAMP), Variance of the EMG (VAR), Sign Slope Change (SSC), Mean Absolute Value (MAV), Logarithmic (LOG), Waveform Length (WL), Average Amplitude Change (AAC), Difference Absolute Standard Deviation Value (DASDV), Zero Crossing (ZC) and modified feature of myopulse with adaptive threshold (MYOPM). The feature extraction process was performed after the AWGN was superimposed to the EMG signal. In the standard MYOP feature, the threshold value is defined in the initial process using a real constant value. Nevertheless, in the modified MYOPM feature, the RMS of the EMG signal was used as a threshold value, as formulated in the equation (3). Therefore, the threshold values were changed adaptively by the RMS of the EMG signal.
RMS
C
threshold
threshold
x
if
otherwise
x
f
x
f
N
k
MYOP
N
i
i M
*
,
1
,
0
)
(
)]
(
[
1
)
(
1
=
→
≥
=
=
=
(3)
The xi is the EMG signal, N represents the window length, and C is the predefined constant that range between 0.6 and 0.8. MYOPM (k) represents the k-th features.
D. Kalman Filtering
In this paper, the Kalman filter (KF) was used to smooth the output of the features. It is assumed that the estimated state xk is written in the general equation form (4).
k k
k
Ax
w
x
=
−1+
(4) where wk denotes a random white Gaussian noise with variance σw2 = Q. In the scalar matrices, A could be a variable or constant that relates between xk and xk-1. The measurement of the process occurred at discrete points according to the following linear equation (5).k k k
k
H
x
v
z
=
+
(5) where vk indicates a measurement noise with variance σv2 =R. H is a scalar matrix that relates between zk and xk.
x
k= Ax
k-1+ Bu
k-1+ w
kP
k= AP
k-1A
T+ Q
K
k= P
kH
T(HP
kH
T+ R)
-1x
k= x
k+ K
k(z
k–
Hx
k)
P
k= (I –
K
kH)P
kGain computation
Prediction
Update estimation
Update error covariance
Initial:
x
k-1and P
k-1x
k
z
kFig. 1. The flowchart of the Kalman Filter
Because the state of the system (the estimated angle) has not changed in short time and the estimated state is a one-dimensional state, then the A and H variable can be a constant value or equal to one. The prediction and updated the estimation of the Kalman filter are implemented based on a flowchart as shown in Fig. 1 [18]. Prediction step is defined using the following equation (6) and (7):
)
1
(
)
(
=
−
−
k
x
k
x
⌢
⌢
(6)
P
−(
k
)
=
P
(
k
−
1
)
+
Q
(7)where
x
⌢
−(k
)
is the prior estimate,x
⌢
(
k
−
1
)
is the previousestimate,
P
−(k
)
is the prior error estimate,P
(
k
−
1
)
is the previous error estimate and the process noise covariance is represented by Q. Update step is formulated as follows, equation (8) to (10):1
]
)
(
)[
(
)
(
k
=
P
−k
P
−k
+
R
−K
(8))]
(
)
(
)[
(
)
(
)
(
k
x
k
K
k
z
k
x
k
x
⌢
=
⌢
−+
−
⌢
− (9)
P
(
k
)
=
P
−(
k
)[
1
−
K
(
k
)]
(10)where K(k) represents the gain of the Kalman filter and R is the measurement noise covariance. The predicted elbow joint angle is represented by equation (9) with z(k) is the EMG feature.
E. Proposed Method
In this study, the most robust feature is selected based on the immunity of the feature against the noises. In the proposed method, the finding of the most robust feature was performed by following these stages, namely: the additive noise, features extraction based on the time domain features, the Kalman filtering, and the evaluation of the performance (Fig. 2).
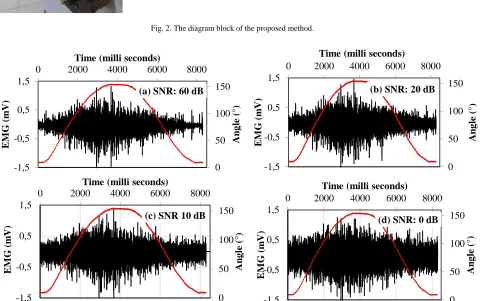
1) Additive Noise. The additive noise was the artificial white Gaussian noise (AWGN) that was generated randomly with a zero mean and various standard deviation (SD). The artificial white Gaussian noise (AWGN) was contaminated to the original EMG signal (Fig. 3). The standard deviation of the AWGN was set such that the signal to noise ratio (SNR) could range from 60 to 0 dB. Fig. 3 represents the contaminated of the EMG signal with different SNR values which are 60, 20, 10, and 0 dB.
threshold values were calculated based on the RMS of the contaminated EMG with AWGN.
3) Kalman Filter. The output of the features was filtered using the linear Kalman filter (KF) as modeled in the equation. (6) to (10). This filtering aimed to reduce the noises and to improve the performance of the predicted angle. The predicted angle [ ] was the state variable of the KF. The observation state of the KF [z(k)] was the EMG feature (EMGf) as shown in equation (9). Before the estimation was performed, some initial parameters were required to define in the KF such as Q, R, (k-1), and P(k-1).
4) Evaluating the Performance. The effectiveness of the modified feature against the AWGN was calculated using the root mean square error (RMSE). The RMSE values can represent the performance of the estimation.
5) Data Processing. In the experiment, the subject performed a flexion and extension motion which cover from 0° to 150° and return to 0°. One cycle of motion was approximately 8 seconds period. The digital signal processing was performed offline. Before performing the evaluation, some parameters are required to be defined, such as window length (N), the threshold value of the ZC, SSC, WAMP, and MYOP, Q and R-value of the Kalman filter, and RMS value of the EMG signal from previous cycle which has been contaminated by AWGN. The AWGN was generated with zero mean and various of the SD values so we can obtain the SNR value from 60 down to 0 dB using Eqs. (1) and (2). The EMG signals were read in each cycle up to the last cycle. The performance (RMSE) was calculated in each cycle for the total of eight cycles in order to observe the variation of RMSE.
12 Standard
Time Domain
Feature
Modified
Feature
Evaluation
And
Statistical
Analysis
+
+
Kalman Filter
Measured angle
White Gaussian
Noise Generator
(mean=0, SD=1-22%)Estimated angle
EMG
in
iEMG
i+ n
iEMG
f^
x
ky
kMeasured angle
Fig. 2. The diagram block of the proposed method.
Fig. 3 The Examples of the EMG signal which has been contaminated with artificial white Gaussian noise (AWGN) with different SNR. The black line indicates the EMG signal and the red line indicates the position of the elbow joint.
0 2000 4000 6000 8000
0 50 100 150
-1,5 -0,5 0,5 1,5
A
n
g
le
(
°)
Time (milli seconds)
E
M
G
(
m
V
)
(a) SNR: 60 dB
0 2000 4000 6000 8000
0 50 100 150
-1,5 -0,5 0,5 1,5
A
n
g
le
(
°)
Time (milli seconds)
E
M
G
(
m
V
) (b) SNR: 20 dB
0 2000 4000 6000 8000
0 50 100 150
-1,5 -0,5 0,5 1,5
Time (milli seconds)
A
n
g
le
(
°)
E
M
G
(
m
V
)
(c) SNR 10 dB
0 2000 4000 6000 8000
0 50 100 150
-1,5 -0,5 0,5 1,5
Time (milli seconds)
A
n
g
le
(
°)
E
M
G
(
m
V
)
6) Data Analysis. The significant difference of RMSE between the features and SNR was analyzed using ANOVA.
The alpha value of 0,05 was chosen as a confidence level for the statistical analysis.
III.RESULTS AND DISCUSSION
The artificial white Gaussian noise (AWGN) with various SNR values from 60 down to 0 dB was superimposed in the EMG signal. The RMSE values of the features were calculated in each cycle and SNR values. Fig. 4 shows the estimated angle from all features (twelve standard features and one modified feature). It was presented that the estimated angle from MYOPM features (the proposed method) indicated better performance than others. The AWGN was contaminated to the original EMG signal with a variety of SNR value. Twelve standard time domain features and one modified proposed feature were evaluated for the robustness against the AWGN. The RMSE was calculated in
each motion (flexion and extension) and in each SNR for total eight cycles of motion. In each cycle, the SNR was varied from 60 down to 0 dB. The RMSE of the twelve features decreases significantly (p<0.05), when the SNR
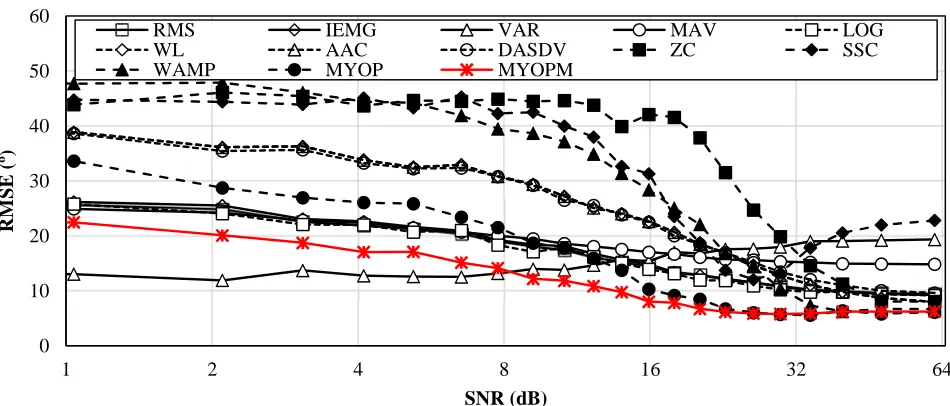
Fig. 6. The RMSE of the twelve of time domain features and one proposed feature for variety of SNR value between 60 and 0 dB.
4 14 24 34 44
R
M
S
IE
M
G
V
A
R
M
A
V
L
O
G
W
L
A
A
C
D
A
S
D
V
Z
C
S
S
C
W
A
M
P
M
Y
O
P
M
Y
O
P
M
R
M
S
E
(
º)
Fig. 4. The representation of the estimated elbow joint angle from all features with SNR of 16.2 dB.
Fig. 5. The RMSE of the three teen time domain features for variety of SNR value between 60 and 0 dB (SNR in Logarithmic scale, and MYOPM is the modified feature).
0 20 40 60 80 100 120 140 160 180 200
0 1 2 3 4 5 6 7 8 9 10 11 12 13 14 15 16 17
A
n
g
le
(
°
)
Time (seconds)
Angle RMS IEMG VAR MAV LOG WL AAC DASDV ZC SSC WAMP MYOP MYOPM
0 10 20 30 40 50 60
1 2 4 8 16 32 64
R
M
S
E
(
º)
SNR (dB)
RMS IEMG VAR MAV LOG
WL AAC DASDV ZC SSC
increase, except for VAR feature (Fig. 5). The RMSE of the feature SSC decreases for SNR 0 up to 25 dB, but after more than 25 dB, the RMSE increases significantly. The VAR feature is the most robust feature but only for the SNR range between 0 and 7 dB. The proposed modified feature (MYOPM) is more robust for a wide range of SNR than the original feature (MYOP) (p<0.05). The use of the adaptive threshold in the MYOPM feature is effective to increase the robustness of the feature. Fig. 6 shows that the proposed feature (MYOPM) has the lowest median of RMSE (RMSE=9º). The features of RMS, IEMG, VAR, MAV, LOG, and MYOP have almost the same mean of RMSE (RMSE=13.2º). The features of ZC, SSC and WAMP have the widest variance of the RMSE and followed by the features of WL, AAC, DASDV, and MYOP. The feature of VAR has the narrowest variance of RMSE (minimum of 21.69º and maximum of 28.37º).
The performance and robustness of the twelve standards and one modified time domain features were evaluated in this study. The results show that the modified feature (MYOPM) is the most accurate and robust feature to estimate the position of the elbow for SNR 7 to 60 dB. The MYOPM features improve the performance of the estimation by 27.91% from the original feature (MYOP) (p-value=0.056). Zardoshti-Kermani et al. evaluated the robustness of the features for the movement control of myoelectric prostheses by adding a WGN to the original EMG [8]. The similar result showed that the VAR feature, which was not the most robust feature, had the most stable error under noisy condition (WGN) and almost all of the features degraded rapidly with the increasing SNR. Oskoei reported a similar result that the ZC feature had the lowest performance in classification scheme after AR2 and AR6 (autoregressive order two and six respectively) and also ZC had a wide variation of the performance [11]. The robustness of the features plotted in Fig. 4 shows that the VAR and MYOPM features have the lowest RMSE for a different range of SNR (VAR: 0 to 7.77 dB and MYOPM: 7.78 to 60 dB). In order to reduce the error in the estimation, the VAR and MYOPM features can be combined. Thus, the feature can be selected based on the level of the noise. In the next work, a parameter that affects the features such as muscle fatigue needs to be considered to enhance the robustness of the feature in predicting the position of the elbow joint.
IV.CONCLUSION
In this study, in the estimation process, the robustness of the features against the white Gaussian noise was proposed and evaluated. While the elbow performs a flexion and extension motion, the EMG signal was recorded. The linear Kalman filter is used to improve the predicted angle which is yielded from the features extraction process. From the evaluation, the modified feature (MYOPM) has the lowest RMSE because the threshold is adjusted adaptively following the RMS value. The main contribution of this work is that the modified feature can adapt to the variety of SNR values in the elbow joint angle estimation. In the related work, this proposed method can be implemented on the exoskeleton based on electromyography control as an assistive or rehabilitative device that robust against white Gaussian noise.
REFERENCES
[1] H. Lee, W. Kim, J. Han, and C. Han, “The technical trend of the exoskeleton robot system for human power assistance,” International Journal of Precision Engineering and Manufacturing, vol. 13, no. 8. pp. 1491–1497, 2012.
[2] S. Thongpanja, A. Phinyomark, F. Quaine, Y. Laurillau, C. Limsakul, and P. Phukpattaranont, “Probability Density Functions of Stationary Surface EMG Signals in Noisy Environments,” IEEE Trans. Instrum. Meas., vol. 65, no. 7, pp. 1547–1557, Jul. 2016.
[3] P. McCool, G. D. Fraser, A. D. C. Chan, L. Petropoulakis, and J. J. Soraghan, “Identification of contaminant type in surface electromyography (EMG) signals,” IEEE Trans. Neural Syst. Rehabil. Eng., vol. 22, no. 4, pp. 774–783, 2014.
[4] R. H. Chowdhury, M. B. I. Reaz, M. A. B. M. Ali, A. a a Bakar, K. Chellappan, and T. G. Chang, “Surface electromyography signal processing and classification techniques.,” Sensors (Basel)., vol. 13, no. 9, pp. 12431–12466, 2013.
[5] L. Smital, M. Vítek, J. Kozumplík, and I. Provazník, “Adaptive wavelet wiener filtering of ECG signals,” IEEE Trans. Biomed. Eng., vol. 60, no. 2, pp. 437–445, 2013.
[6] [6] S. Thongpanja, A. Phinyomark, C. Limsakul, and P. Phukpattaranont, “A robust measure of probability density function of various noises in electromyography (EMG) signal acquisition,” 2015 7th Int. Conf. Knowl. Smart Technol., no. January 2015, pp. 1– 6, 2015.
[7] A. Phinyomark, C. Limsakul, and P. Phukpattaranont, “A Novel Feature Extraction for Robust EMG Pattern Recognition,” J. Comput., vol. 1, no. 1, pp. 71–80, 2009.
[8] M. Zardoshti-Kermani, B. C. Wheeler, K. Badie, and R. M. Hashemi, “EMG feature evaluation for movement control of upper extremity prostheses,” IEEE Trans. Rehabil. Eng., vol. 3, no. 4, pp. 324–333, 1995.
[9] G. Guo, M. Mandal, and Y. Jing, “A robust detector of known signal in non-Gaussian noise using threshold systems,” Signal Processing, vol. 92, no. 11, pp. 2676–2688, 2012.
[10] M. Asghari Oskoei and H. Hu, “Myoelectric control systems-A survey,” Biomed. Signal Process. Control, vol. 2, no. 4, pp. 275–294, 2007.
[11] M. a. Oskoei and H. H. H. Hu, “Support Vector Machine-Based Classification Scheme for Myoelectric Control Applied to Upper Limb,” IEEE Trans. Biomed. Eng., vol. 55, no. 8, pp. 1956–1965, 2008.
[12] D. Tkach, H. Huang, and T. A. Kuiken, “Study of stability of time-domain features for electromyographic pattern recognition,” J. Neuroeng. Rehabil., vol. 7, no. 1, p. 21, 2010.
[13] Z. Li, B. Wang, F. Sun, C. Yang, Q. Xie, and W. Zhang, “SEMG-based joint force control for an upper-limb power-assist exoskeleton robot,” IEEE J. Biomed. Heal. Informatics, vol. 18, no. 3, pp. 1043– 1050, 2014.
[14] Q. Ding, X. Zhao, A. Xiong, and J. Han, “A Novel Motion Estimate Method of Human Joint with EMG-Driven Model,” in 2011 5th International Conference on Bioinformatics and Biomedical Engineering, 2011, no. 1, pp. 1–5.
[15] Triwiyanto, O. Wahyunggoro, H. A. Nugroho, and Herianto, “An investigation into time domain features of surface electromyography to estimate the elbow joint angle,” Adv. Electr. Electron. Eng., vol. 15, no. 3, 2017.
[16] Li Tan & Jean Jiang, Digital Signal Processing: Fundamental and Applications, 1st ed., vol. 70, no. 3. California: Elsevier, 2008. [17] A. Phinyomark, P. Phukpattaranont, and C. Limsakul, “Feature
reduction and selection for EMG signal classification,” Expert Syst. Appl., vol. 39, no. 8, pp. 7420–7431, 2012.
[18] Mohinder S. Grewal; Angus P. A, Kalman Filtering Theory and Practice Using MATLAB, Third., vol. 53, no. 9. Canada, 2008. [19] Triwiyanto, O. Wahyunggoro, H. A. Nugroho, and Herianto, “Effect
of window length on performance of the elbow-joint angle prediction based on electromyography,” J. Phys. Conf. Ser., vol. 853, p. 12014, May 2017.
[20] T. Triwiyanto, O. Wahyunggoro, H. A. Nugroho, and H. Herianto, “Evaluating the performance of Kalman filter on elbow joint angle prediction based on electromyography,” Int. J. Precis. Eng. Manuf., vol. 18, no. 12, pp. 1739–1748, Dec. 2017.