Vol.8 (2018) No. 6
ISSN: 2088-5334
Online Reputation Model Using Multiple Quality Factors
Mohammad Azzeh
#, Mohammad Hijjawi
*1, Ahmad M. Altamimi
*2#
Department of Software Engineering, Applied Science Private University, Alarab street, Amman, Jordan E-mail: [email protected]
*
Department of Computer Science, Applied Science Private University, Alarab street, Amman, Jordan E-mail: [email protected]; [email protected]
Abstract— Users on the internet are looking for ways to minimize their experiences in performing online transactions. Reputation systems as a decision support tool are trying to facilitate online transactions. However, many reputation systems use Naïve methods to compute the reputation of an item. These methods are unstable when there is sparsity in the ratings. Also, they cannot discover trends emerging from recent ratings. Other methods, which use weighted average or probabilistic model, usually focus on one aspect of the reviewer ratings. Even though models that combine multiple factors often accomplish that through an arbitrary set of weights. This research study looks at various aspects of reviewers’ ratings and proposes a new reputation model that attempts to assess the reviewer reputation by combining four factors through a Fuzzy model. These weights are then involved in computing the item reputation. The proposed reputation model has been validated against state-of-art reputation models and presented significant accuracy regarding Mean Absolute Errors (MAE) and Kendall correlation. The proposed reputation model also works well with the sparse and dense dataset.
Keywords— online rating system; reputation model; rating systems; Fuzzy model; aggregation methods.
I. INTRODUCTION
The massive amount of online transactions is taken place daily on the internet [1]. Many of them are influenced by the opinions and feedback provided by other people. The feedback can be found in two forms: ratings and reviews, which are considered the main sources of item quality information [2], [3]. The quality of the item is usually assessed through a reputation system that is used to process ratings. A crucial part of that system is the rating aggregation method. The outcome of the reputation system is the item quality represented as numeric value or stars in some systems [2], [4].
Using reputation systems is increasingly observed because they are free, widely available, easy to reach, and can facilitate user decision [5]–[7]. However, the accuracy of reputation systems has always been a concern for many users because it reflects global opinion about an item. The primary concern in reputation systems is how to aggregate item ratings in order to reflect the quality of items. The fundamental approach is to use Naïve methods to obtain a reputation score [8]. These methods are rather simple, but they are not efficient because they do not consider the reliability and quality of reviewers or even the popularity of an item. It also cannot discover a trend emerging from recent
reviewer ratings [1]. Other methods attempt to use more sophisticated approaches such as probabilistic models and Fuzzy logic [9], [10]. These approaches presented good accuracy, but they depend heavily on threshold points specified by experts. On the other hand, many reputation models use the weighted average to compute the item reputation score, where the weights may be the reviewers’ reputation, reliability [11], leniency of reviewer [12], time of rating [Abdel-Hafez, 2015b], or difference between new rating and current item score [13]. This approach desperately needs evaluating rating quality of reviewer to calculate reviewer weight that will be used during aggregation process based on weighted mean method.
negative ratings of a reviewer). Therefore, this paper presents a new reputation model that can assess the reviewer’s reputation by four factors that are combined using a Mamdani Fuzzy model. These factors have been chosen carefully to reflect the reviewer’s reputation as weight. These factors are 1) average time fluctuation, 2) reviewer reliability, 3) reviewer behavior or tendency and 4) reviewer experience. More detailed about these factors can be found in section II.b.
The primary symbols that are used throughout this paper are:
• = , , , … , is the set of all reviewers who rated at least one item.
• = , , , … , is the set of all items that have been rated by at least one reviewer.
• k is the maximum rating level.
• R is a reviewer rating matrix defined as mapping
= × → 0, . If reviewer has rated the item then , = such that 1 < ≤ , otherwise , = 0.
• ! ! is the number of reviewers who rated item j.
• | | is nua mber of items reviewed by a reviewer i.
• $$$$$$$# is the mean of ratings for itethe m . • $ is the mean of all ratings in the dataset.
In literature, many reputation models have been investigated [16], [17], some of these models are being used by popular online applications such as eBay, Amazon, IMDb…etc. However, no agreed method can effectively aggregate the reputation score in a way that reflects the accurate item quality. The most common approach is to use Naïve methods as shown in Equation 1. Garcin et al. [8] examined the common rating aggregation methods such as mean, median and mode, and concluded that the median is the accurate and consistent one. Other authors reported that the Naïve methods are biased, easily influenced by unfair ratings, and cannot discover hidden trends in the recent ratings [1], [14]. IMDb proposed a model that uses true Bayesian estimation as shown in Equation 2, where MinR is the minimum number of rating count required to appear on the top 250.
%& = 1
! !' ,
!()!
* (1)
+,-. = ! ! + , 0! ! ×$$$$$$$ +# ! ! + , 0, 0 × $ (2)
In literature, the reputation models are divided into three main categories: probabilistic models, weighted average models, Fuzzy models. Amongst them, the weighted average method has been extensively studied and examined. The weights in this approach are usually computed based on analyzing past ratings. Josang and Haller [18] used a nonlinear aging function which gives low weights for old ratings and high weights for recent ratings. This approach did not specify exactly which best time unit should be involved in computing the weights. Moreover, the number of past transactions has also been used as weight [7].
Interestingly, none of the above approaches provide stable results when the dataset grows. On the other hand, Leberknight et al. [1] studied the volatility in user rating and reflect that on the user rating. Their model assigns less weight for old rating than current ones. However, this mode does not account for the reviewer’s trustworthiness and his credibility in providing accurate ratings.
Other models use reviewer data such as reliability, credibility, and trustworthiness to compute weights [15]. Riggs et al. [13] used the reviewer’s reliability as a measure of weight, where high weights are offered to the reviewer with accurate ratin that are very close to the average of items scores. Lauw et al. [12] proposed a model that can compute the leniency of the reviewer based on his rating tendency as shown in Equations 3 and 4. The model used leniency variable 1 to divide the reviewers into two groups (strict and lenient) where 1 > 0 indicates that the reviewer is lenient.
1 =| | ' 31 , − 5 , 6
|78|
* (3)
5 = 1
! !' , × 91 − : ∙ 1 <
!()!
* (4)
Where 5 is the initial score and usually begins with average of ratings. : ∈ 0, 1 is a compensation factor specified by expert.
Abdel-Hafez et al. [2] proposed two different reputation models using Normal and Beta distribution function to treat sparse ratings. They assumed that the level with large rating count should receive the high weight. Furthermore, using Beta distribution has the flexibility to change the shape of distribution according to : and > parameters, which are calculated based on methe an and standard distribution of ratings. In order to successfully use their method, it is important to sort the rating ascendingly, then apply Beta distribution function to obtain the weights as shown in Equation 5. Equation 6 is used to evenly divide the space of ratings into | | indexes which can be used in Equation 5 to compute Beta weight. Equation 7 is used to calculate item reputation score.
? @A9B < =Γ9:<Γ9>< BΓ9: + >< DE 91 − B <FE
(5)
B =0.98 ×| | − 1 + 0.01 (6)
? @A- = ' 91 × JK< L
K* (7)
MN
OOOO⃑: RMN9 < = N
9 < + S × 1
S + ∑L* N9U<; | = 1 … W
(8)
%& = ' X9 <M9 <; JℎL : X9 < = − 1− 1
*
(9)
where MOOOO⃑N is the score vector of a rating level, MN9 < is the probability that one agent gives rating i to agent y. N9 < is the number of ratings of the level i.
Bharadwaj et al. [11] used the ordered weighted averaging method as shown in Equations 10 to 12. Liu et al. [14] used the Fuzzy logic model to treat unfair testimonies. They used several measurements by combining Fuzzy logic to identify the unfair rating. The output of Fuzzy model is used as discounting weight. The main concern in this method is that the rating’s weight is high in most cases especially when the most recent rating has received and the similarity between reviewers and users is also high [2].
%& = ' Z ×!()! ,
*
(10)
Z = [ \0] − [\ − 10 ] (11)
[9 < = ^2 × − 0.6 0.3 < ≤ 0.8 0 0 ≤ ≤ 0.3
1 0.8 < ≤ 1 (12)
To the best of our knowledge, none of the current methods addressed the reviewer reputation by combining our four proposed factors through the Fuzzy model. Also, there is no model can work the overall type of datasets (i.e., sparse or dense) accurately.
The remaining of the paper is structured as follows: Section two describes the Material and methods used in the study including our proposed model and research methodology. Section three presents the results, and finally, Section four ends with a conclusion.
II. MATERIAL AND METHOD
A. Fuzzy Logic Model
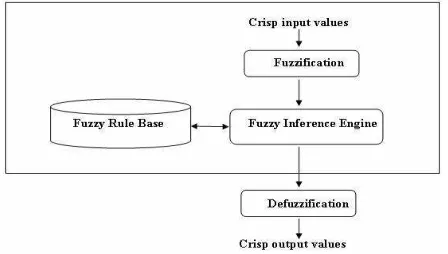
Fuzzy Logic Model is a rule-based method that can treat uncertain and imprecise problems. Figure 1 describes the basic representation of Fuzzy Logic Model. The Model consists of four main components. The first component is the Fuzzifier which takes input data as crisp real value and maps them to Fuzzy sets with membership values. Each input variable has a universe of discourse which is divided into some Fuzzy sets represented by Fuzzy membership functions. Each Fuzzy set is a representation of linguistic term, for example, suppose we have a variable called temperature, and this variable is represented by three linguistic terms (low, medium and high), so each scientific term is expressed as a fuzzy set with proper fuzzy membership function. The second part is the Fuzzy rule base which stores all rules that are usually implemented by experts. The rules are usually written using if-then syntax. The key component of the Fuzzy Logic system is the Fuzzy
Inference System that can translate input space into output space using Fuzzy rules. The last part is the defuzzification function that translates the output membership values into quantifiable value.
Fig 1. Fuzzy Logic Model
B. The Proposed Model
The proposed model is a weighted average method where weights are calculated through Fuzzy Logic Model. Mainly, we proposed four new factors that measure and reflect the reviewer’s reputation. These factors are fused through Mamdani Fuzzy Logic Model whose output is used as a reviewer discounting weight. Using Fuzzy Logic has the advantage of minimizing human decisions and avoiding crisp pre-set thresholds that are used to calculate the discounting weights.
The first factor is the fluctuation in rating timestamp. It is important to study when the reviewer frequently made his/her ratings and if previous ratings of such items might influence he/she. It is very common in online transactions that existing ratings influence reviewers, and they frequently provide rating very close to the average of current ratings. However, in case that he was the first reviewer who rated the item, his/her rating might be more reasonable and reflects the quality of the item. Therefore, for each item assessed by a reviewer, we compute the distance between the most recent timestamp of his rating and the timestamp of the first rating received. If he/she were the first reviewer for that item, then he would receive the high weight.
In contrast, if he/she rates an item with many past ratings, then the weight value is discounted based on the distance between the two timestamps. Finally, we calculate the average for all discounting values across all items as shown in Equation 13. The λ is the fading variable that is used as a
discounting factor. In our case we used λ=0.95.
b =| | ' c1 |78| de)Edf) (13)
where @g is the time when item j has been rated by revthe iewer . @ is the time of the first ratings of item j. Both timestamp parameters are measured in weeks.
close to the average rating of the item under assessment. For each item assessed by a reviewer, the distance between reviewer rating and an average of item ratings is calculated as shown in Equation 15. All distance values are then used with discounting function c to compute rthe eliability of rthe eviewer as shown in Equation 14. In this equation, if all distance values are very close to zero ,t hen the reviewer would receive a value very close to one.
b =| | ' c1 |78| h8) (14)
i = j , −$$$$$$$j# (15)
The third proposed factor is to assess the reviewer’s behavior (or tendency) in providing positive and negative ratings. Some reviewers are strict in providing their ratings, so they usually provide negative ratings irrespective of the item quality. In contrast, other reviewers tend to be lenient and usually provide positive ratings. To reflect that tendency on the reviewer’s reputation, we first classify the ratings of the reviewer into three classes: positive, neutral and negative. Positive ratings are those with the values 4 and 5 in the rating level, neutral is a set of ratings that have a value of 3, and Negative ratings are those with the values 1 and 2. To compute this factor, in the first step we classify reviewer’s items into three groups based on dividing mentioned above criteria. In the second step, we find the ratio between the sum of residuals within the target class and the sum of residuals within the reviewer’s rating as shown in Equation 16. The target class is determined based on the rating of the item under assessment; for example, if the rating given by a reviewer for the item under assessment is 5, then we compute Equation 16 for the positive class only.
b = 1 −∑ ! 9 ,kL* L< − 9$$$$$$$$!L< ∑|7*8|j , −$$$$$$$j#
(16)
Where L is the number of ratings in the target class.
The fourth factor is to assess the reviewer’s experience in providing an accurate rating. The reviewer’s experience is significant in determining the reviewer’s confidence and his ability to provide true ratings. This factor can be assessed by finding the ratio between the number of ratings provided by the reviewer and maximum reviewer ratings in the dataset, as shown in Equation 17.
bl=mAB | |, | |, | |, … , | || | (17)
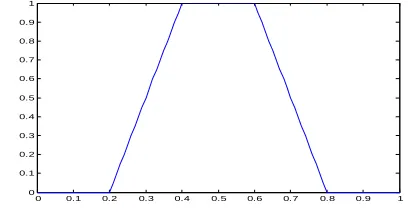
The four factors are fused using Mamdani Fuzzy Logic model. The outcome is the reviewer reputation as weight value between 0 and 1. Each input factor was denoted by three Fuzzy sets (Low, Medium and High). Whereas, five fuzzy sets denote the output variable (Very Low, Low, Medium, High and Very High) to give more flexibility in computing the weight. Each Fuzzy set is represented by a trapezoidal membership function as shown in Figure 2. Equation 18 defines Fuzzy trapezoidal membership function.
n9B; A, ., %, o< = mAB \m 0 \B − A. − A , 1,o − Bo − %] , 0] (18) Where a, b, c, and d are Fuzzy trapezoidal membership function parameters. X is a numeric value.
Fig. 2 Symmetric Trapezoidal Membership Function
The universe of discourse of each variable was partitioned equally among all fuzzy sets. Eighty-One Fuzzy rules were carefully constructed to map input space to output space. The full list of the constructed Fuzzy rules is presented in Appendix A.
C. Rating Prediction Procedure
In the previous section, we demonstrate how the prosed factors are computed and fused to produce reviewer weight. However, in this section, we illustrate the rating prediction procedure. Given an item 9 < from the items repository E we extract set of reviewers who rated this item. Then, for each reviewer 9 < we compute the four factors b , b , b and bl. These factors are entered into the Fuzzy Logic Model that is supposed to be constructed as explained in sections 4 and 5. The input of Fuzzy model should be in the following format: 〈b b b bl〉. The outcome of the Fuzzy Model (i.e. reviewer weight J, ) is calculated through the defuzzification process. The final item score is computed as shown in Equation 19.
%& = 'J × , ∑ J!()!
* !()!
*
(19)
D. Datasets
To validate the proposed reputation model, we used common stable benchmark datasets called MovieLens [20]. This repository contains several benchmark datasets with a different number of anonymous ratings. For the objective of this research, we used two stable versions of the MovieLens datasets (100K and 1M) to validate the accuracy of the proposed model in the absence and presence of sparse or dense data [20]. Also, we extracted three new datasets from the 1M dataset for the goal of examining the efficiency of our model over the different level of sparsity. The extracted datasets contain four, six and eight reviewer ratings selected randomly from reviewers’ ratings to that item. The new datasets are called 1M4, 1M6 and 1M8 respectively. The complete description of these datasets is presented in Table 1.
0 0.1 0.2 0.3 0.4 0.5 0.6 0.7 0.8 0.9 1 0
TABLEI DATASETS CHARACTERISTICS
Dataset #Reviewers #Items #ratings
100K 943 1682 100.000
1 M 6040 3706 1.000.209
1 M4 6040 920 24.160
1 M6 6040 1286 36.240
1 M8 6040 1625 48.320
E. Evaluation Measures
It is widely acknowledged that there are no agreed evaluation measures among researchers for appraising reputation models. To avoid this pitfall, we used some proposed measures that were commonly used in many previous studies [2], [11]. The first measure is the Mean Absolute Errors (MAE) which evaluates, the closeness of the predicted score to the actual ratings for an item. To compute MAE, we measure, for all test cases, the difference between predicted item ratings and actual ratings as shown in Equation 20. This measure is considered unbiased and can give us true picture about the performance of any reputation models. The model that resulted with minimum MAE is considered the superior one.
,r =m '1 ∑s* ,ℎ − %&
*
(20)
Where %& is the predicted rating. m is the number of items in the testing data. h is tHe number of ratings for jth itthe em in the testing data.
The second evaluation measure is Kendall Tau coefficient which measures association and its significance between two ranked lists. Kendall Tau coefficient takes values between -1 (perfect strong agreement) and +1 (perfect strong disagreement). The purpose of using this measure is to ensure that the ranking order of top items in our models and another model are entirely different. If both ranking lists are different, then two models produced different items scores and confirmed that our model is significant. Otherwise, two models can generate similar items scores. Therefore there is no novelty in our work.
III.RESULTS AND DISCUSSION
This section presents the results of validation and comparison with state-of-art reputation models. Specifically, we compare our model to seven reputation models: Average, BetaDR [2], Bayesian [19], Dirichlet [18], IMDb, Fuzzy rating [11] and LQ [12]. 10-Fold cross-validation has been used as a validation procedure where the original dataset is divided into ten subsets of training and testing observations. In each validation run, the training reputation model is constructed from 90% of the reviewers’ data and validated over testing data that forms 10% of original data. In each iteration, we compute Mean Absolute Error for test ratings. This procedure is repeated ten times to ensure that all observations have been used as testing. The first part of validation includes computing of MAE for each reputation model overall employed datasets. Tables 2 shows the obtained MAE results over sparse and dense datasets.
We can observe that our model presents better accuracy in comparison with other models. Correctly, we can conclude that the proposed model works well over sparse and dense dataset as confirmed by the results. However, our model has been outperformed by the Dirichlet model over one sparse dataset 1M6, but the difference is not that significant. This is because the Dirichlet method can treat uncertainty problem that is inherited from sparse datasets. In general, our model and Dirichlet model are relatively close over sparse datasets, and this confirms the ability of our mode to handle the uncertainty in the sparse datasets. The significant improvement of our model is observed especially over dense datasets (100K and 1M).
Nevertheless, we can notice that both IMDb and our model produce accurate results over large dense datasets. This confirms the superiority of our model on dense datasets. Our model keeps the advantage of both dealing with few ratings and dense ratings. Finally, the LQ results Are relatively the worst results over sparse and dense datasets without any enhancements over Naïve method (arithmetic mean).
The second part of validation is to use Kendall tau coefficient to measure the degree of similarity or association between the items ranking produced by our model and the ranking of the items produced by each one of the comparative models. The objective of this evaluation is to show that our model ranks top items substantially different from other reputation models.
TABLEII
EVALUATION RESULTS USING MEAN ABSOLUTE ERROR RESULTS
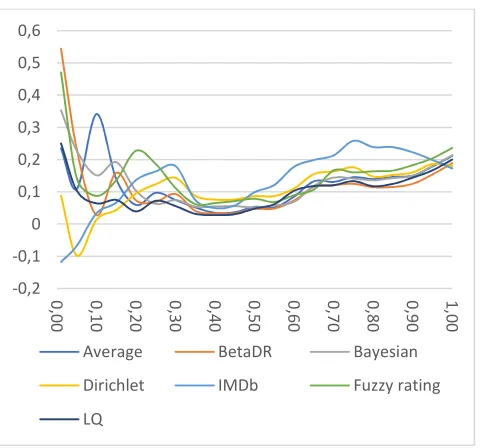
state which is very close to zero. For dense datasets (i.e., K100 and M1) we can notice that our model produces quite similar top item list to BetaDR when we look at the top 1% and 5% of the items. For K100 dataset as shown in Figure 3, it is noticed that our model ranks 1% and 5% of top item quite similarly to Bayesian and Fuzzy rating models. However, the similarity degree began to decline after using top 10%.
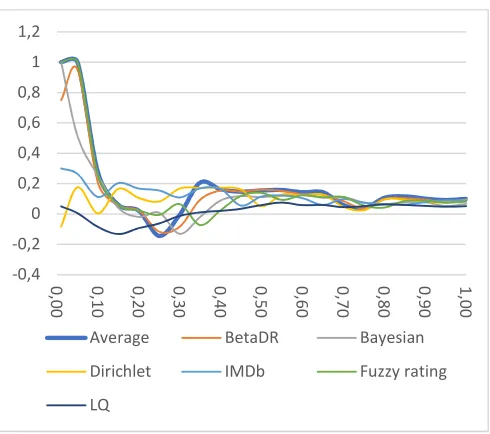
In contrast, our model ranks the list of top items differently from other reputation models. Likewise, we can see the same trend over M1 as shown in Figure 4, but with one exception for BetaDR which ranks top items differently from our models at various percentages of top items. Notably, our model and both the Dirichlet model and average rank top items differently, which indicates that our model is more accurate as confirmed by MAE. For sparse datasets, we notice that our model and both Bayesian and Fuzzy ratings rank only top 1% and 5% items similarly, but they decline after using 10%, which confirms that ranking lists are independent of each other. For other comparisons over sparse datasets, we can notice that our model ranks top items differently from other reputation models as shown in Figures 5, 6 and 7. In summary, we can figure out that the ranking order of the top 10% of item list generated by our model is relatively different from other reputation models, either over sparse or dense datasets.
Fig. 3 Kendall tau coefficient comparisons over K100 dataset
Fig. 4 Kendall tau coefficient comparisons over M1 dataset
Fig. 5 Kendall tau coefficient comparisons over the 1M4 dataset
Fig. 6 Kendall tau coefficient comparisons over 1M6 dataset
-0,2 -0,1 0 0,1 0,2 0,3 0,4 0,5 0,6
0,
00 0,10 0,20 0,30 0,40 500, 0,60 0,70 0,80 0,90 1,00
Average BetaDR Bayesian
Dirichlet IMDb Fuzzy rating
LQ
-0,1 0 0,1 0,2 0,3 0,4
0,
00 0,10 0,20 0,30 0,40 500, 0,60 0,70 0,80 0,90 1,00
Average BetaDR Bayesian
Dirichlet IMDb Fuzzy rating
LQ
-0,4 -0,2 0 0,2 0,4 0,6 0,8 1 1,2
0,
00 0,10 0,20 0,30 0,40 500, 0,60 0,70 0,80 0,90 1,00
Average BetaDR Bayesian
Dirichlet IMDb Fuzzy rating
LQ
-0,2 0 0,2 0,4 0,6 0,8 1 1,2
0,
00 0,10 0,20 0,30 0,40 500, 0,60 0,70 0,80 0,90 1,00
Average BetaDR Bayesian
Dirichlet IMDb Fuzzy rating
Fig. 7 Kendall tau coefficient comparisons over the 1M8 dataset
IV.CONCLUSION
It is widely acknowledged that malicious and unfair ratings easily influence rating aggregation process so the reviewer reputation should be involved in this task. This paper introduces a new reputation model that uses four new factors fused through a Fuzzy Logic Model to compute the reviewer’s reputation. This value is then used as a weight in computing the item quality. Each factor measures one aspect of reviewer reputation, which enables us to assess his/her ratings and their influence on item quality. The proposed model solved some limitations in previous models and showed good accuracy regarding MAE. The proposed model provides great enhancement for the accuracy of rating aggregation process over sparse and dense datasets. The comparisons between our model and other legacy reputation modes using Kendall tau coefficient showed that, in most cases, our model ranks the top items differently from other reputation models which indicates the significant improvements of our model. There are some exceptions especially over sparse dataset because our model and both Fuzzy rating model and Bayesian model are relatively quite similar at the top 1% and 5% only. In summary, our model and other models are significantly different at greater than or equal to the top 10% of the item list.
ACKNOWLEDGMENT
The authors are grateful to the Applied Science Private University, Amman, Jordan, for the financial support granted to cover the publication fee of this research article.
REFERENCES
[1] Leberknight, C. S., Sen, S., Chiang, M. On the Volatility of Online Ratings: An Empirical Study E-Life: Web-Enabled Convergence of Commerce, Work, and Social Life 2012, Vol. 108, pp. 77-86. [2] Abdel-Hafez, A., Xu, Y. Exploiting the beta distribution-based
reputation model in a recommender system. Paper presented at the 28th Australasian Joint Conference on Artificial Intelligence, 2015, pp. 1-13.
[3] Ayday, E., Lee, H., Fekri, F. An iterative algorithm for trust and reputation management. In IEEE International Symposium on Information Theory (ISIT), 2009, 2051-2055.
[4] Abdel-Hafez, A., Xu, Y., Jøsang, A. A normal-distribution based rating aggregation method for generating product reputations. In Web Intelligence, 2015, 13(1), pp. 43-51.
[5] Jøsang, A., Ismail, R., & Boyd, C. A survey of trust and reputation systems for online service provision. Decision Support Systems, 2007, 43(2), 618-644.
[6] Bedi, P., Sharma, R. Trust based recommender system using ant colony for trust computation. Expert Systems with Applications, 2012, 39(1), 1183-1190.
[7] Malik, Z., Bouguettaya, A. Rateweb: Reputation assessment for trust establishment among web services. The International Journal on Very Large Data Bases, 2009, 18(4), 885-911.
[8] Garcin, F., Faltings, B., Jurca, R. Aggregating reputation feedback. In Proceedings of the 1st International Conference on Reputation: Theory and Technology, 2009, 62-67.
[9] Aringhieri, R., Damiani, E., Vimercati, D., De Capitani, S., Paraboschi, S., Samarati, P. Fuzzy techniques for trust and reputation management in anonymous peer-to-peer systems. Journal of the American Society for Information Science and Technology, 2006, 57(4), 528-537.
[10] Tajeddine, A., Kayssi, A., Chehab, A., Artail, H. Fuzzy reputation-based trust model. Applied Soft Computing, 11(1), 345-355, 2011. [11] Bharadwaj, K. K., Al-Shamri, M. Y. H. Fuzzy computational models
for trust and reputation systems. Electronic Commerce Research and Applications, 2009, 8(1), 37-47.
[12] Lauw, H. W., Lim, E.-P., Wang, K. Quality and Leniency in Online Collaborative Rating Systems. ACM Transactions on the Web (TWEB), 2012, 6(1).
[13] Riggs, T., Wilensky, R. An algorithm for automated rating of reviewers. In Proceedings of the 1st ACM/IEEE-CS Joint Conference on Digital Libraries, Roanoke, Virginia, USA, 2001, 381-387, ACM. [14] Liu, S., Yu, H., Miao, C., Kot, A. C. A fuzzy logic based reputation
model against unfair ratings. In Proceedings of the 2013 International Conference on Autonomous Agents and Multi-Agent Systems, 2013, 821-828,
[15] Cho, J., Kwiseok K., and Yongtae P.. "Q-rater: A collaborative reputation system based on source credibility theory." Expert Systems with Applications,2009, 36(2), 3751-3760.
[16] Hermoso, R., Roberto, C., Maria ,F. From blurry numbers to clear preferences: A mechanism to extract reputation in social networks. Expert Systems with Applications, 2014, 41(5): 2269-2285. [17] Chiu, D. K. W., Ho-Fung, L., and Ka-Man, L. On the making of
service recommendations: An action theory based on utility, reputation, and risk attitude. Expert Systems with Applications, 2009, 36(2): 3293-3301.
[18] Jøsang, A., Haller, J. Dirichlet reputation systems. In The 2nd International Conference on Availability, Reliability and Security (ARES), 2007, 112-119.
[19] Jøsang, A., Ismail, R. The beta reputation system. In Proceedings of the 15th Bled Electronic Commerce Conference, 2002, 41-55. [20] Maxwell H. F., Joseph A. Konstan. The MovieLens Datasets: History
and Context. ACM Transactions on Interactive Intelligent Systems 2015, 5, 4, Article 19.
-0,4 -0,2 0 0,2 0,4 0,6 0,8 1 1,2
0,
00 0,10 0,20 0,30 0,40 500, 0,60 0,70 0,80 0,90 1,00
Average BetaDR Bayesian
Dirichlet IMDb Fuzzy rating