www.fm.viamedica.pl
Address for correspondence: J. Hreczecha, Department of Clinical Anatomy, Medical University of Gdańsk, Dębinki 1, 80–211 Gdańsk, Poland, tel./fax: +48 58 349 14 20, e-mail: [email protected]
Basic axes of human heart in correlation with
heart mass and right ventricular wall thickness
M. Skwarek
1, M. Grzybiak
2, A. Kosiński
2, J. Hreczecha
21Department of Sports Medicine and Hygiene, the Jędrzej Śniadecki Academy of Physical Education and Sport, Gdańsk, Poland
2Department of Clinical Anatomy, Medical University, Gdańsk, Poland
[Received 12 May 2006; Accepted 21 June 2006]
A comparison of the data published in anatomy textbooks and anthropological tables does not reveal any change in basic heart dimensions during the period since the beginning of the 20th century to nowadays. However, normal values of many other parameters have changed up to 30% over the same period. These changes may be caused by the acceleration phenomenon or the extension of average lifespan. The progress of laboratory medicine methodology permitted the introduction of new biochemical tests in myocardial infarct diagnosis, such as myoglobin and troponins T and I measurement, as well as better understanding of cardiac me-tabolism. Parameters describing the direction and intensity of metabolic chang-es are substrate extraction and metabolic equilibrium. The exprchang-ession dchang-escribing metabolic equilibrium contains heart mass value. Therefore, as studying heart mass in vivo is not possible, it may be important to study it in vitro.
The study was performed on a group of 107 formalin-fixed human hearts. The organs came from adults of both sexes: 30 women and 77 men, aged 18 to 90 years. None of the hearts carried signs of macroscopic developmental abnor-malities or pathologic changes.
Key words: human heart, right ventricle, morphometry, basic axes
INTRODUCTION
A comparison of the data published in anatomy textbooks and anthropological tables does not re-veal any change in basic heart dimensions during the period since the beginning of the 20th
century to nowadays. However, normal values of many other parameters have changed up to 30% over this peri-od [2, 18]. These changes may be caused by the ac-celeration phenomenon or the extension of average lifespan.
During autopsy, many hearts without macro-scopic developmental abnormalities or pathologi-cal changes weight more than 300 g. Hearts with a mass lower than 300 g are rare in cadavers of elderly people.
Rapid diagnosis and immediate therapy is a ba-sic condition for success of myocardial infarct
treat-ment. The progress of methodology in laboratory medicine permitted the introduction of new bio-chemical tests in myocardial infarct diagnosis, such as myoglobin or troponins T and I level measure-ment, as well as a better understanding of cardiac metabolism. Parameters describing the direction and intensity of metabolic changes are substrate extraction and metabolic equilibrium. The expres-sion describing metabolic equilibrium contains heart mass value. Therefore, as studying heart mass in
vivo is not possible, it may be important to study it in vitro [2, 11].
in which no macroscopic developmental abnormal-ities or pathologic changes were found. Hearts weighing up to 400 g were divided into 3 age groups: coming from cadavers of people dead at 18–40 years of age (9 female and 39 male), 41–65 years of age (14 female and 25 male), and over 65 years of age (4 female and 5 male).
An additional group of 11 hearts weighing over 400 g has been isolated. In these hearts we did not find any macroscopic developmental abnormalities or pathologic changes neither, but their mass ex-ceeded the normal value according to classic text-books, even with the acceleration phenomenon con-sidered (plus 30%) [1, 3, 4, 8, 12, 13, 17, 18, 20]. In this group mean heart mass was 450.45 ± 48.50 g and mean age was 53.91 ± 14.92 years. The group consisted of 27% women and of 73% men.
The measurements performed in our study were as follows:
— X-axis — longitudinal heart dimension, measured from the apex of the heart to the aortic bulb; — Y-axis — largest transverse heart dimension,
mea-sured at the level of auricles;
— Z-axis — sagittal heart dimension, measured just over the coronary sulcus level;
— right ventricle thickness — measured just below the tricuspid valve level along the shortest sec-tion between epicardium and trabeculae car-neae;
— heart mass — the organs were weighted after removing the pericardium and great vessels and cleaning blood clots.
The age groups were tested for normal distribu-tion (p < 0.005) using the Shapiro-Wilk test. The results showed Gaussian distribution, which confirms a correct age group selection [9, 15].
RESULTS
Right ventricle wall thickness was measured. We examined the hypothesis of a different right ventri-cle wall thickness in the groups of hearts weighing up to 400 g and above 400 g. In the first group, right ventricle wall thickness was 4.23 ± 0.76 mm and in the second group 4.55 ± 0.55 mm. Table 1 presents the statistical tests results concerning right ventricle wall thickness differences between these groups. For all tables, “µ1” stands for the first group described in column 1 (in the case of Table 1, hearts with a mass £ 400 g), and “µ2” stands for the sec-ond group described in column 1 (in the case of Ta-ble 1, hearts with a mass > 400 g). Column “x1-x2”
in all tables shows the difference between mean val-ues in the two groups. “µ1 = µ2” stands for the probability of an equivalence between the two groups, and “µ1 £ µ2” stands for the probability of the calculated difference between the groups.
Results of the t-Student test show that with a 95% probability right ventricle wall thickness value is small-er in the group of hearts weighing up to 400 g than in hearts weighing over 400 g. Right ventricle wall thick-ness was larger than the normal value established with echocardiography [6].
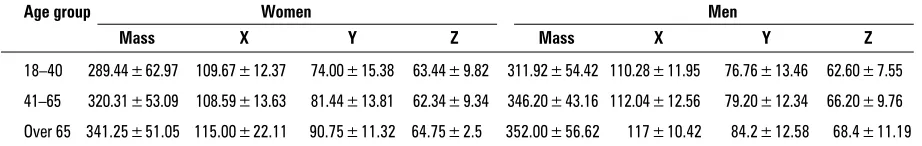
Mean dimensions ± standard deviation (SD) of ba-sic heart axes are presented in Tables 2 (for hearts weigh-ing £ 400 g) and 3 (for hearts weighweigh-ing £ 400 g).
Table 1. Comparison of right ventricle wall thickness in group 1 (heart mass £ 400 g) and group 2 (heart mass > 400 g)
Heart mass x1-x2 s2(x) t False rejection of true hypothesis
µ1 = µ2 µ1 £££££ µ2
£ 400 vs. > 400 –0.32 0.557141 1.29954 20% 10%
Table 2. Dimensions of basic heart axes for heart mass £ 400 g
Age group Women Men
Mass X Y Z Mass X Y Z
18–40 289.44 ±62.97 109.67 ±12.37 74.00 ± 15.38 63.44± 9.82 311.92 ± 54.42 110.28 ± 11.95 76.76 ± 13.46 62.60 ± 7.55
41–65 320.31 ±53.09 108.59 ±13.63 81.44 ± 13.81 62.34± 9.34 346.20 ± 43.16 112.04 ± 12.56 79.20 ± 12.34 66.20 ± 9.76
Over 65 341.25 ±51.05 115.00 ±22.11 90.75 ± 11.32 64.75± 2.5 352.00 ± 56.62 117 ± 10.42 84.2 ± 12.58 68.4 ± 11.19
Table 3. Dimensions of basic heart axes for heart mass
> 400 g
X Y Z
We started the analysis by comparing differenc-es in basic heart axdifferenc-es dimensions (X, Y, and Z axdifferenc-es) between male and female hearts within particular age groups, for hearts weighing £ 400 g. c2
test has been applied; results are presented in Table 4. We found that dimensions of basic heart axes differ in men and women, with the largest differences in the group of 41–65 years of age.
By comparing basic heart axes with c2 test we
found the following:
— the largest differences in all parameters appear in the age group of 41–65 years (c2
= 4.78449) — the dimension which differs the most in all groups
is X, the longitudinal heart axis (c2
= 7.110595); other parameters differ much less but show a sim-ilar distribution.
Next step was comparing X, Y and Z dimensions within particular age groups, separately for both sexes. These dimensions were found to be statisti-cally independent in both sexes and in all age groups. Conclusions for particular age groups are:
• 18–40 years:
— there are clear correlations between X and Y di-mensions and between Y and Z didi-mensions both
in female and male hearts. These correlations are stronger in female hearts (higher Pearson coeffi-cient). Other correlations are not clear;
• 41–65 years:
— there is a clear correlation between X and Y dimen-sions in female hearts. Other correlations are weak; — in male hearts correlations are similar. There ex-ists a clear correlation between X and Y dimen-sions, but it is weaker than in the female sub-group. Other correlations are not clear;
• Over 65 years:
— in female hearts there exist a considerable corre-lation between X and Y and a clear correcorre-lation between Y and Z. However, the correlation be-tween X and Y is weak;
— in male hearts a clear correlation between X and Y appears, other correlations are not clear. Final conclusions from the above calculations are: — dimensions X, Y, Z are statistically independent
for both sexes and in all age groups;
— correlation between X and Y is stronger than the others;
— all correlations are stronger in female than in male hearts;
Tables 5 and 6 compare particular heart axes di-mensions in different age groups. Table 5 shows the results for the female subgroup and Table 6 for the male one. Results are presented separately for every main heart axis.
According to Table 5, it can be neither confirmed, nor excluded that longitudinal heart axis dimension (X) in female hearts changes with age. Transverse heart dimension (Y) clearly increases across age groups, but differences between particular age groups are not clearly marked. Sagittal heart dimen-sion (Z) is constant after the age of 18.
Table 4. Dependence of dimensions of main axes of
hearts between male and female hearts in particular age groups
Age X Y Z ccccc2
group
18–40 0.003434 0.098986 0.011322 0.113741
41–65 4.144198 0.136809 0.503441 4.784449
Over 65 2.962963 0.536352 0.194773 3.694088
c2 7.110595 0.772147 0.709537 8.592279a = 7%
Table 5. Relation between main heart axes dimensions within particular age groups in female hearts
Women 18–40 41–65 Over 65 Compared age groups x1-x2 s2(x) t Hypothesis
µ1 = µ2 µ1 £££££ µ2
X 109.7 107.7 115.0 18–40_41–65 1.96667 173.632 0.353979 0.726725 0.363362
SD 12.4 13.6 22.1 41–65_over 65 –7.30000 238.935 0.839231 0.412986 0.206493
18–40_over 65 –5.33333 244.545 0.567543 0.581744 0.290872
Y 74.000 81.267 90.750 18–40_41–65 –7.26667 215.702 1.173464 0.253158 0.12658
SD 15.379 14.276 11.325 41–65_over 65 –9.48333 190.481 1.221050 0.238732 0.11937
18–40_over 65 –16.75000 206.977 1.937461 0.078781 0.03939
Z 63.444 61.833 64.750 18–40_41–65 1.611111 91.68434 0.399061 0.693696 0.346848
SD 9.825 9.430 2.500 41–65_over 65 –2.916667 74.32843 0.601185 0.555649 0.277825
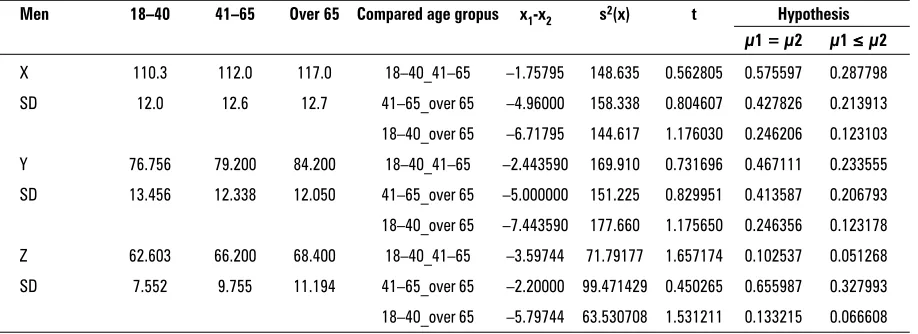
Table 6 presents the results found for the male sub-group. Here, transverse heart dimension (Y) increases in consecutive age groups with an 88% probability. Sagittal heart dimension (Z) increases between the first and the second group (18–40 and 41–65 years, respec-tively) with a probability of 94%. Changes of longitu-dinal dimension (X) in male hearts are ambiguous.
DISCUSSION
Hearts weighing up to 400 g were divided into 3 age groups: coming from cadavers of people dead at the age of 18–40 years, 41–65 years, and over 65 years. Additionally, we distinguished a group of 11 hearts weighing over 400 g.
Distinguishing this group was caused by the fact that a comparison of anatomy textbooks and an-thropological tables data from the period since the beginning of the 20th
century to nowadays is not indicative of a significant change in basic heart di-mensions, while it shows a change of up to 30% in the normal values of other parameters over the same period [3, 20]. These changes may be caused by the acceleration phenomenon as well as by the popula-tion ageing.
As anatomical investigations are performed on for-malin-fixed organs, it seems essential to study heart mass and dimensions using hearts prepared in the same way. Time elapsed from death till collecting organs for studies also seems to play a role, because of rigor
mor-tis and posthumous changes that are stopped by
for-malin. Literature concerning heart mass and main axes dimensions is incoherent and fragmentary.
Right ventricle wall thickness in hearts weighing up to 400 g conformed to the normal value estab-lished by Hudson [6]. Echocardiographic normal range is wider and includes values £ 5 mm [7]. This
difference is related to the fact that right ventricle wall thickness measurement in cadavers does not include epicardium nor endocardium, while echocar-diographic measurement includes both those layers. Right ventricle wall thickness in hearts weighing up to 400 g was 4.26 mm, and 4.55 mm in hearts with a mass over 400 g. The difference between our re-sult and the normal value according to Hudson [6] was smaller than the measurement accuracy. There-fore, right ventricle wall thickness can be considered normal in the group of hearts weighing up to 400 g. In Bochenek [1] anatomy textbook the same val-ues of heart parameters reappear in consecutive editions. According to this source, normal heart mass is equal to 300 g. Sokołowska-Pituchowa [16] also recognizes 300 g as a normal heart mass value (280– 340 g for male hearts and 220–280 g for female hearts). Unlike Bochenek [1], this author distinguishes heart dimensions in living humans and in cadavers. According to her, normal values are the following: longitudinal heart axis 14–15 cm in vivo, against 12 cm in cadavers; transverse axis 10–15 cm against 8–9 cm, respectively; sagittal axis 8 cm, against 6 cm. Nor-mal heart mass according to Lippert [10] is 300 g in males and 220 g in females. This author does not give values of main heart axes dimensions, but in contrast to Sokołowska-Pituchowa [16] he describes the values in cadavers as being usually larger than in
vivo. According to Testut [18, 19], normal values
are the following — heart mass in males: 270–275 g, in females: 250 g, male heart longitudinal axis: 105 mm, height: 98 mm (he does not define whether “height” means a transverse, or a sagittal dimension). Ac-cording to this author, dimensions of the main axes in a female heart are 5–10 mm smaller than in men. According to Rouviere [14], normal heart mass is 270 g
Table 6. Dependence of dimensions of main axes of hearts between particular age groups in male hearts
Men 18–40 41–65 Over 65 Compared age gropus x1-x2 s2(x) t Hypothesis
µ1 = µ2 µ1 £££££ µ2
X 110.3 112.0 117.0 18–40_41–65 –1.75795 148.635 0.562805 0.575597 0.287798
SD 12.0 12.6 12.7 41–65_over 65 –4.96000 158.338 0.804607 0.427826 0.213913
18–40_over 65 –6.71795 144.617 1.176030 0.246206 0.123103
Y 76.756 79.200 84.200 18–40_41–65 –2.443590 169.910 0.731696 0.467111 0.233555
SD 13.456 12.338 12.050 41–65_over 65 –5.000000 151.225 0.829951 0.413587 0.206793
18–40_over 65 –7.443590 177.660 1.175650 0.246356 0.123178
Z 62.603 66.200 68.400 18–40_41–65 –3.59744 71.79177 1.657174 0.102537 0.051268
SD 7.552 9.755 11.194 41–65_over 65 –2.20000 99.471429 0.450265 0.655987 0.327993
in men and 260 g in women. This author does not describe the dimensions of main axes. According to Hoffman et al. [5], in turn, average mass of a male heart is 280–340 g, and of a female heart 230–280 g. This author gives the following dimensions of main heart axes, regardless of the sex — longitudinal: 12 cm, transverse: 8–9 cm, and sagittal axis: 6 cm. Kruś [8] describes in detail heart mass and main dimensions within particular age groups. His choice of age groups is different from ours, and he presents heart dimensions from fetal life to the age of 80.
Our results of heart mass are about 30% larger than the results of all cited studies excluding Kruś [8]; however, his textbook has been based on a study from 1975. This increase in heart mass may be as-cribed to the phenomenon of acceleration, as well as to the population ageing [3, 20]. Results of heart mass measurement are coherent with other authors in the youngest age group studied (18–40 years of age), and partly in the second group (41–65 years). Our results are coherent with normal values es-tablished by Kruś [8], except for the age group of 56–80 years according to his division. In this group, average heart mass was higher than 400 g, and it seems that results presented in his textbook are population data rather than standards. In our study group, most hearts with a mass of more than 400 g were taken from bodies of people older than 55 years. In the study by Kruś [8], values of basic heart dimen-sions are not accompanied by corresponding ventri-cle wall thickness values. It is therefore not possible to establish whether all examined hearts were nor-mal, or a part of them carried signs of hypertrophy.
Our results concerning basic heart axes dimen-sions are consistent with Sokołowska-Pituchowa [16] in two age groups: 18–40 and 41–65 years. The dif-ference in the age group of over 65 years is proba-bly related to human life extension. The values given by Sokołowska-Pituchowa [16] do not take into con-sideration the factors of age and sex. Some of the mentioned authors do not give these values at all [10, 14]. Our obtained longitudinal heart axis value is larger than the one given by Testut [18, 19]. This author does not precise whether the dimension val-ue corresponds to a living heart or to a cadaver. Our results agree numerically with the data given by Hoffman et al. [5], but she describes them as the dimensions of a heart in maximal relaxation, while our results concern a contracted heart. This
consi-dered, our results are larger than the ones of Hoff-man et al. [5].
Establishment of new and actual normal values of main heart axes dimensions in adult humans is still an open subject. This question should be investigated on larger study groups and the correlation with both left and right ventricle wall thickness should be examined. The above problems will be the subject of our next study.
REFERENCES
1. Bochenek A (1990) Anatomia człowieka. 10 (6) ed. Vol. I and III. PZWL, Warszawa.
2. Camici E, Ferrannini E, Opie LH (1998) Cardiac mark-ers. Eur Heart J, 19 (suppl N).
3. Czekanowski J (1934) Człowiek w czasie i przestrzeni. Vol. IX. Biblioteka Wiedzy, Warszawa.
4. Gray’s anatomy atlas (1989) In: Williams P, Warwick R, Dyson M, Bannister L (eds.). 37th ed. Churchill
Living-stone, Edinburgh, London, Melbourne, New York. 5. Hoffman M, Rydlewska-Sadowska W, Rużyłło W (1989)
Wady serca. 2nd ed. PZWL, Warszawa.
6. Hudson REB (1965) Cardiovascular pathology. 1st ed.
Vol. I and II. Edward Arnold (Publishers) LTD, London. 7. Januszewicz W, Kokot F (2001) Interna. 1st ed. Vol. I.
PZWL, Warszawa.
8. Kruś S (1979) Patomorfologia serca. 1st ed. PZWL,
Warszawa.
9. Krysicki W, Bartos J, Dyczka W, Królikowska K, Wasilewski M (2002) Rachunek prawdopodobieństwa i statystyka matematyczna w zadaniach. 8 ed. Wy-dawnictwo Naukowe PWN, Warszawa.
10. Lippert H (1998) Anatomia. 1st ed. Wydawnictwo
Me-dyczne Urban & Partner, Wrocław.
11. Mercer DW (1997) Role of cardiac markers in evalua-tion of suspected myocardial infarcevalua-tion, cardiac mark-ers. Postgraduate Medicine, 102: 113–118.
12. Michajłow SS (1987) Kliniczeskaja anatomija serdca. Medicina, Moskwa.
13. Paturet G (1958) Traité d’anatomie humaine tome III Appareil circulatoire. 6 ed. Masson & Cie, Éditeurs, Paris.
14. Rouviere H (1948) Anatomie humaine descriptive et topographique. 4 ed. Masson et Cie, Paris.
15. Sobczyk M (1998) Statystyka. Podstawy teoretyczne. Przykłady — zadania. 1st ed. Wydawnictwo
Uniwer-sytetu Marii Curie-Skłodowskiej, Lublin.
16. Sokołowska-Pituchowa J (2000) Anatomia człowieka. 6 ed. PZWL, Warszawa.
17. Tandler J (1913) Anatomie des Herzens. In: Van Bardele-ben K (ed.). Handbuch der Anatomie des Menchen. G. Fisher, Jena, pp. 84–90
18. Testut L, Latarjet A (1948) Traite d’ anatomie humaine. 6 ed. Vol. II. G. Doin Cie, Paris.
19. Testut L (1923) Anatomia Umana. 3 ed. Vol. IV. Angio-logia, Utet, Torino.
20. Wolański N (1970) Rozwój biologiczny człowieka. 1st ed.