Physics and Astronomy Publications
Physics and Astronomy
3-2009
Competition between area and height evolution of
Pb islands on a Si(111) surface
M. Li
Renmin University of China
Cai-Zhuang Wang
Iowa State University, [email protected]
James W. Evans
Iowa State University, [email protected]
Myron Hupalo
Iowa State University, [email protected]
Michael C. Tringides
Iowa State University, [email protected]
See next page for additional authors
Follow this and additional works at:
http://lib.dr.iastate.edu/physastro_pubs
Part of the
Mathematics Commons
, and the
Physics Commons
The complete bibliographic information for this item can be found athttp://lib.dr.iastate.edu/physastro_pubs/197. For information on how to cite this item, please visithttp://lib.dr.iastate.edu/howtocite.html.
Competition between area and height evolution of Pb islands on a Si(111)
surface
Abstract
Scanning tunneling microscopy experiments reveal that small Pb islands with unstable heights, e.g., four
layers, on a Si(111) surface decay during coarsening, whereas large islands do not decay but grow to a stable
height. This bifurcation in evolution is analyzed by incorporating quantum size effects into theoretical models
for island growth dynamics with appropriate geometries. The effective energy barrier for Pb atoms to reach
the top of four-layer islands is estimated at about 0.26 eV.
Disciplines
Mathematics | Physics
Comments
This article is from
Physical Review B
79 (2009): 113404, doi:
10.1103/PhysRevB.79.113404
Posted with
permission.
Authors
M. Li, Cai-Zhuang Wang, James W. Evans, Myron Hupalo, Michael C. Tringides, and Kai-Ming Ho
Competition between area and height evolution of Pb islands on a Si(111) surface
M. Li,1C. Z. Wang,2J. W. Evans,3M. Hupalo,2M. C. Tringides,2and K. M. Ho2
1Department of Physics, Renmin University of China, Beijing 100872, People’s Republic of China
2Department of Physics and Astronomy and Ames Laboratory-US DOE, Iowa State University, Ames, Iowa 50011, USA
3Department of Mathematics and Ames Laboratory-US DOE, Iowa State University, Ames, Iowa 50011, USA
共Received 22 October 2008; published 16 March 2009兲
Scanning tunneling microscopy experiments reveal that small Pb islands with unstable heights, e.g., four layers, on a Si共111兲surface decay during coarsening, whereas large islands do not decay but grow to a stable height. This bifurcation in evolution is analyzed by incorporating quantum size effects into theoretical models for island growth dynamics with appropriate geometries. Theeffectiveenergy barrier for Pb atoms to reach the top of four-layer islands is estimated at about 0.26 eV.
DOI:10.1103/PhysRevB.79.113404 PACS number共s兲: 68.55.⫺a, 81.15.Aa, 68.35.Md, 68.60.Dv
I. INTRODUCTION
In recent years, many intriguing features have been dis-covered in epitaxial growth of Pb islands on a Si共111兲 sur-face. Pb islands grow to specific heights which are particu-larly stable1 due to “quantum size effects”共QSE兲associated
with electron confinement in the vertical direction within the islands.2–5However, a detailed understanding of the kinetics
of island formation and evolution, which is influenced by QSE, is still lacking.
Recently, rapid coarsening of Pb islands on a Si共111兲 sur-face has been observed.6 Islands with unstable height decay
quickly without changing their heights. Furthermore, the coarsening kinetics has a strong and unusual dependence on the deposition flux共which controls the initial island distribu-tion兲in contrast to classical coarsening.7To explain this be-havior, we developed a theoretical model which incorporates QSE generating a strong height-dependent driving force for coarsening. It also accounted for the role of wetting layer which acts as an efficient mass transport medium between islands.8 In this model, evolution in island height was not considered.
However, further scanning tunneling microscopy 共STM兲 experiments9 found that an unstable island will not decay if
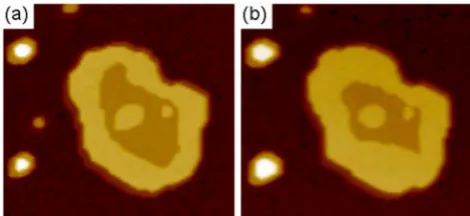
its lateral size is large enough, but rather evolve to a stable height. Figure 1 shows evolution at T= 190 K of a large four-layer island of radius ⬃80 nm with a five-layer-high ring around the perimeter. Large islands were formed by an initial deposition at 240 K with coverage of 1.75 monolayer 共ML兲. The surface was then cooled to 180 K, and a second deposition of 0.25 ML was used to generate smaller islands mainly on the wetting layer between the large islands and to trigger the coarsening of islands to stable heights.9More
de-tailed analysis reveals that ring growth is due to diffusion of Pb atoms from the wetting layer to the top of four-layer islands with a climbing rate of⬃1.8 atoms/s at 190 K.9
In this paper, in order to investigate the bifurcation be-tween island evolution in area versus height, we extend the previous theoretical model8 to describe the competition
be-tween area and height evolution in terms of relevant partial chemical potentials. Below, we first describe the model en-ergetics determining these chemical potentials and then de-scribe the model dynamics. Predicted island evolution is in
good agreement with experiments. The temperature depen-dence of the predicted rate of Pb atoms to reach the top of four-layer islands is described by aneffectiveenergy barrier of ⬃0.26 eV, consistent with an experimental estimate.9,10
II. MODEL GEOMETRIES AND ENERGETICS
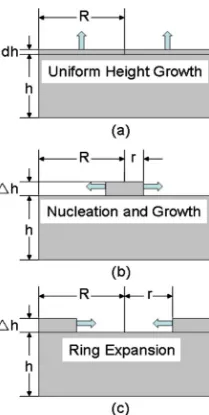
Figure2shows the island geometries adopted in our three different models for island evolution. The first is the most idealized, assuming that islands are perfect cylindrical mesas with continuously changing height as shown in Fig.2共a兲. The other two models incorporate a more realistic description of the formation of new higher layers as shown in Figs. 2共b兲
and 2共c兲, respectively. Below, we first specify the relevant total free energies for each of these island geometries. We also introduce “partial” chemical potentials, 共␣兲, for each possible growth mode␣, which are defined as the change in free energy of the island for each atom added in that specific growth mode. The lower共␣兲, the more favorable is growth mode ␣. A “growth index function” is defined as the differ-ence between partial chemical potentials for two modes in-dicating the preferred mode.
A. Uniform height growth model
[image:3.609.318.553.594.702.2]Pb islands on Si共111兲 of interest here tend to be three-dimensional with flat tops and steep side walls. Thus, in our simplest geometric model, they are approximated as circular
FIG. 1. 共Color online兲 STM images共98⫻84 nm2兲 of a large
four-layer Pb island with a five-layer-high ring around its periphery atT= 190 K. Image共b兲is taken 92 min after共a兲.
PHYSICAL REVIEW B79, 113404共2009兲
mesas with radii R and heights h above the wetting layer. The volume of the island is V⬇R2h and the number of
atoms isN=V/⍀, where⍀is the atomic volume. Units ofh are interlayer spacing and forRare chosen so thatR2gives the number of atoms in each layer and⍀= 1. The free energy of an island can be written as8
E共R,h兲=R2h⑀b+R2␥t共h兲+ 2Rh␥s. 共1兲
Here,⑀bis the bulk energy per unit volume;␥tand␥sare the surface energies per unit area of the mesa top and the mesa sidewall, respectively. Based on density-functional theory analysis4,11 and experimental observations,1,3 we obtain ␥
t ⬇0.183, 0.196, 0.191, 0.201, and 0.192 eV forh= 3, 4, 5, 6, and 7, respectively;␥sis estimated to be 0.33 eV.8,12
Then, the partial chemical potential for radial growth satisfies8,13
共R兲=⍀
冏
dE dV冏
h=const=⍀
冉
⑀b+␥t h +
␥s
R
冊
. 共2兲For height growth, the partial chemical potential satisfies13
共h兲=⍀
冏
dE dV冏
R=const=⍀
冉
⑀b+ d␥tdh + 2␥s
R
冊
. 共3兲Here we will assume that␥tis a continuous function ofhand linearly interpolates the two relevant discrete heights. Thus, one has d␥t/dh=⌬␥t/⌬h, where⌬␥t=␥t共h+⌬h兲−␥t共h兲with ⌬h共=1 or 2兲 denoting the discrete incremental height in-crease.
The growth index function,⌬=共h兲−共R兲, reflects the competition between radial growth 共⌬⬎0兲 and growth in height共⌬⬍0兲of a Pb island. If the island radiusRis large enough, the third terms on the right side in Eqs.共2兲and共3兲
can be neglected. Then ⌬ is simply determined from
knowledge of ␥t versus h and is invariably negative, e.g., ⌬= −0.055共−0.047兲 for growth from h= 4 to 5 共6兲 and −0.028共−0.036兲for growth fromh= 5 to 6共7兲. Therefore, in this simplest geometric model, an island with large lateral size energetically prefers to grow in height, consistent with our experimental observations.9 A large four-layer island tends to grow to five layers. But a large five-layer island tends to simultaneously grow two layers to become seven-layer high because of an additional energetic preference over growth to six-layer high. This could explain the bilayer growth from five-layer to seven-layer islands observed in experiments.10
For an island with smaller radius, however, the third terms in Eq.共2兲and共3兲cannot be ignored. Such islands may decay slowly or disappear quickly within 2–3 min.8Whether a
rela-tively small island grows in area, in height, or in both direc-tions simultaneously depends on its lateral size.
B. Island nucleation and growth model
In reality, growth of island height occurs by nucleation of new islands on top of an unstable island. Formation of the new island could occur in the center of the unstable island, but more often off center. The analysis below applies in ei-ther case, at least until the new island grows to reach the edge of the lower layer. For the island geometry in Fig.2共b兲, the energy of the island can be written as
E共R,h,r,⌬h兲=共R2h+r2⌬h兲⑀b+共R2−r2兲␥t共h兲
+r2␥t共h+⌬h兲+ 2Rh␥s+ 2r⌬h␥s.
共4兲
The partial chemical potentials for radial growth of the base island and new top layer, respectively, have the form
共R兲=⍀
冉
⑀b+␥t共h兲
h +
␥s
R
冊
, 共5兲共r兲=⍀
冉
⑀b+ ⌬␥t⌬h +
␥s
r
冊
. 共6兲In this model when r is very small, the partial chemical potential for growth of a new island will be much higher than that for radial growth of the base. Clearly, there is a signifi-cant barrier to nucleate such islands and they must be suffi-ciently large to survive. For example, for a four-layer island with very largeR, the radius of atop layer island must exceed r= 6 in order to favor its growth 共based on the parameters indicated above兲. The smaller islands on top of large four-layer islands as shown in Fig. 1 were formed during the second stage of deposition. They are large enough to survive, their size not changing significantly over 92 min.
C. Ring expansion model
As observed in the experiments, a ring structure forms quickly along edges on top of a large four-layer island. Sub-sequently, the ring gradually expands.9For the model
[image:4.609.121.226.65.273.2]geom-etry shown in Fig.2共c兲with the ring height,⌬h共=1兲, the free energy can be written as
FIG. 2. 共Color online兲Schematic of the cross section of island geometries for various models: 共a兲 uniform height growth;共b兲 is-land nucleation and growth 共on top of unstable islands兲;共c兲 ring expansion 共after formation of a ring on top of unstable islands around the periphery兲.
BRIEF REPORTS PHYSICAL REVIEW B79, 113404共2009兲
E共R,h,r,⌬h兲=关R2h+共R2−r2兲⌬h兴⑀b+R2␥t共h兲
+共R2−r2兲␥t共h+⌬h兲
+ 2R共h+⌬h兲␥s+ 2r⌬h␥s. 共7兲
The partial chemical potentials for radial growth and ring expansion, respectively, satisfy
共R兲=⍀
冉
⑀b+␥t共h+⌬h兲 h+⌬h +
␥s
R
冊
, 共8兲共r兲=⍀
冉
⑀b+ ⌬␥t⌬h −
␥s
r
冊
. 共9兲The growth index function, ⌬=共r兲−共R兲, is always negative, so that ring expansion is always energetically fa-vorable. Thus, for a four-layer island, once a ring structure is formed on top, it will always expand.
III. MODEL DYNAMICS
Next, we give a general specification of island evolution in the various specific growth modes,␣, for the above mod-els. The rate of change in size, N 共measured in number of atoms兲, associated with growth mode␣ satisfies
dN/dt兩␣⬇L␣共␣+−␣−兲. 共10兲
In uniform height growth model, ␣=R 共radial growth兲 or h 共height growth兲 and in the other two models, ␣=R 共radial growth of the base兲or r 共island growth or ring expansion兲. Also, L␣ denotes the length of the step edge from which adatoms attach and detach for growth in mode␣. In Eq.共10兲,
␣+=0exp关−共␣T−WL兲/共kBT兲兴 and ␣−=0exp兵−关␣T −共␣兲兴/共kBT兲其, representing adatom attachment and detach-ment rates共per unit length兲, respectively. We further assume that adatoms are attaching to islands from the wetting layer which has a chemical potential WL. In these expressions,
共␣兲are the above-mentioned partial chemical potentials,␣T is the chemical potential in the transition state,0is attempt
frequency taken as 1013/s,T is the surface temperature, and
kB is the Boltzmann constant.
Model analysis follows from integrating Eq. 共10兲 after prescribing the initial island configuration. We assume that the chemical potential of the wetting layer, WL ⬃0.040 eV,8does not change during evolution of the island
of interest. The size of the region influencing island evolu-tion is very large 共1000⫻1000 nm2兲, so that the
wetting-layer coverage which controlsWLwill not change much by
removing ⬃10 000 atoms during island evolution.
A. Uniform height growth model
In this case, Eq.共10兲can be written as
hdR dt =共R
+
−R
−兲
, Rdh dt = 2共h
+
−h
−兲
, 共11兲
for radius and height growth. We choose RT⬃0.66 eV as previously,8 but need to estimate
h T .
As noted above, the experimental rate of Pb atoms reach-ing the top of a four-layer island with R⬇80 nm is ⬃1.8 atoms/s atT= 190 K. Using Eq.共11兲,h
T
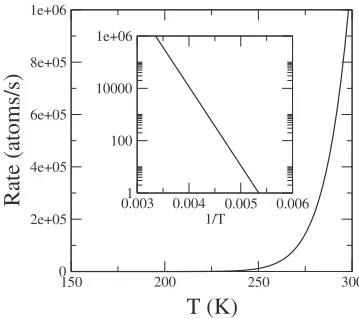
must be cho-sen as 0.66 eV to match this rate. Then, from Eq. 共11兲, we can calculate the transfer rate of Pb atoms from the wetting layer to the top of the island at various temperatures, reveal-ing a strong temperature dependence 共see Fig.3兲. At 180 K, the estimated transfer rate is about 0.24 atoms/s, but at 240 K it increases to about 3655 atoms/s. This analysis explains why in STM experiments there is no visible change on the top of the islands at 180 K, but at 240 K the change cannot be observed within the STM acquisition speed.
The inset of Fig. 3 shows an Arrhenius plot determining theeffectiveenergy barrier of about 0.26 eV which Pb atoms in the wetting layer must overcome to reach the top of four-layer islands. This is consistent with calculations of the modified embedded atom method.14 In the previous
experiments10 the effective energy barrier was estimated
⬃0.32 eV for Pb atoms to reach the top of five-layer islands and form seven-layer islands. This barrier should be smaller for unstable islands.
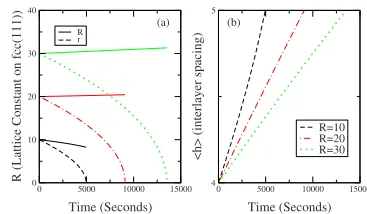
For smaller islands, the areas and the heights change si-multaneously. Using the uniform height growth model, we simulate the evolution of four-layer islands with various ini-tial radii 共see Fig.4兲. An island with R= 10 decays in area very quickly, keeping its height unchanged. In contrast, for
150 200 250 300
T (K)
0 2e+05 4e+05 6e+05 8e+05 1e+06Rate
(atoms
/s
)
0.003 0.004 0.005 0.006 1/T
[image:5.609.81.261.67.227.2]1 100 10000 1e+06
FIG. 3. Temperature dependence of diffusion rate of Pb atoms from the wetting layer to the top of a large four-layer island with
R= 80 nm. Inset shows log plot of rate vs 1/T.
0 5000 10000 15000
Time (Seconds) 0 10 20 30 40 R (Latt ice Constant on fcc(111))
0 5000 10000 15000
[image:5.609.83.259.589.695.2]Time (Seconds) 3 4 5 Height (interlayer spacing) R=10 R=15 R=20 R=30 (a) (b)
FIG. 4. 共Color online兲 共a兲 Time evolution of the area and 共b兲 height of a four-layer island with different initial radiusR= 10, 15, 20, and 30, respectively, at T= 190 K in uniform height growth model.
BRIEF REPORTS PHYSICAL REVIEW B79, 113404共2009兲
an island with R= 30, the lateral size barely changes, but height increases. For the island with R= 15 and 20, the area and height change simultaneously with area shrinking and height growing to quickly reach five layers. The “minimum” radius R for a four-layer island that does not disappear is estimated about 3.5 nm at 190 K. If R is bigger than ⬃11.5 nm, the area does not change, but height grows. After the island reaches five layers, it may grow up to seven-layer islands over longer times. The above analysis shows that predictions of the uniform height growth model are consis-tent with the experimental observations.
B. Ring expansion model
We have also investigated the evolution of base area and ring for a four-layer island with a ring in this model where Eq. 共10兲becomes
共h+⌬h兲dR
dt =共R
+−
R
−兲, −r⌬hdr
dt =共r
+−
r
−兲. 共12兲
All parameters are kept the same as those in the uniform height growth model includingR
T⬃
0.66 eV and we select
r T⬃
0.66 eV based on the same type of analysis as for the uniform height growth model.
Figure 5 shows the time evolution of island radius R, inner radius r of the ring, and the average height of the island. The latter is readily determined from 具h典=关hr2+共h
+⌬h兲共R2−r2兲兴/R2. The evolution of islands is qualitatively similar to that in the uniform height growth model. However, since the ring expansion model accounts for the detailed ge-ometry of the ring structure, so there are slight differences. For example, for islands with initial radius larger than 20,R increases slightly during coarsening, in contrast to the behav-ior in uniform height growth model. The island with R= 10 decays and quickly disappears in uniform height growth model, while it survives in the ring expansion model. This is because once a ring is formed on top of a four-layer island,
the ring growth is preferred, and a new layer is formed quickly, and finally the island grows to a stable height before it disappears.
In summary, the competition between growth of island area and height was investigated using various models for island geometry evolution. Detailed analysis indicates the existence of a significant barrier for nucleation of new is-lands on top of isis-lands with unstable heights. Furthermore, such unstable islands must be sufficiently large to avoid rapid decay. However, once a ring structure has formed on such islands, it is energetically more favorable for the ring to expand共increasing the average island height兲than for radial growth of the supporting island.
ACKNOWLEDGMENTS
M.L. was supported for the work by NSF of China under Grant No. 10704088 and J.W.E. by NSF under Grant No. CHE-0809472. Work at Ames Laboratory was supported by the US DOE-BES including the computer time at NERSC in Berkeley. Ames Laboratory is operated for the US DOE by ISU under Contract No. DE-AC02-07CH11358.
1K. Budde, E. Abram, V. Yeh, and M. C. Tringides, Phys. Rev. B
61, R10602共2000兲; M. Hupalo, S. Kremmer, V. Yeh, L. Berbil-Bautista, E. Abram, and M. C. Tringides, Surf. Sci. 493, 526 共2001兲; M. Hupalo and M. C. Tringides, Phys. Rev. B 65, 115406共2002兲.
2Z. Zhang, Q. Niu, and C.-K. Shih, Phys. Rev. Lett. 80, 5381
共1998兲.
3W. B. Su, S. H. Chang, W. B. Jian, C. S. Chang, L. J. Chen, and
T. T. Tsong, Phys. Rev. Lett. 86, 5116共2001兲.
4C. M. Wei and M. Y. Chou, Phys. Rev. B 66, 233408共2002兲. 5H. Hong, C.-M. Wei, M. Y. Chou, Z. Wu, L. Basile, H. Chen, M.
Holt, and T.-C. Chiang, Phys. Rev. Lett. 90, 076104共2003兲.
6C. A. Jeffrey, E. H. Conrad, R. Feng, M. Hupalo, C. Kim, P. J.
Ryan, P. F. Miceli, and M. C. Tringides, Phys. Rev. Lett. 96, 106105共2006兲.
7M. Zinke-Allmang, L. C. Feldman, and M. H. Grabow, Surf. Sci.
Rep. 16, 377共1992兲.
8M. Li, J. W. Evans, C. Z. Wang, M. Hupalo, M. C. Tringides, and
K. M. Ho, Surf. Sci. 601, L140共2007兲.
9M. Hupalo and M. C. Tringides, Phys. Rev. B 75, 235443
共2007兲.
10A. Menzel, M. Kammler, E. H. Conrad, V. Yeh, M. Hupalo, and
M. C. Tringides, Phys. Rev. B 67, 165314共2003兲.
11T. L. Chan, C. Z. Wang, M. Hupalo, M. C. Tringides, and K. M.
Ho, Phys. Rev. Lett. 96, 226102共2006兲.
12C. Bombis, A. Emundts, M. Nowicki, and H. P. Bonzel, Surf.
Sci. 511, 83共2002兲and references therein.
13Y. Han, J. Y. Zhu, F. Liu, S.-C. Li, J.-F. Jia, Y.-F. Zhang, and
Q.-K. Xue, Phys. Rev. Lett. 93, 106102共2004兲.
14Y. Han, G.-H. Lu, B.-J. Lee, and F. Liu, Surf. Sci. 602, 2284
共2008兲.
0 5000 10000 15000 Time (Seconds) 0 10 20 30 40 R (Latt ice Constant on fcc(111)) R r
[image:6.609.341.525.66.173.2]0 5000 10000 15000 Time (Seconds) 4 5 <h> (interlayer spacing) R=10 R=20 R=30 (a) (b)
FIG. 5. 共Color online兲 共a兲Time evolution of the island radiusR
and inner radius of the ringrfor a four-layer island with different initial radii共R=r兲in ring expansion model atT= 190 K.共b兲Time evolution of the average height具h典.
BRIEF REPORTS PHYSICAL REVIEW B79, 113404共2009兲