Patron: Her Majesty The Queen Rothamsted Research Harpenden, Herts, AL5 2JQ
Telephone: +44 (0)1582 763133 Web: http://www.rothamsted.ac.uk/
Rothamsted Research is a Company Limited by Guarantee Registered Office: as above. Registered in England No. 2393175. Registered Charity No. 802038. VAT No. 197 4201 51. Founded in 1843 by John Bennet Lawes.
Rothamsted Repository Download
A - Papers appearing in refereed journals
Zhao, F-J., McGrath, S. P. and Merrington, G. 2007. Estimates of
ambient background concentrations of trace metals in soils for risk
assessment. Environmental Pollution. 148 (1), pp. 221-229.
The publisher's version can be accessed at:
•
https://dx.doi.org/10.1016/j.envpol.2006.10.041
The output can be accessed at:
https://repository.rothamsted.ac.uk/item/89w2v/estimates-of-ambient-background-concentrations-of-trace-metals-in-soils-for-risk-assessment
.
© 16 January 2007, Elsevier Sci Ltd.
Estimates of ambient background concentrations of trace
metals in soils for risk assessment
F.J. Zhao
a,*
, S.P. McGrath
a, G. Merrington
ba
Agriculture and Environment Division, Rothamsted Research, Harpenden, Hertfordshire AL5 2JQ, UK bChemicals Team, Environment Agency, Evenlode House, Howbery Park, Wallingford, Oxon OX10 8BD, UK
Received 10 August 2006; received in revised form 12 October 2006; accepted 19 October 2006
Ambient background concentrations of Cd, Co, Cr, Cu, Ni, Pb and Zn in surface soils are estimated using the soil inventory data for England and Wales.
Abstract
Site-specific or soil type-specific ambient background concentrations (ABCs) of trace metals in soils are needed for risk assessment. We in-vestigated three different methods for estimating ABCs in soils using a dataset of 5691 soil samples from England and Wales. The concentrations of Co, Cr and Ni were strongly associated with Al and Fe, and multiple regressions explained 62e85% of their variation, and Al and Fe can
therefore be used to predict ABCs for these metals. Soil texture had a major influence on the concentrations of Cd, Co, Cr, Cu, Ni and Zn, and the medians were 3e5 fold higher in clayey than in sandy soils. This was used to predict texture-specific ABCs. Lead concentration was higher in
acidic peaty soils than in other soils. A probability graph method was used to estimate ABC for Pb in a population of relatively uncontaminated soils. Potential applications of ABCs are discussed.
Ó2006 Elsevier Ltd. All rights reserved.
Keywords:Ambient background concentration; Trace metals; Soils; Risk assessment
1. Introduction
Trace metals in surface soils are derived from both parent materials and anthropogenic activities. Because of the latter, it is often difficult to quantify the natural background concen-trations of metals in soils. In fact, it can be argued that natural background no longer exists on this planet because of human influence (Reimann and Garrett, 2005), and this is particularly true for long-industrialised regions like the UK. Therefore, the usual, or ambient, concentration of a metal in soil consists of both a natural pedo-geochemical fraction and an anthropo-genic fraction (International Organisation for Standardisation
(ISO), 2005). In the ISO document, the anthropogenic fraction
refers to moderate diffuse inputs into the soil, not the inputs
from local point sources that generally result in a much ele-vated concentration. In this paper, we have used the term ‘‘am-bient background concentration’’ (ABC) with the same meaning as that of ‘‘usual background concentration’’ defined by ISO.
ABCs of trace metals in soils may vary depending on soil types and land uses. Soil parent materials and pedogenesis clearly have a key influence on metal ABCs (Palumbo et al., 2000; Baize and Sterckeman, 2001; Rawlins et al., 2003). Attempts to define a single background value, or an ABC, for a large area is fraught with problems because of het-erogeneity of regional geochemistry and the fact that ABC is a range, not a single value (Reimann and Garrett, 2005). Use of a single ABC for a large area, regardless of the spatial var-iation in soil type and properties, could give rise to either overestimation or underestimation of metal contamination and the associated risk for a particular soil. The question arises whether it is possible to estimate a local or soil-type
* Corresponding author. Tel.:þ44 1582 763133; fax:þ44 1582 760981.
E-mail address:fangjie.zhao@bbsrc.ac.uk(F.J. Zhao).
0269-7491/$ - see front matterÓ2006 Elsevier Ltd. All rights reserved. doi:10.1016/j.envpol.2006.10.041
specific ABC, which is essential for risk assessment and reg-ulation of metals in soil.
There is as yet no agreed method for the estimation of a local or soil-type specific ABC. Kabata-Pendias et al. (1992)
suggested that mean values and ranges of trace metal concen-trations in soil taxonomical units calculated from existing data-bases seem to provide acceptable background values and can serve for the assessment of changes at the local and regional scales. However, their study showed that the differentiation in metal concentrations among soil taxonomical units was not as clear as among soil textural classes, and that the mean and range of a trace metal for the same taxonomical unit varied considerably among different central-eastern European coun-tries. Furthermore, use of mean values is not statistically justi-fied because soil geochemical data rarely show a normal distribution, but are often positively skewed, even after loga-rithmical transformation (Reimann and Filzmoser, 2000). More appropriately, ABCs should be set at a chosen parameter (e.g. median or 90th percentile) from the frequency distribution of the ambient concentrations of trace metals (International
Organisation for Standardisation (ISO), 2005). This method
requires a sufficiently large dataset generated from soil geo-chemical survey conducted at a local regional scale, and can be enhanced when information of soil type, texture, parent material and land use is also available.
Another method is to take metal concentrations measured in the deeper soil horizon (e.g. the C horizon) as the local background for the top soil, usually after correction for the variation of a reference element such as Zr (e.g. Blaser
et al., 2000). This method, named the enrichment factor
approach, has been criticised for, among other things, failing to take into account the natural biogeochemical processes that redistribute elements in the soil profile (Reimann and de
Caritat, 2005; Reimann and Garrett, 2005).
The third approach uses the relationships between trace elements and semi-conservative elements such as Fe, Al and Mn to predict the expected values of trace elements in top soils. Hamon et al. (2004)analysed soil geochemical data in Namibia, Australia and Asia and used relationships with Fe or Mn to make estimates of the background concentrations of As, Co, Cr, Cu, Ni, Pb and Zn, assuming that the soils in a sub-set from ‘‘remote areas’’ were uncontaminated. Their study showed that the relationships are remarkably indepen-dent of both soil type and climatic setting, and the ‘‘back-ground’’ concentrations of trace elements can vary by more than an order of magnitude. Sterckeman et al. (2006) also used a similar approach to estimate the ‘‘pedo-geochemical background’’ concentration of a range of trace elements in soils developed from loess deposit in northern France.
In this paper, we present results from statistical analyses of the soil geochemical data for England and Wales (the National Soil Inventory, NSI), with the aim of estimating local or soil-type specific ABCs for the trace elements Cd, Co, Cr, Cu, Ni, Pb and Zn. We also explored the probability graph method
(Sinclair, 1974; Davies, 1983) as a way for estimating average
regional ABCs for metals in the soils of England and Wales. Potential uses of ABCs are then discussed.
2. Materials and methods
2.1. Data
The data used in the present study are from the National Soil Inventory (NSI) of England and Wales. A total of 5691 soils (0e15 cm) were sampled from the intersects of 5-km orthogonal grids between 1978 and 1983. The sampling was therefore unbiased, and not targeted at any particular land use, and included all types of land use. No attempt was made to devise a sam-pling strategy to cover urban areas adequately, so the coverage is predomi-nantly non-urban. A wide range of physical and chemical properties were determined in the soil samples. Details of sample collection and preparation, analytical methods and quality control, summary statistics and maps for many of the measured soil properties were published in the Soil Geochemical Atlas of England and Wales (McGrath and Loveland, 1992). A further project looked at the detailed spatial relationships within the NSI data (the geostatis-tics), and the application to the design of a soil monitoring network for England and Wales (Oliver et al., 2002).
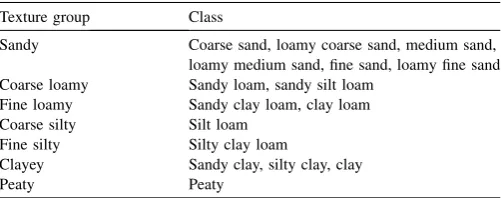
All soils were analyzed for Al, Ba, Cd, Ca, Cr, Co, Cu, Fe, Pb, Mg, Mn, Ni, P, K, Na, Sr and Zn. The focus of this study is on seven trace metals Cd, Co, Cr, Cu, Ni, Pb and Zn. The elemental concentrations were those determined following aqua regia digestion (McGrath and Cunliffe, 1985), which are often referred to as pseudo-total concentrations. Certified reference soils from the BCR (Community Bureau of Reference) were used for quality control as these had certified results for the concentrations of metals in aqua regia digests. The detection limits (calculated as 5 times the absolute instrumental detection limits) were 0.2, 0.5, 1.0, 0.75, 2.0, 4.7 and 0.7 mg kg1for Cd, Co, Cr, Cu, Ni, Pb and Zn, respectively. There are 5651 data points for pH and organic C, and 4842 data points for clay content. Clay content was not determined in peaty soils (generally with organic C>12%). Soil pH was determined in water (soil:water 1:2.5). Organic C was determined either by a dichromate di-gestion method for soils containing<20% C, or by loss-on-ignition for soils containing>20% (McGrath and Loveland, 1992). The information of soil tex-ture, classified according toAvery (1980), was available from field assess-ments carried out at the time of soil sampling. There were six texture groups plus a group of peaty soils, with each texture group consisting of var-ious texture classes (Table 1). Additionally, the major soil taxonomical group was recorded for each sample. There were ten major taxonomical groups for the soils in the NSI dataset, and their approximate equivalents in the USA and FAO classification systems were described by McGrath and Loveland (1992).
2.2. Statistical analysis
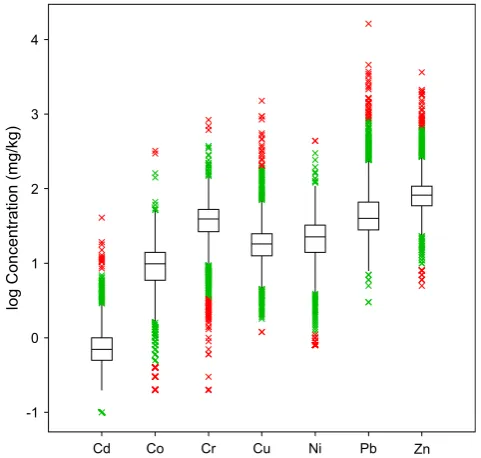
In the dataset, the distributions of the concentrations of the seven trace metals were positively skewed, as is often found with geochemical data (McGrath and Loveland, 1992; Reimann and Filzmoser, 2000). A log10 trans-formation reduced the skewness and kurtosis substantially. However, even this transformation did not produce normally distributed data. Box plot analysis was performed for the Cd, Co, Cr, Cu, Ni, Pb and Zn data, based on both un-transformed and log10-tranformed values. This analysis identifies the median, the values for the 25th and 75th percentile, and the upper and lower whisker
Table 1
Groups and classes of soil texture from field assessmenta
Texture group Class
Sandy Coarse sand, loamy coarse sand, medium sand, loamy medium sand, fine sand, loamy fine sand Coarse loamy Sandy loam, sandy silt loam
Fine loamy Sandy clay loam, clay loam Coarse silty Silt loam
Fine silty Silty clay loam
Clayey Sandy clay, silty clay, clay
Peaty Peaty
a
Classification of soil texture was according toAvery (1980).
(Tukey, 1977). The lower and upper whiskers are 1.5 times the inter-quartile range. Correlation analysis was done on the log10-tranformed data (except clay content, which showed a normal distribution without transformation). Next, principal component analysis (PCA) was performed on the correlation matrix to provide an overall view of the relationships among variables. For PCA, a dataset including all elemental concentrations, organic C and pH was used. Clay content was not included in the PCA because otherwise most of the peaty soils would have been excluded in the analysis due to the lack of clay data. Metal concentrations below the detection limits were taken as they were in the database in the box plot and PCA analyses, except 74 data with zero Cd, which could not be log transformed. These 74 data were excluded whenever log10Cd was used in statistical analysis.
Simple or multiple linear regression analysis was performed on the log10 -tranformed data of Al, Fe and the seven trace metals. Here we made a decision to exclude those data that were below the detection limits or outliers above an upper limit (upper outliers). According to the EU Technical Guidance Docu-ment (TGD) for risk assessDocu-ment (European Commission, 2003), data that are used for assessing environmental concentrations in the regional scenario should not be influenced directly by point-source emissions. The TGD recom-mends that the upper whisker for the log10-tranformed data be taken as the cut-off level for the upper outliers, if the dataset is sufficiently large. Thus, the upper outliers are defined as:
log10ðxiÞ>log10ðp75Þ þ1:5½log10ðp75Þ log10ðp25Þ
wherexiis the outlier cut-off value,p25 andp75 the 25th and 75th percentile of the distribution. For Co, Cr and Ni, for which regression analysis was applied (see below), only very small numbers of samples were excluded because they were either below their respective detection limits (0.2e1.1% of the dataset) or above the outlier cut-off values (0.2e0.5% of the dataset). Exclusion of these data points benefited regression analysis because of a considerable reduction of skewness and kurtosis.
2.3. Frequency distribution according to texture groups
For the seven trace metals, analysis of variance (ANOVA) was performed on the log10-transformed data to test the significance of the influence of soil texture group or major taxonomical group. ANOVA identified soil texture as a key soil factor influencing trace metal concentrations. The data were then sorted according to the seven texture groups (Table 1). The number of samples varied from 182 for the coarse silty group to 2002 for the fine loamy group. Frequency distributions of the concentrations of the seven trace metals within each texture group could not be fitted satisfactorily with parametric distribu-tion funcdistribu-tions (e.g. normal, log-normal, gamma, or Weibull). Therefore, non-parametric distributions were used. Data were ranked in ascending order, and the cumulative probability of a data point xiwas calculated according to the following formula (Cullen and Frey, 1999):
FðxiÞ ¼ ði0:5Þ=n
Whereiis for the rank order of the sorted data andnis the total number of data points within each texture group. Median and percentile values were obtained from this empirical distribution function. All data, including those below the detection limits and zero Cd values, were used in this analysis.
All statistical analyses were carried out using Genstat version 8.2 (VSN International Ltd, Hemel Hempstead, UK).
2.4. Probability plots
Probability graph paper has been used by geochemists to determine the threshold or ‘inflection point’ between anomalously high and background geochemical data, with the aim of mineral prospecting (Sinclair, 1974). How-ever, Davies (1983) applied this method in a different way. He used the method to estimate the mean and the range of Pb concentrations that are likely to be associated with uncontaminated soils, using survey data from four areas in England and Wales. In this method, log10-transformed soil metal concentrations (y-axis) are plotted against their cumulative frequency distri-butions on the probability scale (x-axis). A straight line means that the data
are log-normally distributed, which is usually considered to be the case if all data points are from a single population of samples. However, because a coun-try-wide or regional survey may cover soil samples belonging to both uncon-taminated and conuncon-taminated populations, the relationship between log10 metal concentration and cumulative frequency presented on a probability graph is more likely to be a curve. Mixed populations may also be present, giving rise to curves with inflexion points related to the proportion of each population present. The linear portion associated with low metal concentra-tions is taken as representing the distribution of the uncontaminated soils (Davies, 1983). Here, ‘‘uncontaminated’’ soils should be taken as those not impacted by point-source contamination, rather than pristine soils. More de-tails of the method were given bySinclair (1974)andDavies (1983). We ap-plied the method to derive geometric mean and the 10the90th percentile range for seven trace metals in the ‘‘uncontaminated’’ population within the NSI dataset, although a detailed examination showed that this approach was not suitable for metals other than Pb.
3. Results and discussion
Concentrations of all seven metals in soils varied widely.
Fig. 1 shows the box plots for the log-transformed data of
Cd, Co, Cr, Cu, Ni, Pb and Zn.
3.1. Principal component analysis
PCA identified four principal axes with latent roots of 9.1, 2.7, 2.1 and 1.0, accounting for 47.9%, 14.4%, 10.8% and 5.3% (or 78.4% in total) of the total variance, respectively. The latent vectors describe the contribution to the variation of each variable on each of the principal axes. The larger the absolute values of the latent vectors, the greater the pro-portion of the variation a particular variable accounts for on
Cd Cr
-1
Ni 0
Zn 1
2 3 4
Co Cu Pb
log Concentra
tion (mg/kg)
a given axis. For the first principal axis, Al, Fe, Co, Cr, Ni, K and Mg had latent vector values greater than 0.25 (in absolute value), suggesting that this component represents variation in the structural elements of soil minerals (Al, Fe and K) and the metals associated them. The second principal component was dominated by organic C, Pb, Cu and pH (latent vector absolute values >0.25), suggesting the influence of acidic peaty soils and the association of Pb and Cu with these soils. The variables with latent vector values >0.25 for principal component 3 included Ca, Sr, pH and P, suggesting that this component represents variation in acidity and possibly also the influence of agricultural practices. The concentration of Na had a particularly large value of latent vector (0.65) in principal component 4, suggesting that this might represent a marine influence.
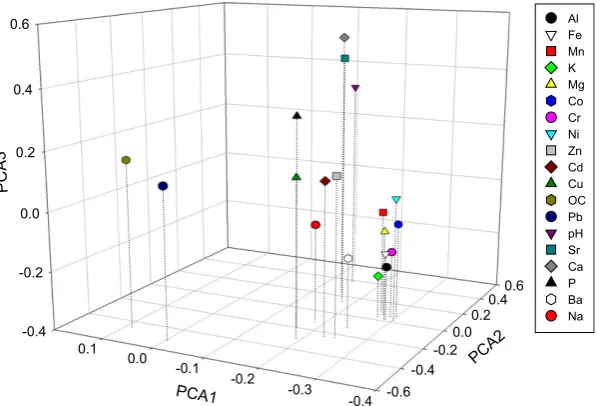
The latent vector loadings for the first three principal com-ponents are shown inFig. 2. This clearly shows the associa-tion among Al, Fe, K, Mn, Cr, Co and Ni. This associaassocia-tion can be explained by classical geochemistry. For example, Co and Ni are classified as siderophilic (iron-loving), and tri-valent forms of Cr, Fe and Al also tend to associate with each other (Goldschmidt, 1954). Similarly, Sterckeman et al.
(2006) reported a close association between Co, Cr and Ni
with Al and Fe in a survey of 52 surface soils from northern France. Other associations include Zn and Cd, which often occur together in minerals. The association among Ca, Sr and pH is easily understood because of their relationship with acidity.Fig. 2confirms the tendency for Pb and organic C to be associated with each other, due to the generally large Pb concentrations in upland peaty soils in northern and west-ern England, where there is a long history of Pb mining and smelting, and the fallout of Pb from the atmosphere to acid ombrotrophic peat may be further enhanced by high rainfall
(McGrath and Loveland, 1992).
3.2. ABCs for Co, Cr and Ni derived from regression analysis
Informed by the results from PCA, we performed regres-sion analysis between Co, Cr, Ni and Fe or Al. Aqua regia-soluble Fe and Al can be considered as semi-conservative properties of soils; their concentrations are related more to the chemical composition of the soil-forming parent materials and the degree of weathering than to the anthropogenic influ-ence (Hamon et al., 2004). UnlikeHamon et al. (2004), we found only weak associations between Zn, Cd, Cu or Pb and Fe (or Al, Mn) (Fig. 2). This, and the strong relationship between Co, Cr, Ni and Fe or Al, are both in accord with clas-sic geochemistry (Goldschmidt, 1954). Therefore, regression was only performed between the latter group of elements.
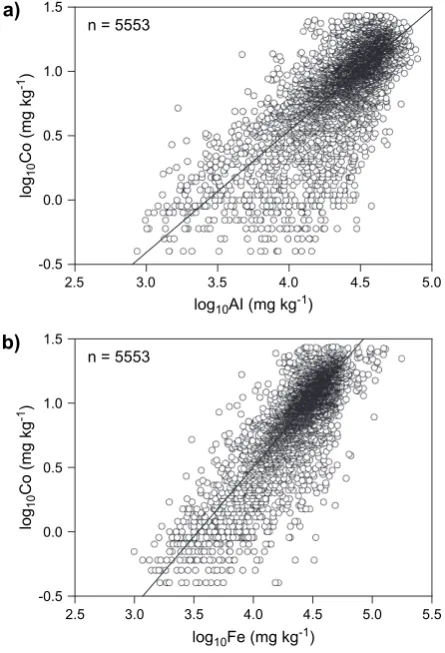
Coefficients for simple regressions between Co, Cr or Ni and Al or Fe are presented inTable 2. These regressions explained 53e72% of the variation in the trace metal concentrations,
which is considered to be satisfactory for such a large dataset.
Fig. 3 shows an example for the relationships between Co
and Al or Fe. Note that most of the data points actually lie in the dark areas close to the regression lines onFig. 3. The rela-tionships for Cr were better, and for Ni slightly poorer (graphs not shown) than for Co. Linear regression based on log10
-trans-formed data is appropriate because no non-linear trends were observed in the relationships (Fig. 3) and the distribution of residuals (not shown) is considered to be acceptable for such a large dataset. Regression with Al was better than with Fe for Cr; the opposite was true for Co and Ni (Table 2).
For all three trace metals, a multiple regression including both Al and Fe as independent variables improved the model fit, resulting in a decreased standard error of observation and increased the percentage of variance accounted for (R2adj)
to 71%, 85% and 62% for Co, Cr and Ni, respectively
-0.4 -0.2 0.0 0.2 0.4 0.6
-0.6 -0.4
-0.2 0.0
0.2 0.4
0.6
-0.4 -0.3 -0.2 -0.1 0.0 0.1 PCA3
PCA2
PCA1
Al Fe Mn K Mg Co Cr Ni Zn Cd Cu OC Pb pH Sr Ca P Ba Na
Fig. 2. Latent vector loadings for 19 variables used in principal component analysis. PCA 1, 2 and 3 accounts for 47.9, 14.4 and 10.8 of the total variance, respectively.
(Table 2). Therefore, we recommend that the multiple regres-sion equations be used in the prediction of ABCs of Co, Cr and Ni in topsoils.
The approach ofHamon et al. (2004)was slightly different. They removed the upper 5% data points which gave rise to the largest positive residuals from the regression line, and derived the line encompassing the upper 95th percentile of the data, which was then used to predict the background metal concen-trations. In this case, the predicted background concentrations are in fact the 95th percentile values, which would be
considerably larger than the mean values calculated from the regression equations presented inTable 2. One potential weak-ness in the approach ofHamon et al. (2004)is that the poorer the relationship between a trace metal and Fe or Al concentra-tions, the larger the predicted background concentration for the trace metal. Deriving a larger soil background because of a poor fit is not a conservative approach and may lead to under-protection of soil from metal pollution.
Similarly, Sterckeman et al. (2006) used the relationships between trace elements and Fe or Al concentrations in 52 sur-face soils developed from loess deposits in northern France to predict the ‘‘pedo-geochemical background concentrations’’ of the former. Regression equations were presented for a range of trace elements including As, Bi, Cu, Mo, Pb, Sb, Sn, Tl, V and Zn, although theR2values were low (<0.5) for several of them. It is arguable whether the values are true pedo-geochem-ical background concentrations, because the fractions of an-thropogenic-derived trace metals could not be excluded prior to the regression analysis. For this reason, as here, ambient background concentration (ABC) would be a more appropriate term.
3.3. ABCs of trace metals in soils according to texture group
The regression approach described above was not found to be appropriate for other trace metals like Cd, Cu, Pb and Zn, because of the lack of a close relationship with Al or Fe. Analysis of variance based on log-transformed data shows that both soil texture and major soil taxonomical group have a highly significant influence on the concentrations of the seven trace elements. Soil texture explains the variation in trace metal concentration better (percentage of variance ac-counted for 10.2e46.3%) than major soil taxonomical group
(3.6e21.9%) (Table 3). McGrath and Loveland (1992) and
Kabata-Pendias et al. (1992) showed that the distribution of
trace metals (Mn, Cr, Cu, Ni and Zn) among soil textural clas-ses is differentiated more strongly than among soil taxonomic units.Baize (1997)also found that the concentrations of eight trace elements differentiated strongly among soil texture
Table 2
Coefficients for regression equations relating Co, Cr or Ni to Al and/or Fe
Dependent variable (y) Independent variable (x) Regression coefficients n R2
adj SE of observation Constant Slope (x1) Slope (x2)
log10Co log10Al 3.150.048 0.930.011 5623 0.56 0.226
log10Fe 3.720.041 1.060.0094 5623 0.69 0.188
log10Al (x1), log10Fe(x2) 3.920.042 0.260.015 0.840.016 5623 0.71 0.183
log10Cr log10Al 2.370.025 0.890.0056 5653 0.82 0.121
log10Fe 2.200.031 0.850.0071 5653 0.72 0.149
log10Al (x1), log10Fe(x2) 2.640.024 0.630.0090 0.330.0092 5653 0.85 0.109
log10Ni log10Al 2.130.043 0.780.0099 5612 0.53 0.199
log10Fe 2.350.041 0.830.0094 5612 0.58 0.187
log10Al (x1), log10Fe(x2) 2.630.041 0.350.015 0.550.015 5612 0.62 0.179
Concentrations of all elements are in mg kg1.
n = 5553
2.5 3.0 3.5 4.0 4.5 5.0
log
10
Co (mg kg
-1)
log
10
Co (mg kg
-1)
log10AI (mg kg-1)
log10Fe (mg kg-1)
-0.5 0.0 0.5 1.0 1.5
n = 5553
2.5 3.0 3.5 4.0 4.5 5.0 5.5 -0.5
0.0 0.5 1.0 1.5
a)
b)
classes in 580 French soils. There is a clear tendency for metal concentrations to increase from light to heavy textured soils, particularly for Cd, Co, Cr, Cu, Ni and Zn.
ISO recommend that the ambient background of a substance in soils can be set at a chosen parameter from the frequency distribution of usual concentrations (International
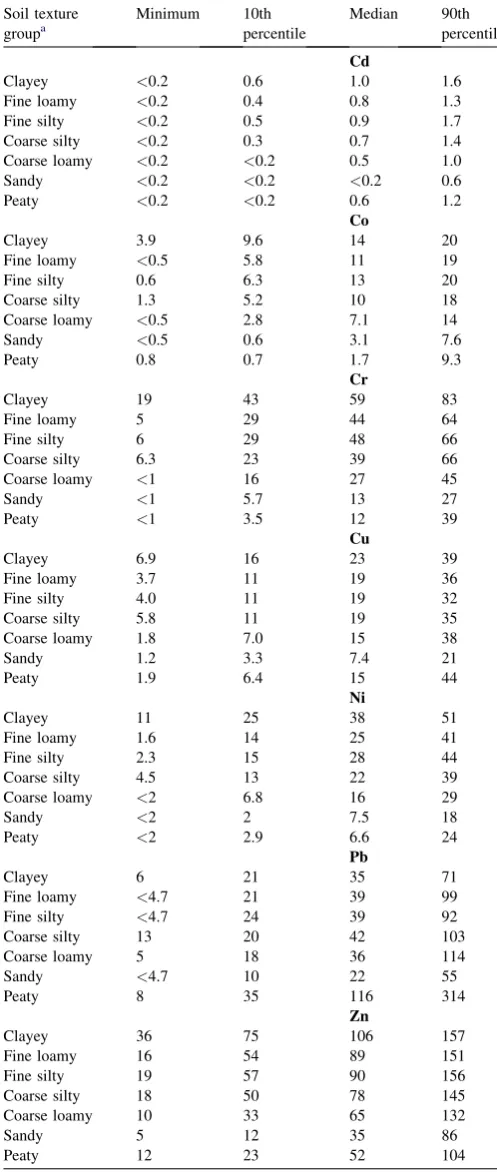
Organisa-tion for StandardisaOrganisa-tion (ISO), 2005).Table 4shows the range,
median, 10th and 90th percentile values for different soil texture groups. The median concentrations of Cd, Co, Cr, Cu, Ni and Zn differ by 3e5 fold between the clayey and
sandy texture groups, thus highlighting that soil texture is an important factor affecting trace metal concentrations. In the case of Pb, sandy and peaty soils have the lowest and highest median values, respectively, whereas the other texture groups show similar median values (Table 4). The median values for each soil texture group can be considered to represent the median ambient background concentrations (MABCs) of the group. This approach, although not perfect, represents a significant refinement in the way that it takes into account a key soil property that is easily measurable in a site investigation.
Alternatively, the ABC could be set at the 90th percentile value for each texture group (Table 4) (International
Organisa-tion for StandardisaOrganisa-tion (ISO), 2005). However, such values
can be considered as representing the upper limits of the ABC range for each soil texture group. It should be pointed out that, according to the European Technical Guidance Doc-ument for risk assessment (European Commission, 2003), the 90th percentile values are taken as the reasonable worst-case predicted environmental concentrations (PEC) (Heijerick
et al., 2006). Thus, ABCs set at the median values (i.e.
MABCs) would avoid potential confusion with the reasonable worst-case PEC.
3.4. ABC for Pb in soils derived from the probability graph approach
Fig. 4shows the cumulative frequency distributions for the
log-transformed concentrations of Pb. At the low Pb concentra-tions, the frequency distribution curve generally appeared to be linear, except for a very small proportion of data with the lowest concentrations that tended to lie off the straight line. The line-arity of the lower part of curve is consistent with a hypothesis
Table 3
Influence of soil texture and major taxonomical group on trace metal concentrations
Trace metal Soil texture Soil group
Cd 27.8 3.6
Co 43.2 20.8
Cr 46.3 21.9
Cu 10.2 3.6
Ni 40.3 19.7
Pb 17.4 10.2
Zn 20.0 6.7
The values are % of variance accounted for by soil texture or taxonomical group.
Table 4
Summary statistics of trace metal concentrations according to soil texture groups
Soil texture groupa
Minimum 10th percentile
Median 90th percentile
Cd
Clayey <0.2 0.6 1.0 1.6
Fine loamy <0.2 0.4 0.8 1.3
Fine silty <0.2 0.5 0.9 1.7
Coarse silty <0.2 0.3 0.7 1.4
Coarse loamy <0.2 <0.2 0.5 1.0 Sandy <0.2 <0.2 <0.2 0.6
Peaty <0.2 <0.2 0.6 1.2
Co
Clayey 3.9 9.6 14 20
Fine loamy <0.5 5.8 11 19
Fine silty 0.6 6.3 13 20
Coarse silty 1.3 5.2 10 18
Coarse loamy <0.5 2.8 7.1 14
Sandy <0.5 0.6 3.1 7.6
Peaty 0.8 0.7 1.7 9.3
Cr
Clayey 19 43 59 83
Fine loamy 5 29 44 64
Fine silty 6 29 48 66
Coarse silty 6.3 23 39 66
Coarse loamy <1 16 27 45
Sandy <1 5.7 13 27
Peaty <1 3.5 12 39
Cu
Clayey 6.9 16 23 39
Fine loamy 3.7 11 19 36
Fine silty 4.0 11 19 32
Coarse silty 5.8 11 19 35
Coarse loamy 1.8 7.0 15 38
Sandy 1.2 3.3 7.4 21
Peaty 1.9 6.4 15 44
Ni
Clayey 11 25 38 51
Fine loamy 1.6 14 25 41
Fine silty 2.3 15 28 44
Coarse silty 4.5 13 22 39
Coarse loamy <2 6.8 16 29
Sandy <2 2 7.5 18
Peaty <2 2.9 6.6 24
Pb
Clayey 6 21 35 71
Fine loamy <4.7 21 39 99
Fine silty <4.7 24 39 92
Coarse silty 13 20 42 103
Coarse loamy 5 18 36 114
Sandy <4.7 10 22 55
Peaty 8 35 116 314
Zn
Clayey 36 75 106 157
Fine loamy 16 54 89 151
Fine silty 19 57 90 156
Coarse silty 18 50 78 145
Coarse loamy 10 33 65 132
Sandy 5 12 35 86
Peaty 12 23 52 104
Concentrations of all elements are in mg kg1. a
Number of samples for different texture groups: clayey¼483, fine loamy¼2002, fine silty¼1061, coarse silty¼182, coarse loamy¼1141, sandy¼228, peaty¼557.
that the metal concentrations represent uncontaminated soils in which the frequency distribution is lognormal (Davies, 1983). The departure from linearity at the lowest level is likely to be due to the problem of metal concentrations being around or below the detection limit; this small portion of data can be ignored. The next step was to identify the % cumulative frequency at which the straight line changes into a complex curve, i.e. the inflexion point (indicated by an arrow in
Fig. 4). The inflexion point for Pb was at 30%, implying that
30% of all soil samples are from ‘‘contaminated’’ soils and 70% from ‘‘uncontaminated’’ soils. A new cumulative fre-quency distribution for the ‘‘uncontaminated’’ soils (F0) was then calculated asF0¼100(100F)(100/70), whereF
is the cumulative frequency for the original data (Sinclair, 1974). A new line was then plotted of the relationship between log10Pb andF0(Fig. 4), which represents the log-normal
distri-bution of the ‘‘uncontaminated’’ population. The mean log10Pb
value corresponds to 50% cumulative frequency on the new straight line and its antilog is the geometric mean (32 mg kg1 Pb) of the arithmetic data. This value agrees well with the range of 30e50 mg kg1 given by Davies (1983) who used much
smaller datasets for soils in England and Wales. The 10th and 90th percentile values of this population of ‘‘uncontaminated’’ soils can also be readily determined as17 and 63 mg kg1Pb.
However, the probability graph approach has several short-comings. First, it generates a single mean value and a single percentile range for the whole database, and thus ignores the possibility of ABC varying for different soil types. Sec-ond, the assumption that only the population representing the lowest metal concentrations is ‘‘uncontaminated’’ may be too simplistic. When the probability graph method was applied to the data for Cd, Co, Cr, Cu, Ni and Zn, the ‘‘uncon-taminated’’ population was overly represented by soils of light textures, suggesting that their relatively low concentra-tions are partly due to the effect of soil type (data not shown). Only in the case of Pb did the ‘‘uncontaminated’’ population consist of different texture groups in similar proportions to those in the whole dataset, except that peaty soils are
underrepresented, due to the elevated Pb concentrations in many upland peats referred to above. Therefore, use of the probability graph approach may be suitable for deriving a country-wide ABC for Pb, but not for other trace metals in this dataset. For Pb, the ABC obtained by the probability graph method (32 mg kg1) is similar to the median values of different soil texture groups except peaty and sandy soils
(Table 4).
3.5. Potential uses of ABCs
The regulation of metals in soils (and waters) for envi-ronmental protection is fraught with a number of significant problems, including issues of essentiality, bioavailability, toxicity and variability in background concentrations. The development and application of practical and robust methods to predict ABCs, and given appropriate databases, will enable the site-specific assessment of soils in a number of regulatory regimes at the national and international level. Examples include assessment of contaminated land (
Depart-ment of the EnvironDepart-ment Transport and the Region, 2000),
codes of good agricultural practice (Ministry of Agriculture
Fisheries and Food, 1993), pollution prevention and control
(European Commission, 1996) and the European Union Soil
Thematic Strategy (European Union Soil Thematic Strategy,
2002).
In terms of environmental risk assessment (European
Com-mission, 2003), it is important to note that the data available for
metal toxicity assessment for invertebrates, plants and soil microbes uses the ambient background soil concentrations as a ‘control’ to which metal doses are added in the testing proce-dure (e.g.Oorts et al., 2006b; Rooney et al., 2006). This ambi-ent background soil concambi-entration is often subtracted from the final calculated toxicity statistic to give a value without the inclusion of background metal. Thus, the toxicity ‘‘effect con-centrations’’ (e.g. EC10or EC50) are based on the added metals.
For site specific risk characterisation, the Predicted No Effect Concentrations (PNECs) which are derived through statistical processes from these data can, for example, be compared to a measured soil concentration at the site of interest (PEC) from which the predicted ABC has been subtracted (denoted PECadd). This subtraction of potentially confounding
back-ground concentrations of metal from the measured environmen-tal concentration enables a more appropriate comparison of PEC and PNEC values including the determination of a risk characterisation ratio (PECadd/PNECadd). This refinement is
the first step towards correcting the measured exposure concen-tration at the site to the exposure concenconcen-tration in the laboratory toxicity tests. A further adjustment, if necessary in a stepwise approach, would be an allowance for the ‘‘ageing’’ effect of metals over time after addition to soils in the field, which is a subject of active research presently (Lock and Janssen,
2003a,b; Oorts et al., 2006a).
Finally, by refining the measured soil concentration at the specific site and using appropriate PNECs, regulators can set single guideline values or standards for metals that would apply nationally.
Cumulative probability (%)
0.1 0.2 0.5 1 2 5 10 20 30 40 50 60 70 80 90 95 98 99 99.899.9
logP b
0.5 1.0 1.5 2.0 2.5 3.0 3.5 4.0
NSI data
Derived background population
Geomean = 32 ppm 90th percentile = 63 ppm
10th percentile = 17 ppm
4. Conclusions
The requirement to perform risk assessment of trace metals in soil is key to many regulatory regimes and environmental protection measures, and this requires prediction of site-spe-cific or soil type-spesite-spe-cific ABCs.
Analysis of the geochemical data for soils in England and Wales show a strong association between the trace metals Co, Cr and Ni and the major elements Al and Fe. Multiple regres-sions linking the log-transformed concentrations of Co, Cr or Ni with Al and Fe were obtained, which explained 62e85%
of the variation in the trace metal concentrations. Site-specific ABCs of Co, Cr or Ni in topsoils could be predicted reason-ably well from soil Al and Fe concentrations. There was no strong association between the trace metals Cd, Cu, Pb or Zn with Al and Fe, which is consistent with geochemical principles. Therefore, site-specific ABCs of these trace metals could not be predicted reliably using regressions with Al and/ or Fe.
Soil texture has a major influence on trace metal concen-trations, with heavy textured soils having higher concentra-tions of Cd, Co, Cr, Cu, Ni and Zn than light soils, and peaty soils having higher Pb concentrations than other soils. Median concentrations of trace metals were calculated for seven soil texture groups, and can be used as soil texture-specific ABCs.
A probability graph approach was used to identify an ‘‘uncontaminated’’ population of soils from the whole dataset. This approach yielded estimates of the geometric mean and the 10the90th percentile range of trace metals
that might be associated with the ‘‘uncontaminated’’ popula-tion in the region. However, this method may be appropriate only for Pb, because for other trace metals the ‘‘uncontami-nated’’ population was over-represented by soils with light textures.
Acknowledgements
We thank Rodger White for statistical advice. Rothamsted Research receives grant-aided support from the Biotechnology and Biological Sciences Research Council of the United King-dom. This work was funded by the Environment Agency under Science Project SC050054.
References
Avery, B.W., 1980. Soil Classification for England and Wales (higher cate-gories). Soil Survey Technical Monograph No. 14. Rothamsted Experi-mental Station, Harpenden, UK.
Baize, D., 1997. Teneurs totales en e´le´ments traces me´talliques dans les sols (France). INRA, Paris.
Baize, D., Sterckeman, T., 2001. Of the necessity of knowledge of the natural pedo-geochemical background content in the evaluation of the contamina-tion of soils by trace elements. Science of the Total Environment 264, 127e139.
Blaser, P., Zimmermann, S., Luster, J., Shotyk, W., 2000. Critical examination of trace element enrichments and depletions in soils: As, Cr, Cu, Ni, Pb, and Zn in Swiss forest soils. Science of the Total Environment 249, 257e280.
Cullen, A.C., Frey, H.C., 1999. Probabilistic Techniques in Exposure Assess-ment. A Handbook for Dealing with Variability and Uncertainty in Models and Inputs. Plenum, New York.
Davies, B.E., 1983. A graphical estimation of the normal lead content of some British soils. Geoderma 29, 67e75.
Department of the Environment Transport and the Region, 2000. Contami-nated Land: Implementation of Part IIA of the Environmental Protection Act 1990. DETR, London. DETR Circular 2/2000.
European Commission, 1996. Integrated Pollution Prevention and Control. Council Directive 96/61/EC. Official Journal of the European Communi-ties L 257, 26e40.
European Commission, 2003. Technical Guidance Document on Risk Assess-ment. European Commission Joint Research Centre, Ispra, Italy. European Union Soil Thematic Strategy, 2002. Towards a Thematic Strategy
for Soil. European Commission, Brussels. Commission of the European Communities, Com (2002) 179 Final.
Goldschmidt, V.M., 1954. Geochemistry. Clarendon Press, Oxford. Hamon, R.E., McLaughlin, M.J., Gilkes, R.J., Rate, A.W., Zarcinas, B.,
Robertson, A., Cozens, G., Radford, N., Bettenay, L., 2004. Geochemical indices allow estimation of heavy metal background concentrations in soils. Global Biogeochemical Cycles 18, GB1014.
Heijerick, D.G., van Sprang, P.A., van Hyfte, A.D., 2006. Ambient copper concentrations in agricultural and natural European soils: An overview. Environmental Toxicology and Chemistry 25, 858e864.
International Organisation for Standardisation (ISO), 2005. Soil quality: Guid-ance on the determination of background values. ISO 19258: 2005. Inter-national Organisation for Standardisation.
Kabata-Pendias, A., Dudka, S., Chlopecka, A., Gawinowska, T., 1992. Back-ground levels and environmental influences on trace metals in soils of the temperate humid zone of Europe. In: Adriano, D.C. (Ed.), Biogeochemis-try of Trace Metals. Lewis Publishers, Boca Raton, pp. 61e84. Lock, K., Janssen, C.R., 2003a. Influence of ageing on copper bioavailability
in soils. Environmental Toxicology and Chemistry 22, 1162e1166. Lock, K., Janssen, C.R., 2003b. Influence of ageing on zinc bioavailability in
soils. Environmental Pollution 126, 371e374.
McGrath, S.P., Cunliffe, C.H., 1985. A simplified method for the extraction of the metals Fe, Zn, Cu, Ni, Cd, Pb, Cr, Co and Mn from soils and sewage sludges. Journal of the Science of Food and Agriculture 36, 794e798. McGrath, S.P., Loveland, P.J., 1992. The Soil Geochemical Atlas of England
and Wales. Blackie Academic & Professional, London.
Ministry of Agriculture Fisheries and Food, 1993. Code of Good Agricultural Practice for the Protection of Soil, PB 0617. MAFF, London.
Oliver, M.A., Loveland, P.J., Frogbrook, Z.L., Webster, R., McGrath, S.P., 2002. Statistical and geostatistical analysis of the national soil inventory of England and Wales. National Soil Resources Institute, Cranfield Univer-sity, Silsoe, Bedford. Final Report to Department of Environment, Food and Rural AffairsdDEFRA.
Oorts, K., Bronckaers, H., Smolders, E., 2006a. Discrepancy of the microbial response to elevated copper between freshly spiked and long-term contam-inated soils. Environmental Toxicology and Chemistry 25, 845e853. Oorts, K., Ghesquie`re, U., Swinnen, K.E.S., 2006b. Soil properties affecting
the toxicity of CuCl2and NiCl2 for soil microbial processes in freshly spiked soils. Environmental Toxicology and Chemistry 25, 836e844. Palumbo, B., Angelone, M., Bellanca, A., Dazzi, C., Hauser, S., Neri, R.,
Wilson, J., 2000. Influence of inheritance and pedogenesis on heavy metal distribution in soils of Sicily, Italy. Geoderma 95, 247e266.
Rawlins, B.G., Webster, R., Lister, T.R., 2003. The influence of parent material on topsoil geochemistry in eastern England. Earth Surface Processes and Landforms 28, 1389e1409.
Reimann, C., de Caritat, P., 2005. Distinguishing between natural and anthropo-genic sources for elements in the environment: regional geochemical surveys versus enrichment factors. Science of the Total Environment 337, 91e107. Reimann, C., Filzmoser, P., 2000. Normal and lognormal data distribution in
geochemistry: death of a myth. Consequences for the statistical treatment of geochemical and environmental data. Environmental Geology 39, 1001e1014.
Reimann, C., Garrett, R.G., 2005. Geochemical backgrounddconcept and re-ality. Science of the Total Environment 350, 12e27.
Rooney, C.P., Zhao, F.J., McGrath, S.P., 2006. Soil factors controlling the expression of copper toxicity to plants in a wide range of European soils. Environmental Toxicology and Chemistry 25, 726e732.
Sinclair, A.J., 1974. Selection of threshold values for geochemical data using probability graphs. Journal of Geochemical Exploration 3, 129e149.
Sterckeman, T., Douay, F., Baize, D., Fourrier, H., Proix, N., Schvartz, C., Carignan, J., 2006. Trace element distributions in soils developed in loess deposits from northern France. European Journal of Soil Science 57, 392e410.