www.ijper.org
Simultaneous Determination of Sartans by
High Performance Liquid Chromatography
with Ultra Violet Detection
Vania Maslarska
1*, Vladimir Yankov
2, Danka Obreshkova
3, Stanislav Bozhanov
11
Department of Chemistry, Faculty of Pharmacy, Medical University-Sofia, BULGARIA.
2Pharmaceutical Company Berlin Chemie, BULGARIA.
3
Department of Pharmaceutical Chemistry, Faculty of Pharmacy, Medical University-Sofia, BULGARIA.
ABSTRACT
Objective:
A high performance liquid chromatographic method with ultra violet detection
for simultaneous analysis of three sartans (Valsartan, Irbesartan and Telmisartan) has
been developed for quality control.
Method and Results:
Isocratic elution on a LiChrospher
C18 column (250 × 4 mm, particle size 5 µm) at the temperature 30ºC with a mobile
phase consisting of 10mM phosphate buffer: acetonitrile (65:35 v/v) at a flow rate
1.0 ml/min has been done. The column eluent was monitored with a UV detector at 225 nm.
This allowed a rapid detection and identification as well as quantitation of the eluting
peaks.
Method Validation:
Calibration curves for all drugs were in the range of 5- 40 µg/ml
and the linear regression coefficients were more than 0.995. Recovery rates for the
sartans were in the range 96.5% to 103.1%. The limits of detection were calculated
between 0.04- 0.06 µg/ ml. Also, the limits of quantification were 0.12- 0.16 µg/ml.
Within-day and between-day coefficient of variation for all sartans at all concentrations
in the range of 0.83 - 3.79% was calculated.
Conclusion:
The procedure can provide a
simple, sensitive and fast method for the quality control of the three sartans in bulk and
tablets.
Key words:
Drug analysis, Sartans, HPLC, Quality control, Hypertension, Heart failure.
DOI: 10.5530/ijper.51.2.41 Correspondence:
Vania Maslarska,
Medical University – Sofia, Faculty of Pharmacy, Department of Chemistry, Dunav 2 st, Sofia 1000, BULGARIA.
phone no: +359 29236 522 E-mail: vmaslarska@mail.bg
INTRODUCTION
Nowadays hypertension is one of
the major
health problems worldwide. Angiotensin II
is an octapeptide with strong hypertensive
activity. It increases blood pressure as a result
of shrinking effect on smooth muscular
coat of vessels, releases aldosterone from
an adrenal cortex and catecholamine from
an adrenal medulla, which leads to retention
of sodium ions and water in human body
and an increase of circulating blood volume.
Angiotensin II receptor antagonists (ARA II)
selectively and specifically block the AT1
receptor of the renin angiotensin system by
displacing angiotensin II from it.
1Angio-tensin antagonists are a major innovation
for the treatment of hypertension and
heart failure either alone or together with
Submission Date: 30-08-2016;
Revision Date: 17-11-2016;
Accepted Date: 23-11-2016
diuretics or recently with other
antihyper-tensive drugs.
2Medicines modifying
renin-angiotensin system activity include: drugs
reducing renin release (β-adrenolytic drugs),
drugs blocking conversion of angiotensin I
to angiotensin II - ACE (angiotensin
conver-ting enzyme) inhibitors and angiotensin
receptor antagonists (ARB - angiotensin II
receptor blockers), also known as sartans.
They are better in preventing first occur
-rence of atrial fibrillation than beta-blocker
(atenolol) or calcium antagonist (amlodipine)
therapy.
formulations
3-7and biological material: plasma
5,8and
urine.
9It is normally determined by HPLC method with
C18 column and UV-VIS detector
3,6, mass spectrometry
(MS) detector
5or fluorescence detector.
4It is also
determined spectrophotometrically
9and with TLC.
10-12Telmisartan is determined in
human plasma,
13,14urine
15-19and binary tablets.
20,21It is determined by HPLC
analysis using C18 column
17,18,22with mass sensitive
detector,
23,24fluorescence
,
25UV
26,27or DAD
28,29detector. Telmisartan
is also determined simultaneously
with hydrochlorothiazide by a spectrophotometric,
densitometric and spectrofluorimetric analysis
.
30Irbesartan in a biological material: plasma and urine
31-35is
determined by an HPLC analysis with C18 column
and DAD
33,34, MS detector
35or
fluorescence detector
,
31Irbesartan and hydrochlorothiazide in tablets are
analyzed spectrophotometrically.
36But no analytical method has been reported yet for the
simultaneous separation of all the three drugs namely
Valsartan (VAL), Telmisartan (TEL) and Irbesartan
(IRB). There are reports to determine the ARB that use
solid phase extraction or other more complex time-
consuming processing of the samples.
That is why the aim of this research work was to
develop a simple, rapid, precise, accurate, and economical
RP-HPLC method, with a simple mobile phase for the
simultaneous separation, identification and determination
of the three compounds of the ARB group in bulk and
pharmaceutical formulations. The proposed method
was validated as per International Conference on
Harmonization (ICH Q2, 2005) guidelines.
37MATERIAL AND METHODS
Reagents and Chemicals
HPLC grade acetonitrile, methanol, potassium
dihy-drogen phosphate and orto-phosphoric acid (Analytical
grade) were obtained from Merck, Germany. Valsartan RS,
Irbesartan RS and Telmisartan RS were used as stan
-dards and were purchased from Sigma-Aldrich
(St. Louis, MO, USA).
Apparatus and analytical conditions
A Shimadzu HPLC system consisting of pump LC –
20 AD, vacuum degasser unit DGU – 20 A
5, column
oven CTO-10AD and a UV/VIS variable detector
SPD – 20 A was utilized for the analysis. The separation
under reversed phase partition chromatographic
conditions was carried out on a LiChrospher C18 column
(250×4 mm, particle size 5 µm). The equipment was
controlled by a PC with installed Lab Solution software.
The mobile phase was a 35:65 % v/v mixture of
acetonitrile:phosphate buffer (10 mM, pH 6 ± 0.1
,
adjusted with ortho-phosphoric acid). The flow rate
was 1.0 ml/min and the run time was 10 min. Before
analysis both the mobile phase and sample solutions
were degassed by the use of a sonicator and filtered
through a 0.45 μm filter. The column temperature was
maintained at 30
°C
and injection volume was 20 μl. The
detection of the drug was monitored at 225 nm. The
identity of the compounds was established by comparing
the retention times of compounds in the sample
solution with those in the standard solutions.
Preparation of Stock Standard Solutions of VAL,
IRB and TEL
Individual stock standard solutions of the three drugs
(200 µg/ml) were prepared by dissolving 10 mg of
each drug in 50 ml of solvent A (
methanol: water –
60:40). The methanol stock standards containing mixture
of VAL (I), IRB (II) and TEL (III) were prepared by
appropriately diluting the standard solutions in the
range of 5–40 µg/ml using solvent A.
Sample Preparation
From formulations containing Valsartan (80 mg),
Irbesartan (150 mg) and Telmisartan (80mg) was
prepared a mixture of sample solutions. Twenty tablets
of the three formulations were weighed, crushed
separately to a fine homogenous powder and their mean
mass was determined. Quantity equivalent to 80 mg of
each formulation was accurately weighed and taken
individually in a 20 ml volumetric flask. The powdered
mixtures were dissolved in the methanol. The contents
were sonicated for 15 min and the mixture was made up
to 20 ml with methanol. It was filtered through 0.45 mm
membrane syringe filter. The supernatants of the
solutions were taken, mixed thoroughly and diluted with
the solvent A. The final concentrations were 20 µg/ml
for VAL, IRB and TEL, respectively. For the HPLC
analysis was injected 20 µL of this solution and the peak
areas were measured for the determination of VAL,
IRB and TEL in tablet formulation.
Method Validation
The proposed method was validated under the estab
-lished optimal chromatographic conditions. The validation
as per ICH guidelines
37was carried out with respect to
specificity, linearity, intra-day and inter-day precision,
accuracy, and sensitivity (limit of quantitation (LOQ)
and limit of detection (LOD)).
Linearity
The calibration graphs were obtained by injecting a
into the HPLC system. The plotting mean chromato
-graphic peak area against the concentration of each
compound was made. Each solution was injected in
triplicate and the mean peak area value was observed
within the concentration range of 5 - 40 µg/ ml for all
sartans.
Precision
The system precision of the assays was investigated by
performing five replicate analyses of the added standard
samples at three different concentrations (10, 20 and
30 µg/ml) for each of the sartans on the same day and
on three separate days. They were evaluated by relative
standard deviations (RSD) of the peak areas of each
analyte.
Accuracy (recovery method)
The accuracy of HPLC method was tested by calculating
the recovery of certain amounts of each of the sartans
added separately at three different concentrations (10, 20
and 30 µg/ml) to samples representing the average
weight of the corresponding sartans concentrations.
The recoveries were also confirmed by determination
of these drugs in samples containing 50, 100 and 150 %
of sartans.
Limiting values
The limit of detection (LOD) was considered the lowest
concentration of the analytes corresponding to three
times the background noise or relationship
signal-to-noise ratio 3:1.
The limit of quantification (LOQ) was defined as the
lowest point of the calibration curve and fulfilled the
requirement of LOQ signal-to-noise ratio of 10:1.
37,38RESULTS AND DISCUSSION
Selection of Mobile phase
Different combinations of acetonitrile and phosphate
buffer were tested and the optimum condition at
acetonitrile-phosphate buffer 0.010 M (35:65 V/V) was
reached.
Effect of pH of mobile phase
We studied the effect of varying the pH (5.5 - 6.5).
Moreover, the stability of sartans is low in the alkaline
media. We found out that the best separation results
were achieved at pH 6.
Selection of flow rate and column temperature
Increasing of the column temperature from 25°C to
40°C led to a decrease in the total time required for the
separation process with decrease of peak broadening
and increase in sensitivity. The optimum column
temperature was at 30°C. Also, increasing the flow rate
from 1 ml/min to 1.5 ml/min showed a similar decrease in
the retention time. The optimum flow rate was 1.0 ml/min.
The obtained chromatogram of the selected sartans
with a rapid separation at different retention times is
shown in Figure 1. The proposed chromatographic
conditions indicate that the method is selective and
could be applied for simultaneous identification and
quantification of the sartans.
Method validation
Specificity and selectivity
The specificity of the HPLC method was established
by analyzing standard drug and sample solutions. The
retention times of VAL, IRB and TEL were confirmed
by comparing the retention time with that of the standard
(
Figure 1). The selectivity of the method there is no
interference between the matrix of blank sample and
the drug sample.
Linearity
The linear calibration curves for VAL, IRB and TEL
were constructed with five concentration levels each
under the experimental conditions described above.
The calibration curves of each drug substance were
subject to regression analysis to calculate the regression
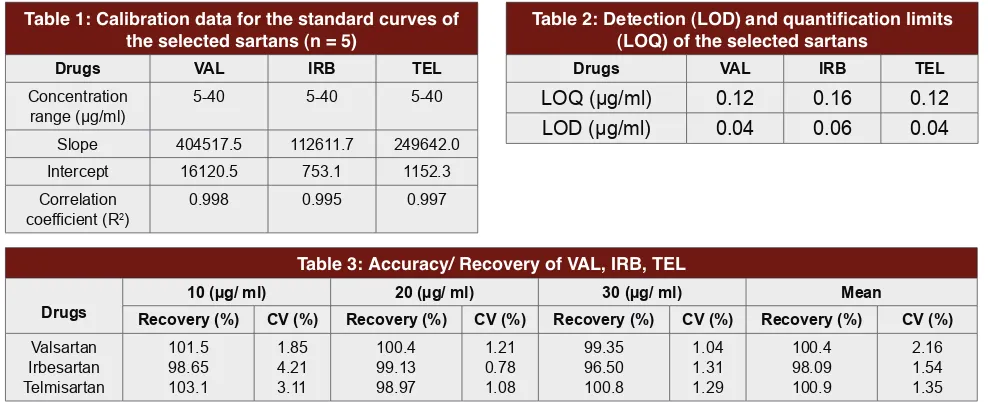
equations and the correlation coefficients. Table 1
shows the regression equations of the selected sartans.
In the regression equation; y = ax + b, “x” is for the
concentration of the standard sartans, ”y” is for the
peak area, “a” is the intercept of the straight line with
y-axis and “b” is the slope of the line. The R² in Table 1
refers to the correlation coefficient of the equation. All
the standard sartans showed good linearity (R² > 0.995)
in a relatively wide concentration range, adequate for
the analytical method. Calibration plot data slope (a),
intercept (b), and correlation coefficients (R
2) are given
in Table 1.
Figure 1: Chromatogram referring to the separation of
selected sartans. Peak 1: Valsartan (1.86 min), Peak 2:
Table 1: Calibration data for the standard curves of
the selected sartans (n = 5)
Drugs
VAL
IRB
TEL
Concentration
range (μg/ml)
5-40
5-40
5-40
Slope
404517.5
112611.7
249642.0
Intercept
16120.5
753.1
1152.3
Correlation
coefficient (R
2)
0.998
0.995
0.997
Table 2: Detection (LOD) and quantification limits
(LOQ) of the selected sartans
Drugs
VAL
IRB
TEL
LOQ (μg/ml)
0.12
0.16
0.12
LOD (μg/ml)
0.04
0.06
0.04
Table 3: Accuracy/ Recovery of VAL, IRB, TEL
Drugs
Recovery (%)
10 (µg/ ml)
CV (%)
Recovery (%)
20 (µg/ ml)
CV (%)
Recovery (%)
30 (µg/ ml)
CV (%)
Recovery (%)
Mean
CV (%)
Valsartan
Irbesartan
Telmisartan
101.5
98.65
103.1
1.85
4.21
3.11
100.4
99.13
98.97
1.21
0.78
1.08
99.35
96.50
100.8
1.04
1.31
1.29
100.4
98.09
100.9
2.16
1.54
1.35
Table 4: Intra-day and inter-day variations of the HPLC method for determination of the selected sartans
Added concentration
(µg/ml)
Intra-day
Inter-day
Measured
concentration
(µg/ml)
Accuracy
(SE %)
*Precision
(CV %)
concentration
Measured
(µg/ml)
Accuracy
(SE %)
*Precision
(CV %)
Valsartan
10
20
30
9.89±0.077
20.08±0.05
29.85±0.079
-1.1
0.40
-0.50
1.69
1.84
0.83
10.29±0.032
20.18±0.049
30.65±0.112
2.9
0.9
2.17
2.09
1.98
2.04
Irbesartan
10
20
30
9.79±0.077
20.18±0.05
29.95±0.079
-2.1
0.90
-0.17
1.39
1.04
0.83
10.19±0.022
20.08±0.191
30.15±0.128
1.9
0.4
0.5
2.69
1.78
1.48
Telmisartan
10
20
30
10.09±0.027
20.08±0.04
30.05±0.039
0.90
0.40
0.17
1.99
1.72
0.93
10.29±0.022
20.12±0.191
30.25±0.128
2.9
0.6
0.83
3.79
1.38
0.88
* SE = 100 × (measured concentration - added concentration) / added concentration
Limits of quantitation and Limits of detection
The determined values of LOD and LOQ for the
selected sartans in the proposed method are shown in
Table 2. In this method, LOD for VAL and TEL was
0.04 µg/ml and for IRB was 0.06µg/ ml. LOQ for VAL
and TEL was 0.12 µg/ml and for IRB was 0.16 µg/ ml.
Accuracy /Recovery
Accuracy of the proposed method was determined
using recovery studies. The recovery study results of
the selected sartans ranged from 96.5% to 103.1% using
solution of sample preparation. The coefficients of
variation for this technique were lower than 5 %. Results
are reported in Table 3.
Precision
The precision of the quantitative method is the degree
of agreement among the individual test results, of the
repeated procedure to multiple samplings. It is measured
by repeatedly injecting a ready-made sample and is
expressed as coefficient of variation of the results.
Within-day (n = 5) and between-day (n = 3) precision
presented coefficients of variation and relative errors
lower than 5%. These results are presented in Table 4.
CONCLUSION
A simple isocratic RP-HPLC method with UV detection
has been developed for simultaneous determination
of VAL, TEL and IRB. The method was validated for
accuracy, precision, specificity and linearity. The run
time was relatively short (10 min), which enabled rapid
quantification of many samples in routine and quality
control analysis of tablets. It is suitable for analysis of
antihypertensive agents in their formulations in a single
most available apparatus and is a low cost instrument in
comparison with HPLC coupling with mass
spectros-copy and capillary electrophoresis.
ACKNOWLEDGMENT
The authors are thankful to Faculty of Pharmacy, Medi
-cal University-Sofia, Bulgaria for providing lab facilities.
CONFLICT OF INTEREST
Authors have no conflicts of interest to declare.
ABBREVIATIONS USED
ARA II:
angiotensin II receptor antagonist;
ACE:
Angiotensin converting enzyme;
ARB:
Angiotensin
II receptor blocker;
HPLC:
High performance liquid
chromatography;
UV:
ultraviolet;
MS:
Mass
spectrom-etry;
TLC:
Thin layer chromatography;
DAD:
Diode
array detector;
VAL:
Valsartan;
IRB:
Irbesartan;
TEL:
Telmisartan;
ICH:
International Conference on
Har-monization;
LOQ:
Limit of quantitation;
LOD:
Limit
of detection;
RSD:
Relative standard deviation.
REFERENCES
1. Gonzalez L, Lopez JA, Alonso RM, Jimenez RM. Fast screening method for the determination of angiotensin II receptor antagonists in human plasma by high performance liquid chromatography with fluorimetric detection. J Chromatogr A. 2002;949(1):49-60. https://doi.org/10.1016/S0021-9673(01)01496-0.
2. Ferreirósa N, Iriartea G, Alonso RM, Jiméneza RM. Development of a solid phase extraction procedure for HPLC–DAD determination of several angiotensin II receptor antagonists in human urine using mixture design. Talanta. 2007;73(4):748-56. https://doi.org/10.1016/j.talanta.2007.04.062 PMid:19073097.
3. Maslarska V, Peikova L, Tsvetkova B. Method Development and Validation of Valsartan and Hydrochlorothiazide in Pharmaceutical Dosage Form. Int J Pharm Bio Sci. 2014;5:205-11.
4. Rosario BM, Contreras Y, Clavijo S, Torres D, Delgado Y, Ovalles F et al,
Gallignani M, Estela JM, Martin VC. Determination of losartan, telmisartan, and valsartan by direct injection of human urine into a column-switching liquid chromatographic system with fluorescence detection. J Pharm Biomed Anal. 2009;50(2):194-99. https://doi.org/10.1016/j.jpba.2009.04.015 PMid:19446420.
5. Koseki N, Kawashita H, Hara H, Niina M, Tanaka M, Kawai R, et al. Development and validation of a method for quantitative determination of valsartan in human plasma by liquid chromatography-tandem mass spectrometry. J Pharm Biomed Anal. 2007;43(5):1769-74. https://doi. org/10.1016/j.jpba.2006.12.030 PMid:17289324.
6. Ferreiros N, Iriarte G, Alonso RM, Jimenez RM, Ortiz E. Separation and quantification of several angiotensin II receptor antagonist drugs in human urine by a SPE-HPLC-DAD method. J Sep Sci. 2008;31(4):667-76. https:// doi.org/10.1002/jssc.200700442 PMid:18307163.
7. Krishnaiah C, Raghupathi RA, Kumar R, Mukkanti K. Stability-indicating UPLC method for determination of Valsartan and their degradation products in active pharmaceutical ingredient and pharmaceutical dosage forms. J Pharm and Biomed Anal. 2010;53(3):483-89. https://doi.org/10.1016/j. jpba.2010.05.022. PMid:20646890.
8. Zarghi A, Shafaati A, Foroutan SM, Movahed H. Rapid Quantification of Valsartan in Human Plasma by Liquid Chromatography using a Monolithic
Column and a Fluorescence Detection: Application for Pharmacokinetic Studies. Sci Pharm. 2008;76:439-50. https://doi.org/10.3797/scipharm.0808-01. 9. Cagigal E, González L, Alonso RM, Jiménez RM. Experimental design
methodologies to optimise the spectrofluorimetric determination of Losartan and Valsartan in human urine. Talanta. 2001;54(6):1121-33. https://doi. org/10.1016/S0039-9140(01)00379-4.
10. Tsvetkova D, Obreshkova D, Ognjanov S. Validation of TLC densitometry for simultaneous quality and quantity analysis of angiotensin II receptor antagonists Losartan, Telmisartan and Valsartan. Compt Rend Acad Bulg Sci. 2011;64(1):39-44.
11. Tsvetkova D, Obreshkova D. Application of validated ТLC – densitometric method for simultaneous identification and determination of Losartan Potassium, Telmisartan and Valsartan in tablets. J Planar Chromatogr – Modern TLC. 2012;25(4):326-30. https://doi.org/10.1556/JPC.25.2012.4.8. 12. Tsvetkova D, Obreshkova D, Petkova V, Pankova St, Atanasov P, Kasnakova P.
Simultaneous determination of Valsartan and Hydrochlorothiazide in tablets by thin-layer chromatography-densitometric method. World J Pharm Pharm Sci. 2015;4:1-11.
13. Salama I. Simultaneous HPLC–UV analysis of telmisartan and hydrochlorothiazide in human plasma. Bull Fac Pharm, Cairo University. 2011;49(1):19-24. https://doi.org/10.1016/j.bfopcu.2011.07.005.
14. Babu Ravi VB, Inamadugu JK, Pilli NR, Sreenivasulu V, Ponneri V.
Simultaneous determination of telmisartan and amlodipine in human plasma
by LC–MS/MS and its application in a human pharmacokinetic study. J Pharm Anal. 2012;5:319-26. https://doi.org/10.1016/j.jpha.2012.03.008. 15. Virkar PS, Pingale SG, Mangaonkar KV. Development and Validation of a
High Performance Liquid Chromatography Method for Determination of Telmisartan in Rabbit Plasma and its Application to a Pharmacokinetic Study. J Anal Bioanal Techn. 2012;3:2-5. https://doi.org/10.4172/2155-9872.1000133.
16. Kumbhar TS, Chougule GK, Gajeli GB, Tegeli VS, Thorat YS, Shivsharan US. Visible Spectrophotometric determination of Telmisartan from urine. Int J Pharm Sci Res. 2011;2(5):1254-58.
17. Elshanawane AA , Abdelaziz LM , Kamal MM, Hafez HM. Quantitative determination of Telmisartan, Ramipril, Amlodipine Besylate, and Atorvastatin Calcium by HPLC. J Liq Chrom Rel Techn. 2014;37(2):195-206. https://doi.or g/10.1080/10826076.2012.738622.
18. Patel N, Patel JK. Analytical Methodologies for Determination of Telmisartan: An Overview. Int J Pharm Pharm Sci. 2013;5(1):17-22.
19. Nie J, Zhang M, Fan Y, Wen Y, Xiang B. Biocompatible in-tube solid-phase microextraction coupled to HPLC for the determination of angiotensin II receptor antagonists in human plasma and urine. J Chromatogr B Analyt Technol Biomed Life Sci. 2005;828(1):62-9. https://doi.org/10.1016/j. jchromb.2005.09.015 PMid:16203184.
20. Yankov V, Tsvetkova D, Obreshkova D, Ivanova S, Petkova V. Recent
applications of spectrophotometric and thin layer chromatographic
methods for quality control of fixed dosage combinations of sartans with Hydrochlorthiazide. World J Pharm Pharm Sci. 2016;5:18-43.
21. Tsvetkova D, Obreshkova D, Ivanova S, Yankov V, Atanasov P. Quality
control of impurities and comparison of pharmacokinetic parameters
of angiotensin receptor antagonists. J Multidiscipl Eng Sci Stud. 2016; 2:647-61.
22. Feng Y, Yan Y, Yin Q, Liu L, Shi A. Studies on plasma level determination of telmisartan by HPLC. Yaowu Fenxi Zazhi. 2005;25(6):618-20.
23. Wu J, Feng F, Jiang J, Tian Y. Determination of telmisartan in human plasma by HPLC-MS and study of its pharmacokinetics. Zhongguo Yaoke Daxue Xuebao. 2004;35:545-48.
24. Zhang H, Fang Y. HPLC/APCI-MS Determination of telmisartan in Human Plasma. Yaowu Fenxi Zazhi. 2004;24(5):497-99.
25. Kuang R, Zhang H, Xiong Y. HPLC determination with fluorescent detection of telmisartan concentration in plasma and its application. Yaowu Fenxi Zazhi. 2005;25(6):629-32.
26. Tsvetkova D, Obreshkova D, Ivanova S, Yankov V, Atanasov P, Hadjieva B. Telmisartan quality control by validation of UV-spectrophotometric method. Int J Innov Res Med Sci. 2016;1:113-23.
B Analyt Technol Biomed Life Sci. 2009;877(29):3729-33. https://doi. org/10.1016/j.jchromb.2009.08.028 PMid:19744898.
28. Nie J, Zhang M, Fan Y, Wen Y, Xiang B. Biocompatible in-tube solid-phase microextraction coupled to HPLC for the determination of angiotensin II receptor antagonists in human plasma and urine. J Chromatogr B Analyt Technol Biomed Life Sci. 2005;828(1):62-9. https://doi.org/10.1016/j. jchromb.2005.09.015 PMid:16203184.
29. Richards MP, Kumar DB, Mohammad Y, Reddy K, Siddhartha B. Simultaneous Estimation of Telmisartan and Amlodipine Besylate in Pharmaceutical Dosage Form By RP – HPLC. Int J Pharma. 2011;1(2):105-9.
30. Yan T, Li H, Deng L, Guo Y, Yu W. Liquid chromatographic-tandem mass spectrometric method for the simultaneous quantitation of telmisartan and hydrochlorothiazide in human plasma. J Pharm Biomed Anal. 2008;48(4):1225-29. https://doi.org/10.1016/j.jpba.2008.08.021 PMid:18838240.
31. Bae SK, Kim MJ, Shim EJ and Shin JG. HPLC determination of Irbesartan in human plasma: its application to pharmacokinetic studies. Biomed Chrom. 2009;23(6):568-72. https://doi.org/10.1002/bmc.1154 PMid:19277953.
32. Praveen KM. Development and validation of a stability indicating RP-HPLC method for assay of Irbesartan in pure pharmaceutical dosage. Int J Pharm Sci Chem Rev Res. 2011;6(1):100-4.
33. Ashok KS. Simultaneous determination of Irbesartan and Hydrochlorothiazide in human plasma by liquid chromatography. J Chromatogr B. 2003;784(1): 195-201. https://doi.org/10.1016/S1570-0232(02)00759-6.
34. Sultana N, Arayne MS, Ali SS, Sajid S. Simultaneous determination of Olmesartan Medoxomil and Irbesartan and Hydrochlorothiazide in
pharmaceutical formulations and human serum using high performance
liquid chromatography. Chinese J Chromatogr. 2008;26(5):544-49. https:// doi.org/10.1016/S1872-2059(08)60029-2.
35. Ganesan M. Method development and validation of Irbesartan using LCMS/ MS: Application to pharmacokinetic studies. J Chem Pharm Res. 2010;2:740-46. 36. Rani GT, Shankar DG, Shireesha M, Satyanarayana B. Spectrophotometric
method for determination of Angiotensin –II Receptor Antagonist in bulk and pharmaceutical dosage forms. Int J Pharm Pharm Sci. 2012;4:198-202. 37. ICH Q2B, International Conference on Harmonisation, Validation of Analytical
Procedures. Methodology, 2005.
38. United States Pharmacopoeia 29. National Formulary 24, United States Pharmacopoeial Convention, Rockville 2006.