High yielding biomass genotypes of willow
(
Salix
spp.) show differences in below ground
biomass allocation
Jennifer Cunniff
a,*, Sarah J. Purdy
b, Tim J.P. Barraclough
a,
March Castle
a, Anne L. Maddison
b, Laurence E. Jones
b, Ian F. Shield
a,
Andrew S. Gregory
c, Angela Karp
aaAgroecology Department, Rothamsted Research, Harpenden, Hertfordshire, AL5 2JQ, UK
bInstitute of Biological, Environmental and Rural Sciences (IBERS), Aberystwyth University, Gogerddan,
Aberystwyth, Ceredigion, SY23 3EE, UK
cSustainable Soils and Grassland Systems Department, Rothamsted Research, Harpenden, Hertfordshire, AL5 2JQ,
UK
a r t i c l e i n f o
Article history:
Received 16 December 2014 Received in revised form 21 April 2015
Accepted 22 April 2015 Available online 20 May 2015
Keywords: Willow Biomass Genotypes Roots Allocation
Carbon accumulation
a b s t r a c t
Willows (Salixspp.) grown as short rotation coppice (SRC) are viewed as a sustainable
source of biomass with a positive greenhouse gas (GHG) balance due to their potential to fix and accumulate carbon (C) below ground. However, exploiting this potential has been limited by the paucity of data available on below ground biomass allocation and the extent to which it varies between genotypes. Furthermore, it is likely that allocation can be altered considerably by environment. To investigate the role of genotype and environment on allocation, four willow genotypes were grown at two replicated field sites in southeast England and west Wales, UK. Above and below ground biomass was intensively measured over two two-year rotations. Significant genotypic differences in biomass allocation were identified, with below ground allocation differing by up to 10% between genotypes. Importantly, the genotype with the highest below ground biomass also had the highest above ground yield. Furthermore, leaf area was found to be a good predictor of below ground biomass. Growth environment significantly impacted allocation; the willow geno-types grown in west Wales had up to 94% more biomass below ground by the end of the second rotation. A single investigation into fine roots showed the same pattern with double the volume of fine roots present. This greater below ground allocation may be attributed primarily to higher wind speeds, plus differences in humidity and soil characteristics. These results demonstrate that the capacity exists to breed plants with both high yields and high potential for C accumulation.
©2015 The Authors. Published by Elsevier Ltd. This is an open access article under the CC
BY license (http://creativecommons.org/licenses/by/4.0/).
*Corresponding author. Tel.:þ44 (0)1582 763133.
E-mail address:[email protected](J. Cunniff).
Available online at
www.sciencedirect.com
ScienceDirect
http://www.elsevier.com/locate/biombioe
http://dx.doi.org/10.1016/j.biombioe.2015.04.020
0961-9534/©2015 The Authors. Published by Elsevier Ltd. This is an open access article under the CC BY license (http://creativecommons.
1.
Introduction
Willows (Salixspp.) grown as short rotation coppice (SRC), are
being developed as sources of biomass for the production of bioenergy, biofuels and high value products for the chemical industries especially across Europe, north-eastern and
mid-western USA and Canada [1e4]. Advantages of using SRC
willow for biomass production include fast growth and high biomass production, ability to re-sprout after multiple har-vests, ease of vegetative propagation from dormant woody cuttings, a wide genetic base for breeding and a positive
greenhouse gas (GHG) balance[1,4e6].
Willow is a perennial shrub with an extensive below ground root system, which increases in size as the plant ages
[7,8]. The root system stores essential carbohydrate reserves needed primarily for respiration and growth, and, to a lesser
extent, symbiotic associations and exudation [9,10].
Mobi-lisation of carbohydrate reserves in the roots and cut stump are particularly important for re-sprouting of shoots after
coppicing[9,11e14].
Estimates of below ground biomass production and the allocation of total plant biomass to above and below ground pools in willow are limited as roots are notoriously difficult and time consuming to sample. Studies are generally restricted to a small number of genotypes sampled at a few points during growth, often on roots and shoots of different
ages which makes comparisons problematic. Rytter [15]
studied roots of 1e3 year old plants ofSalix viminalis(a
pop-ular species for biomass) in lysimeters. Annual net primary productivity of root biomass increased from 1 to 3 years, but the actual allocation below ground declined each year from
25e30% to 10e12% of total biomass in 1- and 3-year old plants,
respectively. Both values increased markedly if fine root
turnover was included in the estimate. Matthews [8]
measured root biomass of two S. viminalis varieties,
sam-pling five single plants from two sites, four Bowles hybrid from one site and a single Gigantea variety from the second site.
The age of the individualS. viminalisstools varied from 4 to 22
years old and the shoots were of 1e3 years in age dependent
on the date of the last coppice. From these limited data it was estimated that investment below ground increased from 10 to
25 odt ha1over 25 years, and in contrast to Rytter[15]the
allocation of total plant biomass to below ground also
increased marginally. Weih and Nordh[16]predicted the root
biomass allocation for six three-year old willow varieties grown in field trials in central and southeast Sweden and revealed significant variety variation in below ground biomass
allocation of 10e20% of the total plant biomass[16]. Pacaldo
et al.[7]looked at root volumes in a single willow genotype of
5, 12, 14 and 19 years of age, planted in the field across three locations. Below ground biomass increased with plant age, up until 14 years. However, the allocation of total plant biomass to the roots showed no difference with age.
Knowledge of below ground biomass in perennial crops such as willow is important for understanding the GHG bal-ance of bioenergy systems, as the roots have considerable potential to contribute towards the carbon (C) sequestration
potential of the crop[17e21]. Previous life cycle assessments
(LCA) of willow have relied upon limited below ground data to
estimate C sequestration into root systems[8,22]and although
a few more detailed data sets now exist[7,18]considerable
investigation is still needed to recognise the potential for the capture of C into this important biomass pool, as well as the surrounding soil.
Within all plants there exists a functional equilibrium of biomass, where additional biomass is allocated to an organ to
take up the resource that is most limiting growth[23e25]. An
understanding of these principles is founded in plant ecology, but they have many applications in agricultural research as allocation sets limits on biomass production and utilisation
[24]. Allocation patterns can be affected by numerous
envi-ronmental factors to varying extents including: light,
nutri-ents, water, elevated atmospheric CO2,temperature, salinity
and mechanical perturbation, and have been reviewed by numerous authors using a plethora of data from
environ-mental manipulation studies [e.g.[24e27]].
As roots are notoriously hard to sample it would be useful to predict root biomass from other growth traits which are easier to measure. Previously, leaf area (and the closely related leaf area index, LAI) have been demonstrated to be closely correlated to above ground biomass in poplar [e.g.
[28e30]]. Weih and Nordh[16]demonstrated the same
rela-tionship in willow, showing leaf area from pot experiments to be a good predictor of biomass production in the field.
Sup-porting this, Andralojc et al.[31]showed that total leaf area
and above ground biomass were closely correlated in a diverse set of 11 willow genotypes. Fewer studies have considered the
belowground biomass. Bouman and Sylliboy [32]
demon-strated a positive correlation between root biomass and leaf
area in 12 willow varieties, and Weih and Bussel[33]showed a
positive relationship with above ground biomass. However, an inverse relationship between leaf area and below ground
biomass has also been reported[16,34].
To understand how allocation patterns vary, we studied above and below ground biomass in a set of four diverse high yielding willow genotypes established in two replicated trials in contrasting climates in the UK. Repeated above and below ground biomass harvests were conducted over two successive short rotation cycles to test the following hypotheses:
1. Diverse willow genotypes will differ in below ground biomass production and allocation.
2. The below ground biomass can be predicted from re-lationships with other growth traits such as leaf area. 3. Below ground biomass allocation will be altered by the
growth conditions (climate and soil).
2.
Materials and methods
2.1. Plant material and field trials
Four genotypes of willow were selected for the study; for their
individual pedigrees seeTable 1. All genotypes are the results
of Swedish and UK breeding programmes, currently only
Endurance is not yet a registered variety[35]. The genotypes
were chosen because they produced good yields when tested
1). However, they differ strongly in morphology e.g. leaf area index (LAI), stem number and canopy height, suggesting they achieve the high yields via diverse routes. Peak LAI was recorded in July 2011 using a SunScan Canopy Analysis sys-tem, type SS1 (Delta-T Devices Ltd., Cambridge, UK). Canopy height and stem number are shown for end of the growing season (October 2011). Canopy height was measured from the soil surface to the tip of the tallest stem using a telescopic measuring pole (Senshin Industry Co., LTD, Osaka, Japan
538e0041) (Table 1).
Two identical field trials were established in the UK at Rothamsted Research, Harpenden, southeast England (51.82
N, 0.38W) and the Institute of Biological, Environmental and
Rural Sciences (IBERS), Aberystwyth, west Wales (52.41 N,
4.01 W) during May 2009 as part of the BBSRC Sustainable
Bioenergy Centre [36]. Each trial was a randomised block
design, containing four blocks with one plot of each willow
genotype per block. The plots measured 26.4 8.5 m and
contained 374 plants in 11 double rows, equating to a planting
density of 16, 667 plants ha1which is marginally higher than
the industry recommendations of 15,000 plants ha1[37]. The
plots had spacing's of 0.5 m between the plants in the rows
and 0.8 m between the narrow rows and 1.6 m between the wide rows. The willows were planted as 20 cm cuttings in March 2009 using material harvested from mature willow stands in January 2009. Endurance and Tora were sourced from trials at Rothamsted Research, whilst Resolution and Terra Nova were supplied by Murray Carter Ltd (Ingerthorpe Hall Farm, Markington, Harrogate, North Yorkshire, HG3 3PD). Within each willow plot, a double row was designated to non-destructive measurements and yield determination whilst the remainder of the plot was assigned to destructive sampling and guard plants. The trial was designed such that each pair of plants designated for destructive sampling and the outer edge of every plot was surrounded by guard plants of the same genotype. This arrangement ensured that the excavations of
trees from the destructive sampling area didn't influence the
growth of nearby trees used for destructive measurements at a later date or the growth of trees used for yield determination and collection of non-destructive trait data.
The soil at the Harpenden site is a silty clay loam (sand
13%, silt 62% and clay 25%[38]) whilst at the Aberystwyth site,
the soil is a sandy silt loam (sand 41%, silt 51%, and clay 8%; unpublished data). The average bulk densities of the top 30 cm
of the soils are 1.48 ± 0.03 g/cm3 at Harpenden and
1.09±0.04 g/cm3at Aberystwyth. The volumetric water
con-tent of the soils at saturation are 38% and 43%, the water released through natural drainage is 6.9% and 7.4% and the plant available water is 8.3% and 13.6% for the Harpenden and Aberystwyth sites respectively. Previous to the establishment of the BSBEC trials the Harpenden site was planted with wheat, whilst the Aberystwyth site was under grassland. These different land uses are reflected in the soil organic C
content which is 1.3 ± 0.04% at Harpenden and 3.9 ± 0.1% at
Aberystwyth. Both sites were ploughed before the willow was planted. During winter 2010 the stools were coppiced to pro-mote increased shoot production per stool. Ammonium
ni-trate was applied at a rate of 60 kg N ha1during spring 2010
and herbicide (Weedzol-TL) was applied at a rate of 20 l ha1to
suppress weeds; weeds were further controlled by mowing
between the rows throughout the season. Stand survival was
excellent at both locations with only 0e4% losses per plot.
2.2. Climatic measurements
Meteorological conditions were monitored using specially installed weather stations on each trial (Campbell, Scientific Ltd, Loughborough, UK). Each was fitted with a CR1000 data logger, an AM25T multiplexer and sensors to record air tem-perature and humidity at 150 cm above the soil surface. Soil moisture content and soil temperature was monitored at depths of 10, 30 and 60 cm, but only data from the 10 cm sensors are presented here as the same trends between sites were evident at each depth. In addition, at Aberystwyth, sensors were installed to record incoming photosynthetically active radiation (PAR), rainfall, and wind speed. At Harpenden these variables were obtained from the electronic Rothamsted Archive (e-RA) which holds hourly data from the central Rothamsted meteorological site (Rothmet) located 1.7 km from the BSBEC trial across flat ground. At the dedicated weather stations sensors were triggered to take measure-ments every 15 min and hourly values were returned. For
volumetric water content (q), soil temperature and relative
humidity monthly mean values were calculated as the average of daily means over each month. The maximum and minimum air temperatures were obtained from the absolute maximum and minimum temperatures for each day, aver-aged over each month. Wind run is the hourly average wind
speed (m s1) converted to km hr1and summed to give daily
wind run (km day1).
2.3. Total harvestable yield
The willow plots were harvested on a two year rotation after a 1st year cut back in 2010, followed by yield harvests during January 2012 and January 2014 when the crop was dormant. Within each plot all stems from the 26 plants in the designated yield double row were cut. The stems were weighed, then chipped and a subsample collected, weighed, and oven-dried
at 80C to a constant weight. The dry weight of the chipped
sample was used to calculate the yield per plot of the har-vested double row which was then scaled up to tonnes of dry
matter per hectare per year (t DM ha1yr1).
2.4. Above and below ground biomass measurements
Throughout the two rotations the above and below ground biomass was determined in the destructive measurements area of the plot which is separate from the area used to
measure the total harvestable yield (section 2.3). Fifteen
measurements of the above and below ground biomass occurred over the two rotations with 11 harvests during the
first rotation and four during the second (Table S1). The
har-vests were co-ordinated with particular plant phenological
stages, especially during the 2011 season (Table S1). A pair of
neighbouring plants (two plants) from a double row were randomly selected from the designated destructive sampling area in each plot. All stems were cut at 10 cm from the soil surface and (if present) leaves were separated. The stems were weighed, then chipped and a subsample collected, weighed,
and oven-dried at 80C to a constant weight. At the
destruc-tive samplings when plants were in leaf (10 occasions), the total leaf area per plant was calculated by scanning a repre-sentative subsample using a WinDias Image analysis system (WD3, Delta-T-Devices, Cambridge, UK). The subsample and
remaining leaves were oven-dried at 80 C to a constant
weight and total leaf area (LAtotal) was calculated as:
LAtotal¼
LAsub
LDWsub
LDWtotal
whereLAsubis the subsample leaf area (cm2),LDWsubthe leaf
subsample dry weight (g) andLDWtotalthe dry weight (g) of all
the leaves.
To sample the below ground biomass a quadrat of
50120 cm was placed around each of the cut plants so that
half of the gap to neighbouring plants fell within it. The quadrat area was derived from the area dedicated to each individual plant in the plot. It was considered that neigh-bouring plants may root in that area just as the individual planted there may root outside of the area. The whole area was excavated to a depth of 30 cm to recover the greater part of the below ground biomass. Previous work has shown that
80e85% [39]and up to 92%[7] of below ground biomass is
located within in the upper 30 cm of the soil profile. After excavation the below ground biomass was separated into the below ground stool, above ground stool, coarse roots and fine roots. The below ground stool refers to the initial stem cutting planted in the soil which increases in size and develops roots as the plant ages. The above ground stool is the stump that remains above the soil after harvesting and contains the buds
for the next season growth[7]. The above ground stool was
separated from the below ground stool by cutting the stool at soil level. The coarse roots were cut from the below ground
stool at the point of emergence; roots with a diameter2 mm
were classified as coarse roots and those<2 mm as fine roots
[39]. The soil from the trench was raked through to collect any
remaining visible root material that had become detached from the main stool. No sieving and washing of soil from the trench took place as the number of plants (32) and harvests (15) made it impractical, therefore we will have only retained a proportion of the fine root material. The stool and root
ma-terial were washed clean of soil and oven-dried at 80C to a
constant weight. The total above ground biomass (leaves, stems and above ground stool) and total below ground biomass (below ground stool and roots) were then then scaled
up to tonnes of dry matter per hectare (t DM ha1).
2.5. Fine root biomass
2.5.1. Collection of soil cores
As fine roots are an important component of the below ground
biomass[7,15,40]and fine root volumes were not accurately
assessed using the methods described in section2.4, an
below ground biomass occurred (section2.4), three soil cores were taken from each plot, focussed around one plant of the pair to be destructively sampled. A corer containing an inner sleeve that could be split longitudinally (diameter 70 mm; length 1 m) was driven into the soil using a hydraulic jack-hammer and extracted using a tripod ratchet. The first core was collected between the plant pair, i.e. in the centre of the narrow row; the second core was collected one quarter of the way across the wide row, i.e. 40 cm from the selected plant;
and the third core was collected half way across the wide row i.e. 80 cm from the selected plant. The cores were kept whole,
wrapped in plastic and stored in a freezer at 20 C until
processing to prevent decomposition of fine roots.
2.5.2. Processing of soil cores
The frozen cores were thawed for processing and divided into
five depth intervals: 0e10, 10e20, 20e30, 30e50 and
50e100 cm. Each interval was then split in half vertically and
the fresh weight of each half recorded. One half was reserved to assess soil properties (not reported here) whilst the second was used for root measurements. Roots were separated from the soil by rinsing over a 1 mm sieve. After washing, roots
were refrigerated at 4C in jars containing 20% ethanol for up
to 2 weeks until they were floated on water in a shallow tray
and scanned on a flatbed scanner (EPSON®Expression®1600,
Long Beach, CA, USA). The images obtained from the scanner
were analysed using theWinRhizoTMroot scanning software
program (2002a Pro, Regent Instruments Inc., Canada) to determine the total length, volume, surface area and diameter of roots in the five depth intervals. The total root length was corrected for the volume of the interval from which the roots
were extracted to give the root length density (RLD, m cm3).
2.6. Statistical analysis
Statistical analyses were carried out using the computing
package R [(version 3.0.1) Copyright©2013, The R Foundation
for Statistical Computing] withP¼0.05 as the critical level of
Fig. 1eClimatic data from 2010 to 2014 at Harpenden (Harp) and Aberystwyth (Aber). Cumulative
photosynthetically active radiation (PAR) (a), Cumulative rainfall (b), volumetric water content (q) at 10 cm depth (c), average monthly maximum air temperature (d), average monthly minimum air temperature (e), average soil temperature at 10 cm depth (f), average relative humidity (g), monthly maximum wind run (h), and monthly minimum wind run (i). Cumulative PAR and rainfall are calculated for each rotation (rotation one¼2010e2012, rotation two¼2012e2014).
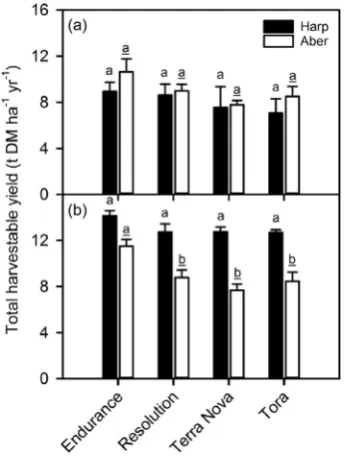
Fig. 2eTotal harvestable yield (tonnes dry matter per hectare per year (t DM ha¡1yr¡1)) for the four willow
significance. Data from rotation one and two were treated separately. Above and below ground biomass data were analysed using a linear mixed effects model (lme) to test for differences between genotype, site and sampling date and any interactions therein. Genotype, site and sampling date were designated as fixed effects and block and sampling date as random effects. For the annual yield there was one har-vest per rotation, therefore the (lme) analysis considered
genotype, site and genotypesite only, and included block
as a random effect. RLD was measured in two genotypes; the (lme) was used to uncover differences between genotype, site and depth interval and test for interactions between these
variables (genotypesitedepth), block and core number
were both considered as random effects. For all analyses any data that did not meet the conditions of normality were transformed.
3.
Results
3.1. Climate
Climatic data are summarised over the two crop rotations
(2010e2014) for the two sites Harpenden and Aberystwyth
(Fig. 1). Cumulative photosynthetically active radiation (PAR) was greater at Harpenden compared to Aberystwyth. How-ever, the accumulation was greater during the first than the second rotation, with Harpenden receiving 17% and 7% more
PAR than Aberystwyth respectively (Fig. 1a).
Aberystwyth is a wetter site than Harpenden, as shown by the greater cumulative rainfall during rotation 1 (42%) and
rotation 2 (31%) (Fig. 1b). The level and distribution of rainfall
is reflected in the volumetric soil water content (q). Overall
there was more water available at Aberystwyth but a water deficit occurred at both sites during summer 2010, 2011 and
2013 (Fig. 1c) which reduced growth rates of the willow[41].
The average air temperature showed little difference be-tween the two sites (data not shown). However, Harpenden experienced a greater range of temperatures, with higher
maxima and lower minima (Fig. 1d and e). For example, during
July 2011 and 2012 the average maximum temperatures at
Harpenden were 3.1 and 2.4C higher, respectively. Whilst
during winter, temperatures reached an average minimum of
2.7C in 2011 and -0.4C in 2012 at Harpenden, yet did not
drop below1.7 (2011) and 2.2C (2012) at Aberystwyth. The
patterns in air temperature were reflected in the soil tem-peratures; during the summer, average monthly soil temper-atures were higher at Harpenden, whilst during the winter
average monthly soil temperatures were lower (Fig. 1f).
Reflecting the warmer temperatures and lower rainfall, average monthly relative humidity (RH) was significantly lower at Harpenden compared to Aberystwyth, with the largest discrepancy between sites occurring in the summer months. At Harpenden humidity reached a minimum of 68%, 77% and 70% during 2011, 2012 and 2013 respectively, whilst at Aberystwyth humidity did not drop below 79% over the three
years (Fig. 1g).
Average wind run shows little difference between sites (data not shown). However, the range of maximum and min-imum monthly wind run was greater at Aberystwyth,
espe-cially during the first rotation (Fig. 1h and i). During 2011 there
were only 3 months at Aberystwyth where maximum wind
run did not reach 500 km day1, compared to nine out of
12 months at Harpenden. In the same year wind run dropped
to a minimum of 100 km day1at Aberystwyth for ten of the
twelve months whilst wind run was only less than
100 km day1for 2 months at Harpenden (Fig. 1h and i).
3.2. Total harvestable yield
Total harvestable yield was measured at the end of the first rotation in 2012 and the end of the second rotation in 2014
Table 2eLinear mixed effects model for annual yield, above ground biomass, below ground biomass, below ground
allocation and leaf area for the four willow varieties over two rotations, testing for the effects of genotype, site, sampling
date and any interactions therein. Significance levels were set atP<0.05 and n.s is not-significant. Annual yield data is
from a single time point so sampling date was not included in the analysis (n/a).
Rotation 1 Annual yield Above ground biomass Below ground biomass Below ground allocation Leaf area
n P n P n P n P n P
Genotype 4 n.s 4 <0.001 4 <0.001 4 <0.001 4 <0.001
Site 2 n.s 2 n.s 2 <0.05 2 <0.05 2 <0.01
Date e n/a 11 <0.001 11 <0.001 11 <0.001 8 <0.001
Genotypesite 8 n.s 8 <0.05 8 <0.05 8 n.s 8 <0.01
Genotypedate e n/a 44 n.s 44 n.s 44 n.s 32 n.s
Sitedate e n/a 22 <0.001 22 <0.001 22 <0.001 16 <0.001
Genotypesitedate e n/a 88 n.s 88 n.s 88 n.s 64 n.s
Rotation 2 Annual yield Above ground biomass Below ground biomass Below ground allocation Leaf area
n P n P n P n P n P
Genotype 4 <0.001 4 <0.001 4 <0.001 4 <0.01 4 <0.001
Site 2 <0.001 2 <0.001 2 <0.01 2 <0.001 2 n.s
Date e n/a 4 <0.001 4 <0.001 4 <0.001 2 <0.001
Genotypesite 8 n.s 8 n.s 8 <0.01 8 n.s 8 n.s
Genotypedate e n/a 16 n.s 16 n.s 16 n.s 8 n.s
Sitedate e n/a 8 <0.01 8 n.s 8 n.s 4 n.s
(Fig. 2). During the first rotation there was no significant dif-ference in yields between the four willow genotypes and
be-tween the two sites (Fig. 2a; Table 2). However, during the
second rotation yields were significantly greater at Harpenden compared to Aberystwyth and there were significant
differ-ences between genotypes (Fig. 2b;Table 2). A lack of
interac-tion between genotype and site shows that the ranking of the genotypes in terms of yield was similar at the two locations (Fig. 2b;Table 2). Endurance had the greatest yield reaching
14.1 and 11.5 t DM ha1yr1at Harpenden and Aberystwyth
respectively, whilst the remaining 3 genotypes displayed
similar yields of 12.7 t DM ha1 yr1 at Harpenden and
7.7e8.8 t DM ha1yr-1at Aberystwyth.
3.3. Biomass allocation
Total above ground biomass increased during the first rotation, from the first destructive sampling in 2010 to the
final sampling at the start of 2012, for all genotypes at both
sites (Fig. 3aed). Biomass peaked at the end of August in
each year (2010 and 2011) and then showed an overwinter decline, due to the loss of leaves and small branches (Fig. 3aed). Genotypes showed significant differences, with Endurance having the greatest above ground biomass at all sampling times and Tora the smallest, whilst Resolution and
Terra Nova were intermediate (Fig. 3aed; Table 2). No
sig-nificant differences in above ground biomass were found
between sites (Table 2).
During the second rotation, above ground biomass increased from the first harvest in May 2012 to the final harvest at the start of 2014. The same pattern of significant difference between genotypes was found as described previously for the
first rotation (Fig. 3aed;Table 2). A strong difference between
sites was detected in the second rotation, with genotypes displaying a significantly greater above ground biomass at
Harpenden compared to Aberystwyth (Fig. 3aed;Table 2).
Below ground biomass was lower at Aberystwyth for the
first destructive sampling in June 2010 (Fig. 3eeh). However,
throughout 2010 and early 2011 it increased more rapidly at the Aberystwyth site, until it was significantly greater in all genotypes for the majority of the remaining sampling dates (Fig. 3eeh;Table 2). In fact, by the final sampling date, during January 2014, below ground biomass was up to 94% greater in Endurance growing at Aberystwyth compared to Harpenden. Below ground biomass followed a seasonal cycle, with a reduction over the winter months and this was more apparent at Aberystwyth due to the greater mass. Significant differ-ences were detected between genotypes; below ground biomass was greatest in Endurance (reaching a maximum of 675 g at Aberystwyth) and was similar for the other 3 geno-types which weighed a maximum of ~400 g each at
Aber-ystwyth (Fig. 3eeh;Table 2).
The allocation of biomass to the below ground is shown in
more detail inFig. 4. The below ground biomass fraction is
similar at the two sites until July 2011 when they start to diverge and the fraction of biomass allocated below ground begins to increase at the Aberystwyth site. This significant difference between sites remains until the end of the first
rotation and throughout the second rotation (Fig. 4,Table 2).
Significant differences between genotypes were found
throughout both rotations (Table 2). However, within site
genotypic differences were not large with the proportion of biomass allocated below ground differing by a maximum of 10%. Generally, Endurance allocated the greatest proportion of biomass below ground and Resolution the least.
3.4. Fine root biomass
Fine root volumes were measured as the root length density (RLD). RLD declined with increasing depth from the soil
surface for both genotypes (Endurance and Resolution) at the two sites; in fact the majority of fine roots were concentrated
in the first 0e10 cm of soil (Fig. 5). Genotypes did not show a
significant difference in RLD, but there was a significant dif-ference between sites with both genotypes at Aberystwyth
having a much greater RLD (Table 3;Fig. 5). For example, at
Aberystwyth, in the first 0e10 cm of soil, there was a 103% and
147% greater volume of fine roots for Endurance and Resolu-tion respectively. This difference remained until depths of 40 cm and deeper when there was no difference in root
vol-umes between sites (Fig. 5). Using the fine root data, alongside
the below ground biomass data collected at the June 2013 destructive sampling the fraction of biomass allocated into
the different below ground components was estimated (Fig. 6).
Interestingly, there is a trend towards greater allocation into the belowground stool and coarse roots compared to the fine roots for the genotypes growing at IBERS, particularly for Endurance.
The fine root data was used to estimate how much biomass was lost from the below-ground with our sampling method.
We found losses of 50e73 g of fine roots when comparing
those recovered by raking through the pits to those calculated from soil cores. This equates to an underestimation of the
below ground biomass (fine roots) of 16e24%.
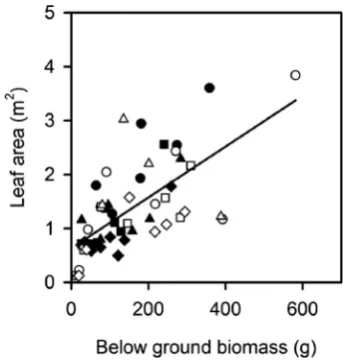
3.5. Leaf area and below ground biomass
As expected, total leaf area was significantly different
be-tween genotypes across both rotations (Table 2;Fig. S1). For
example, during June 2011, leaf area was the largest in
Endurance reaching 2.9 m2 at Harpenden and 2.4 m2 at
Aberystwyth, followed by Terra Nova whose leaf area was
1.4 m2and 2.2 m2at Harpenden and Aberystwyth respectively.
Resolution and Tora showed the smallest leaf areas of 1.3 m2
and 1.5 m2for Resolution and 0.8 m2and 1.1 m2for Tora at
Harpenden and Aberystwyth respectively (Fig. S1). A
signifi-cant difference in leaf area between the two sites was found in
the first rotation but not the second (Table 2). Leaf area
showed a positive correlation with the total below ground
biomass (Fig. 7).
4.
Discussion
4.1. Allocation patterns differ between genotypes
We found significant differences in biomass allocation be-tween the four willow genotypes included in this study,
demonstrating that capacity to manipulate the trait exists. The variation between genotypes in below ground biomass allocation was up to 10% and this is within the range of vari-ation found by Weih and Nordh between 6 different willow
clones[16]. Furthermore, we found that Endurance, the
ge-notype which had the largest below ground biomass, had equal or greater above ground yields than the other three genotypes. This shows that in Endurance, yield was not compromised by increased biomass partitioning to the below ground organs. This study used a limited number of willow genotypes and there are circa 400 different species (depending on the classification used), thus there is a large resource in
which different allocation patterns could be identified[1].
Bouman and Sylliboy[32]looked at biomass allocation in
12 different willow varieties, finding large differences in root Fig. 5eRoot length density (RLD) at five depths for the two
willow varieties: Endurance and Resolution grown at Harpenden (Harp) and Aberystwyth (Aber). Data are means±SE of four replicates. Significant differences between the sites are indicated by **¼<0.01 and *¼<0.05.
Table 3eLinear mixed effects model for root length
density (RLD) for the two willow varieties, Endurance and Resolution, testing for the effects of genotype, site and depth and any interactions therein. Significance levels
were set atP<0.05 and n.s is not-significant.
RLD
n P
Genotype 2 n.s
Site 2 <0.001
Depth 5 <0.001
Genotypesite 4 n.s
Genotypedepth 10 n.s
Sitedepth 10 n.s
Genotypesitedepth 20 n.s
Fig. 6eThe fraction of below ground biomass allocated into the belowground stool (black), coarse roots (pale grey) and fine roots (dark grey) for the two willow varieties: Endurance and Resolution grown at Harpenden (Harp) and Aberystwyth (Aber).
Fig. 7eRegression slope for the relationship between leaf area and below ground biomass (y¼0.0047xþ0.6317; F¼43.9,P<0.001, R20.49). Data are from the seven
volumes which were positively correlated with leaf area. Similarly, in this study, we found that Endurance had the largest leaf area as well as the greatest below ground mass, and that overall leaf area was positively correlated with root biomass. However, unlike the genotypes studied here, Weih
and Nord [16,34] demonstrated an inverse relationship
be-tween leaf area and root biomass in six willow clones, sug-gesting that increased shoot productivity with increasing leaf area occurred at a cost of reduced below ground biomass allocation. As an evolutionary adaptation it makes sense that a genotype with a high resource acquiring surface area should have a correspondingly large surface area below ground to
acquire water and nutrients[42]. Leaf area ratio (leaf area per
unit plant mass) and root length ratio (root length per unit plant mass) have both been positively (and strongly)
corre-lated with relative growth rate in nine Boreal tree species[42].
Above ground growth rate between the March 2011 and June 2011 harvests was greatest in Endurance at both sites reaching
7.1g day1 and 6.1g day1 at Harpenden and Aberystwyth
respectively (Fig. S2). Therefore, Endurance surpassed a
weight of 1 kg plant1by June 2011 during the first rotation at
both sites, whereas all other genotypes took until at least August. Therefore, it appears that positive relationships be-tween leaf area, root biomass and growth rate are also present in willow. These relationships also present the possibility that canopy area, which can be measured non-destructively, could be used as an easier predictor of below ground biomass.
4.2. Environmental influence on partitioning
Our data from the Harpenden site agree with the study by
Rytter[15], which showed that the below ground biomass of
willow increased with plant age, but overall allocation below ground fell. In Endurance and Resolution at both sites, the fine roots were largely concentrated in the first depth interval of 10 cm, which also agrees well with other studies on the
dis-tribution of willow root biomass[7,20,39]. However, at the
Aberystwyth site, below ground biomass was much greater in all genotypes, and allocation below ground tended to increase, especially during the second rotation. These between-site differences were much larger than the within site genotypic allocation differences. For Endurance, growing at Aber-ystwyth, the biomass of the coarse roots and below ground stool combined was up to 94% greater than that at Harpenden by the end of the second rotation. Furthermore, plants had double the volume of fine roots when growing at Aberystwyth compared to Harpenden. Differences in climate and soils need to be considered to help explain this unexpected discrepancy.
Low temperatures (below 18C[24]) can increase biomass
allocation to roots as a range of plant functions are impaired
[e.g.[43e45]]. Specifically, nutrient uptake and water uptake
are slowed, and nutrient cycling rates in the soil are reduced
[24,43,46]. Average temperatures were lower at the Aber-ystwyth site during the summer months but during spring and autumn when some root growth still occurred, tempera-tures were largely equal. Moreover, previous reports indicate
only modest changes in allocation above 18C, suggesting
only minimal adjustments might occur over the temperature
range seen here[24].
It is unlikely that light levels can account for the observed differences in partitioning. Low light levels have been shown to increase allocation to above ground organs, specifically to leaves to increase production when carbon is limiting and to branches and stems to fuel height growth through gaps in the
canopy [26,42,47]. However, the majority of these studies
looked at very low light levels experienced by shade grown
plants. In fact, allocation becomes saturated above
20 mol m2day1and the plants in this study were receiving
well above this light level at both sites[24].
Rainfall was considerably lower at Harpenden than Aber-ystwyth for rotations 1 and 2. Reduced water availability can increase investment in roots, although this generally occurs when plants are subjected to severe drought stress and total
biomass is severely reduced (by 4e6 times)[48e50]. Declines
in total biomass of this extent were not seen in this study. Possibly, optimal partitioning does not operate when envi-ronmental challenges are relatively short-lived (e.g. unpre-dictable rain or drought events), as responding too quickly to shorter-lived stress may result in sub-optimal growth once water supply is returned and thus be disadvantageous in the
long run[24,25].
Coarse root and the below ground stool were larger at Aberystwyth. Furthermore, the data suggests (for one geno-type) that there is an increased allocation of biomass into these fractions relative to fine roots. Interestingly, although no reduction in stem height occurred stems were substantially
thicker (Fig. S3). Both are common physiological responses to
mechanical stimuli [51]. Wind speeds were considerably
higher at Aberystwyth where the site is very exposed, and considerably more turbulent, reaching higher maximum speeds and lower minimum speeds. Larger root biomass in-creases the magnitude of the mechanical forces required to
dislodge a plant from its substrate [51]. Coutand et al.[52]
found that trees encased in an artificial shelter had poor root growth compared to trees exposed to natural/mechanical
wind stimuli, and Whitehead [53] found that high root
biomass was maintained at the expense of shoot biomass in sunflower subjected to increasing wind speeds. Furthermore, Sitka spruce subjected to artificial flexing showed significant
increases in coarse root mass[54].
Investigations of the impacts of relative humidity (RH) on allocation are of renewed interest with respect to climate change, which is expected to bring increased rainfall and humidity to northern latitudes. With increasing humidity allocation below ground is predicted to increase, as demon-strated in silver birch and aspen in a humidity manipulation
experiment[55]. In particular, fine root biomass and specific
area of fine roots were enhanced under high humidity[55]. It is
suggested that high RH could impede nutrient assimilation due to decreased evaporation and thus a decline in the tran-spiration stream that moves to the upper parts of a tree, and therefore increased investment in roots is required to meet
growth demands[55,56]. RH was consistently higher at
Aber-ystwyth, rarely falling below 80% even with greater wind speeds.
Nutrient availability is well documented as strongly
influ-encing allocation[24], with a large increase in roots occurring
at the expense of shoot biomass when nutrients are limiting.
under limited nitrogen (N), specifically the annual production
of fine roots (<1 mm) in the N-limited treatment exceeded that
of the unlimited treatment by 31%. Weih and Nordh [16]
showed that the root biomass fraction of 6 willow varieties declined with the addition of fertilizer. Measures of soil nu-trients at the Aberystwyth trial site are not available for this study but soils at Aberystwyth have been shown to contain a greater percentage of sand (41% compared to 13% at Harpen-den) and are known to be very shallow in some areas where
bedrock is reached at less than 50 cm depth. Pacaldo et al.[7]
found a high root biomass and lower stem biomass in willows growing on a site with soil depths of 40 cm and occasional floods which wash out nutrients. It is feasible that a similar situation could be occurring in the willows growing at Aber-ystwyth, where rainfall is also higher.
Furthermore, soils at Aberystwyth have a lower bulk den-sity and, due to the contrasting previous land uses (grassland vs. arable), have a higher organic carbon content of 3.9% compared to 1.3% at Rothamsted. Combined with a greater amount of plant available water this suggests that the soil is both more porous and better-structured at Aberystwyth, and these properties may encourage the proliferation of roots as the soil is likely to be easier to penetrate. Soils with a high clay content and high bulk density have been shown to have a
greater potential to impede root growth[58]and this may have
been a factor in the finer textured soils at Rothamsted. Given the above considerations we conclude that differ-ences in allocation patterns between the two sites arose from a combination of environmental influences primarily differ-ences in wind speed, with humidity, and soil properties and potentially available nutrients having additional impact.
4.3. Impact of allocation patterns on C accumulation
potential
Carbon-sequestration potential cannot be evaluated from this study as long-term fine root dynamics were not measured
[15,18], nor were mycorrhizal associations or soil microbial
processes studied[59e61]. However, we can give an indication
of the C accumulation potentials of the different willow ge-notypes using our measurements of above and below ground biomass from the end of the first and second rotation (January 2012 and 2014). C content was not measured directly, but if we
assumed similar levels to previous studies (e.g. Rytter [18]
used a common C-concentration of 500 mg g1biomass[62])
we can derive C accumulation levels in the crop of
0.79e1.17 t ha1 year1 below ground and 5.21e6.93 t ha1
year1 above ground, with the greatest potentials for both
pools being in Endurance.
We also found that allocation varies strongly with envi-ronment and differences between sites were greater than the within-site genotypic differences. Therefore, not only does yield vary with growing environment but so does the below ground C accumulation potential. For example, during January 2014, the harvestable yields of Endurance were 20% less at Aberystwyth compared to Harpenden, but simulta-neously the below ground biomass was 94% greater at Aber-ystwyth, demonstrating a greater capacity for C accumulation at this site.
Plants with desirable allocation patterns could be used to enhance C accumulation and this could be further enhanced by manipulating biomass allocation patterns through genetic
screening, selective breeding and management [17,63e66].
Alternatively, some of the below ground growth could be reduced to increase above ground yield to meet growing en-ergy demand. However, in this latter case care has to be taken
not to impact regrowth potential[11]. To exploit such traits we
need a better understanding of source: sink relationships and a more systems-based approach since it is unlikely that par-titioning is under the control of a single gene, but rather an orchestrated response of multiple genes to environmental
pressure and stimuli[24].
4.4. Rotation length and planting density
This study used a two-year rotation when traditionally a
three-year rotation has been employed for willow SRC[37].
However, the willows used in this study are commercially grown and sufficiently high yielding to be managed within a two-year rotation, which indeed is what some UK commercial growers are now practicing for high yielding varieties. Earlier studies looking at the effects of changed harvesting frequency are mixed with some showing increased yields and others
diminished[67,68], although these studies were conducted on
older varieties so results may not be applicable here. To the authors knowledge no publications exist on the effect of harvesting frequency on biomass allocation. Our view is that,
potentially trees on a 3e4 year cycle would have a greater
below ground biomass as there would be less demand for the belowground reserves to be used for regrowth after coppice.
The planting density of 16,667 plants ha1 used in this
study is marginally higher than the industry standard of
15,000 plants ha1[37]. Bullard et al. [69]presented limited
data on biomass partitioning which suggests greater below
ground allocation at densities of 111,000 plants ha1
compared to 10,000 plants ha1. Similarly, both[70]and[71]
showed increasing below ground biomass allocation at high densities and related it to smaller tree size or resource
limi-tation[71]. However these studies all look at much larger
in-creases in density than our deviation from the current recommended planting density. Comparing the effects of rotation length and density are both aspects worthy of future study.
5.
Conclusions
Alongside this, the soil properties at Aberystwyth, combined with high humidity which can act to slow N translocation in the crop, may have favoured further investment in roots. In-formation from this study could be used to inform breeding to favour increased C accumulation, increased biomass yield, or potentially both.
Acknowledgements
The authors thank Drs Goetz Richter and Marianna Cerasuolo (Rothamsted Research) and Drs Iain Donnison and John Clifton-Brown (IBERS) for helpful advice, William Macalpine and Peter Fruen for assistance with experimental work, the Farm support staff at both Rothamsted Research and IBERS for assistance with the field trials and David Steele (Rothamsted Research) for his careful washing of roots from the soil cores. This work was supported by the BBSRC Sustainable Bioenergy Centre (BSBEC) grant (BB/G016216/1) working within the
BSBEC BioMASS programme of the centre (
http://www.bsbec-biomass.org.uk/). Rothamsted Research is an Institute sup-ported by the Biotechnological and Biological Sciences research Council of the United Kingdom.
Appendix A. Supplementary data
Supplementary data related to this article can be found at
http://dx.doi.org/10.1016/j.biombioe.2015.04.020
r e f e r e n c e s
[1] Karp A. Willows as a source of renewable fuels and diverse products. In: Fenning T, editor. Challenges and opportunities for the World's forests. Dordrecht: Springer
ScienceþBusiness Media; 2014. p. 617e41.
[2] Volk TA, Abrahamson LP, Nowak CA, Smart LB, Tharakan PJ, White EH. The development of short-rotation willow in the northeastern United States for bioenergy and bioproducts, agroforestry and phytoremediation. Biomass Bioenergy 2006;30:715e27.
[3] Kuzovkina YA, Weih M, Abalos Romero M, Charles J, Hurst S, McIvor I, et al. Salix: botany and global horticulture. Hortic Rev 2008;34:447e89.
[4] Keoleian GA, Volk TA. Renewable energy from willow biomass crops: life cycle energy, environmental and economic performance. Crit Rev Plant Sci 2005;24:385e406. [5] Karp A, Shield I. Bioenergy from plants and the sustainable
yield challenge. New Phytol 2008;179:15e32. [6] Djomo SN, Kasmioui OE, Ceulemans R. Energy and
greenhouse gas balance of bioenergy production from poplar and willow: a review. GCB Bioenergy 2011;3:181e97. [7] Pacaldo RS, Volk TA, Briggs RD. Greenhouse gas potentials of
shrub willow biomass crops based on below- and aboveground biomass inventory along a 19-year chronosequence. Bioenerg Res 2013;6:252e62.
[8] Matthews RW. Modelling of energy and carbon budgets of wood fuel coppice systems. Biomass Bioenergy 2001;21:1e19. [9] Dickmann DI, Pregitzer KS. The structure and dynamics of
woody plant root systems. In: Mitchell CP, Ford-Robertson T, Hinckley T, Sennerby-Forsse L, editors. Ecophysiology of
short rotation forest crops. Essex, England: Elsevier Science Publishers Ltd.; 1992. p. 95e123.
[10] Lambers H. Growth, respiration, exudation and symbiotic associations: the fate of carbon translocated to the roots. In: Gregory PJ, Lake JV, Rose DA, editors. Root development and function. London: Cambridge University Press; 1987. p. 124e45.
[11] Sennerby-Forsse L, Ferm A, Kauppi A. Coppicing ability and sustainability. In: Mitchell CP, Ford-Robertson T, Hinckley T, Sennerby-Forsse L, editors. Ecophysiology of short rotation forest crops. Essex, England: Elsevier Science Publishers Ltd; 1992. p. 146e84.
[12] Von Fircks Y, Sennerby-Forsse L. Seasonal fluctuations of starch in root and stem tissues of coppicedSalix viminalis
plants grown under two nitrogen regimes. Tree Physiol 1998;18:243e9.
[13] Tschaplinski TJ, Blake TJ. Carbohydrate mobilization following shoot defoliation and decapitation in hybrid poplar. Tree Physiol 1994;14:141e51.
[14] Regier N, Streb S, Zeeman SC, Frey B. Seasonal changes in starch and sugar content of poplar(Populus deltoidesnigra
cv. Dorskamp) and the impact of stem girdling on carbohydrate allocation to roots. Tree Physiol 2010;30:979e87.
[15] Rytter RM. Biomass production and allocation, including fine-root turnover, and annual N uptake in lysimeter-grown basket willows. For Ecol Manage 2001;140:177e92.
[16] Weih M, Nordh NE. Determinants of biomass production in hybrid willows and prediction of field performance from pot studies. Tree Physiol 2005;25:1197e206.
[17] Sartori F, Lal R, Ebinger MH, Parrish DJ. Potential soil carbon sequestration and CO2offset by dedicated energy crops in
the USA. Crit Rev Plant Sci 2006;25:441e72.
[18] Rytter RM. The potential of willow and poplar plantations as carbon sinks in Sweden. Biomass Bioenergy 2012;36:86e95. [19] Lemus R, Lal R. Bioenergy crops and carbon sequestration.
Crit Rev Plant Sci 2005;24:1e21.
[20] Zan CS, Fyles JW, Girouard P, Samson RA. Carbon sequestration in perennial bioenergy, annual corn and uncultivated systems in southern Quebec. Agric Ecosyst Environ 2001;86:135e44.
[21] Agostini F, Gregory A, Richter G. Carbon sequestration by perennial energy Crops: is the jury still out? Bioenerg Res
2015:24.http://dx.doi.org/10.1007/s12155-014-9571-0.
[22] Heller MC, Keoleian GA, Volk TA. Life cycle assessment of a willow bioenergy cropping system. Biomass Bioenergy 2003;25:147e65.
[23] Bloom AJ, Chapin FS, Mooney HA. Resource limitation in plants - an economic analogy. Annu Rev Ecol Syst 1985;16:363e92.
[24] Poorter H, Niklas KJ, Reich PB, Oleksyn J, Poot P, Mommer L. Biomass allocation to leaves, stems and roots: meta-analyses of interspecific variation and environmental control. New Phytol 2012;193:30e50.
[25] Reich PB. Root-shoot relations: optimality in acclimation and adaptation or the“Emperor's new Clothes”? In: Waisel Y, Eshel A, Kafkafi U, editors. Plant roots: the hidden half. New York, USA.: Marcel Dekker, Inc; 2002. p. 205e20.
[26] Poorter H, Nagel O. The role of biomass allocation in the growth response of plants to different levels of light, CO2,
nutrients and water: a quantitative review. Aust J Plant Physiol 2000;27:595e607.
[27] Cannell MGR, Dewar RC. Carbon allocation in trees - a review of concepts for modelling. Adv Ecol Res 1994;25. 25:59-104. [28] Pellis A, Laureysens I, Ceulemans R. Growth and production
[29] Marron N, Villar M, Dreyer E, Delay D, Boudouresque E, Petit JM, et al. Diversity of leaf traits related to productivity in 31 populus deltoides x populus nigra clones. Tree Physiol 2005;25:425e35.
[30] Ceulemans R, Stettler RF, Hinckley TM, Isebrands JG, Heilman PE. Crown architecture of populus clones as determined by branch orientation and branch characteristics. Tree Physiol 1990;7:157e67.
[31] Andralojc PJ, Bencze S, Madgwick PJ, Philippe H, Powers SJ, Shield I, et al. Photosynthesis and growth in diverse willow genotypes. Food Energy Secur 2014;3:69e85.
[32] Bouman OT, Sylliboy J. Biomass allocation and
photosynthetic capacity of willow (Salixspp.) bio-energy varieties. Forstarchiv 2012;83:139e43.
[33] Weih M, Bussel LV. Effect of root and leaf allocation on soil carbon sequestration potential of Salix bioenergy plantations in Sweden. COST E38 workshop: woody root processes, revealing the hidden half. Sede Boqer, Israel, 2006L2. [34] Weih M, Nordh N-E. Characterising willows for biomass and
phytoremediation: growth, nitrogen and water use of 14 willow clones under different irrigation and fertilisation regimes. Biomass Bioenergy 2002;23:397e413.
[35] Lindegaard K. WIllow varietal identification guide: teagasc, crops research centre, Oak Park, Carlow and AFBI. Belfast: Agri-Food and Bioscience Institute, Newforge Lane; 2013. p. 64. [36] BBSRC. Growing the bioenergy field. BBSRC business.
Swindon, UK: BBSRC; 2011. p. 12e3.
[37] Defra. Growing short rotation coppice. Best practice for applicants to Defra's energy crop scheme. In: Defra; 2002. p. 32.
[38] Avery BW, Catt JA. The soil at rothamsted. Harpenden UK: Lawes Agricultural Trust Co. Ltd; 1995. p. 40.
[39] Rytter RM, Hansson AC. Seasonal amount, growth and depth distribution of fine roots in an irrigated and fertilized
Salix viminalisL-plantation. Biomass Bioenergy 1996;11:129e37.
[40] Rytter RM. Fine-root production and carbon and nitrogen allocation in basket willows [Ph. D. Thesis]. Uppsala: Swedish University of Agricultural Sciences; 1997. [41] Cunniff J, Shield I, Barraclough T, Castle M, Hanley SJ,
Andralojc J, et al. BSBEC-BioMASSeselecting traits to
optimise biomass yield of SRC willow. In: Booth E, Halford N, Shield I, Taylor G, Turley D, Voigt T, editors. Biomass and energy crops IV. Champaign, USA: University of Illinois; 2011. p. 83e91. Association of Applied Biologists.
[42] Reich PB, Tjoelker MG, Walters MB, Vanderklein DW, Bushena C. Close association of RGR, leaf and root
morphology, seed mass and shade tolerance in seedlings of nine boreal tree species grown in high and low light. Funct Ecol 1998;12:327e38.
[43] Reich PB, Luo Y, Bradford JB, Poorter H, Perry CH, Oleksyn J. Temperature drives global patterns in forest biomass distribution in leaves, stems, and roots. Proc Natl Acad Sci U.S.A 2014;111:13721e6.
[44] Luo YJ, Wang XK, Zhang XQ, Booth TH, Lu F. Root:shoot ratios across China's forests: Forest type and climatic effects. For Ecol Manage 2012;269:19e25.
[45] Gill RA, Jackson RB. Global patterns of root turnover for terrestrial ecosystems. New Phytol 2000;147:13e31. [46] Lambers H, Chapin III FS, Pons TL. Plant physiological
ecology. NY, USA: Springer ScienceþBusiness Media, LLC; 2008. p. 591.
[47] Olff H, Vanandel J, Bakker JP. Biomass and shoot root allocation of 5 species from a grassland succession series at different combinations of light and nutrient supply. Funct Ecol 1990;4:193e200.
[48] Gindaba J, Rozanov A, Negash L. Photosynthetic gas exchange, growth and biomass allocation of two Eucalyptus
and three indigenous tree species of Ethiopia under moisture deficit. For Ecol Manage 2005;205:127e38.
[49] Tomlinson PT, Anderson PD. Ontogeny affects response of northern red oak seedlings to elevated CO2and water stress
-II. Recent photosynthate distribution and growth. New Phytol 1998;140:493e504.
[50] Schall P, Loedige C, Beck M, Ammer C. Biomass allocation to roots and shoots is more sensitive to shade and drought in European beech than in Norway spruce seedlings. For Ecol Manage 2012;266:246e53.
[51] Anten NPR, Casado-Garcia R, Pierik R, Pons TL. Ethylene sensitivity affects changes in growth patterns, but not stem properties, in response to mechanical stress in tobacco. Physiol Plant 2006;128:274e82.
[52] Coutand C, Dupraz C, Jaouen G, Ploquin S, Adam B. Mechanical stimuli regulate the allocation of biomass in trees: demonstration with youngPrunus aviumtrees. Ann Bot 2008;101:1421e32.
[53] Whitehead FH. Experimental studies of the effect of wind on plant growth and anatomy. New Phytol 1962;61:59e62. [54] Stokes A, Nicoll BC, Coutts MP, Fitter AH. Responses of young
Sitka spruce clones to mechanical perturbation and nutrition: effects on biomass allocation, root development, and resistance to bending. Can J For Res 1997;27:1049e57. [55] Rosenvald K, Tullus A, Ostonen I, Uri V, Kupper P, Aosaar J,
et al. The effect of elevated air humidity on young silver birch and hybrid aspen biomass allocation and accumulation - acclimation mechanisms and capacity. For Ecol Manage 2014;330:252e60.
[56] Sellin A, Tullus A, Niglas A, Ounapuu E, Karusion A, Lohmus K. Humidity-driven changes in growth rate, photosynthetic capacity, hydraulic properties and other functional traits in silver birch (Betula pendula). Ecol Res 2013;28:523e35.
[57] Rytter R-M. The effect of limited availability of N or water on C allocation to fine roots and annual fine root turnover in
Alnus incanaandSalix viminalis. Tree Physiol 2013;33:924e39.
[58] Gerard CJ, Sexton P, Shaw G. Physical factors influencing soil strength and root growth. Agron J 1982;74:875e9.
[59] Rooney DC, Killham K, Bending GD, Baggs E, Weih M, Hodge A. Mycorrhizas and biomass crops: opportunities for future sustainable development. Trends Plant Sci
2009;14:542e9.
[60] Fransson PMA, Toljander YK, Baum C, Weih M. Host plant-ectomycorrhizal fungus combination drives resource allocation in willow: evidence for complex species interaction from a simple experiment. Ecoscience 2013;20:112e21.
[61] Six J, Frey SD, Thiet RK, Batten KM. Bacterial and fungal contributions to carbon sequestration in agroecosystems. Soil Sci Soc Am J 2006;70:555e69.
[62] IPCC. Guidelines for national greenhouse gas inventories national greenhouse gas inventories programme. 2006. [63] Ragauskas AJ, Williams CK, Davison BH, Britovsek G,
Cairney J, Eckert CA, et al. The path forward for biofuels and biomaterials. Science 2006;311:484e9.
[64] Pregitzer KS, Dickmann DI, Hendrick R, Nguyen PV. Whole-tree carbon and nitrogen partitioning in young hybrid poplars. Tree Physiol 1990;7:79e93.
[65] Donald CM. The breeding of crop ideotypes. Euphytica 1968;17:385e403.
[66] Ma Z, Wood CW, Bransby DI. Soil management impacts on soil carbon sequestration by switchgrass. Biomass Bioenergy 2000;18:469e77.
coppice Salix spp.d1. Yield response in two morphologically
diverse varieties. Biomass Bioenergy 2002;22:15e25. [68] Kopp RF, Abrahamson LP, White EH, Burns KF, Nowak CA.
Cutting cycle and spacing effects on biomass production by a willow clone in New York. Biomass Bioenergy 1997;12:313e9. [69] Bullard MJ, Mustill SJ, Carver P, Nixon PMI. Yield
improvements through modification of planting density and harvest frequency in short rotation coppice Salix spp.d2. Resource capture and use in two
morphologically diverse varieties. Biomass Bioenergy 2002;22:27e39.
[70] Pearson JA, Fahey TJ, Knight DH. Biomass and leaf area in contrasting lodgepole pine forests. Can J For Res
1984;14:259e65.