World Maritime University
The Maritime Commons: Digital Repository of the World
Maritime University
World Maritime University Dissertations Dissertations
2000
Towards a competitive setting for the Port of Aqaba
in the new millennium
Salah Abu Afifeh World Maritime University
Follow this and additional works at:http://commons.wmu.se/all_dissertations
Part of theEconomics Commons
This Dissertation is brought to you courtesy of Maritime Commons. Open Access items may be downloaded for non-commercial, fair use academic Recommended Citation
Abu Afifeh, Salah, "Towards a competitive setting for the Port of Aqaba in the new millennium" (2000).World Maritime University Dissertations. 381.
WORLD MARITIME UNVERS
WORLD MARITIME UNIVERSITY
Malmö, Sweden
TOWARDS A COMPETITIVE SETTING FOR
THE PORT OF AQABA IN THE NEW
MILLENNIUM
By
SALAH ABU AFIFEH
JORDANA dissertation submitted to the World Maritime University in partial fulfilment of the requirements
for the award of the degree of
MASTER OF SCIENCE
in
PORT MANAGEMENT
2000
To the source of inspiration and
continued flow of love, MY MOTHER.
Declaration
I certify that all the material in this dissertation that is not my own work has been identified, and that no material is included for which a degree has previously been conferred on me.
The contents of this dissertation reflect my own personal views, and are not necessarily endorsed by the University.
Salah Ali Abu Afifeh
Date: August 20, 2000
Supervised by:
Name: Dr. Bernard Francou
Office: Associate Professor of Port Management Institution: World Maritime University
Assessor:
Name: Dr. Shuo Ma
Office: Professor of Shipping Management and Port Management Institution: World Maritime University
Co-assessor:
Name: Dr. Patrick Alderton
Office: Former resident Professor, Port and Shipping Management Institution: World Maritime University
Acknowledgments
I would like to express my deepest gratitude to my supervisor, Professor Bernard Francou for his continued advice, comments and fruitful suggestions.
A special acknowledgement of gratitude is due to Professor Shuo Ma for his support and encouragement.
Special thanks must go to my donors, IMO-Norway Technical Co-operation Programme Fellowships whose support made the task of writing this dissertation possible.
I am also grateful to the Management of The Ports Corporation, Aqaba for nominating me to the port management course with special thanks and appreciation to the former Director General of the Port, Captain Mohammed Dalabieh who has been a consistent source of encouragement and inspiration.
I am also grateful to my colleagues at the Port of Aqaba whose support and assistance contributed significantly to the successful completion of this dissertation.
Special thanks must go also to my mother, brothers and sisters for their consistent support, encouragement and love.
Last but not least, I would like to extend my deepest thanks to my wife for her understanding, patience and endless love.
Abstract
Dissertation Title: “Towards a Competitive Setting for the Port of Aqaba in
the New Millennium”
Degree: MSc
This dissertation discusses the possible impact of the peace process in the Middle East on the competitive setting of the port of Aqaba. This process gave birth to new rival ports especially on the Mediterranean, ports which in the medium and the long term may pose a threat to the Port of Aqaba by taking a considerable part of its cargo. Therefore, this paper, includes an analysis of the significance of the Port to the national economy being the country’s sole access to the sea. Then, the capabilities of rival ports and the changing competition and trade environment in the region as a result of this process are analysed. The spidergramwas used as a tool to carry out this analysis using the main elements that make up the competitiveness of the port. As a result, the paper proposes some alternatives and measures that the Port can take to maintain its market share and improve its competitiveness. These alternatives suggest taking advantage of the location and the infrastructure of the port to attract transit traffic, containerised cargo, bulk cargo and cruise-ships. Further, the paper proposes carrying out necessary port reforms, giving the private sector an opportunity to participate in port development and operations and opening channels of dialogue with rival ports to investigate the possibility of having some kind of co-operation between them and the Port of Aqaba.
The paper concludes by proposing a marketing strategy for the Port based on focus and differentiation approaches. The strategy should be accompanied by carrying out necessary reforms on both the operational and the administrative levels.
Key words: Competition, Planning, Change, Marketing, Differentiation, Strategy, Alternatives, Focus, Process, Setting, Co-operation, Rivals, Reform.
Table of contents
:Dedication i
Declaration ii
Acknowledgements iii
Abstract iv
Table of Contents v
List of Tables vii
List of Figures ix
List of Abbreviations xi
1 Introduction 1
2 The role of the Port of Aqaba in economic Development in Jordan
2.1 Background 4
2.2 Port functions and facilities 5
2.3 Port role in development 9
2.4 Connection with other sectors 12
2.5 Conclusion 16
3 The economic and political changes in the Middle East
3.1 The peace process 17
3.2 Impact on the Port of Aqaba 19
3.3 Forces of change 33
3.4 Change implications 35
4 The emerging competitive environment
4.1 The new players 37
4.2 The potential challenge 46
4.3 Ports weaknesses and strengths 48
4.4 Competition implications 61
5 Developing a business strategy
5.1 Introduction 63
5.2 Demand forecast 64
5.2 SWOT analysis 66
5.3 Prospects and alternatives 69
5.4 Building a marketing strategy 74
6 Conclusions and recommendations 77
References 80
Appendices
Appendix A Export traffic in 1998 82
Appendix B Regression analysis 84
Appendix C Imported and exported commodities 89
List of Tables
Table 2.1 Cargo handling equipment in Aqaba Port 5
Table 2.2 Storage capacity in Aqaba Port 6
Table 2.3 Berthing facilities of the main port 7
Table 2.4 Berthing facilities of the container port 7
Table 2.5 Berthing facilities of the industrial port 7
Table 2.6 Number of workers in Aqaba Port 90-98 10
Table 2.7 Passenger, vehicle and cargo traffic via Aqaba
Nwebe’ ferry line & cruise-ship traffic 86-98 11
Table 3.1 Incoming transit cargo 1983-1998 20
Table 3.2 Outgoing and incoming transit cargo 88-98 21
Table 3.3 Containers imported via Red Sea route 95-98 25
Table 3.4 Containers imported via Med.- Suez Route 95-98
And Med.-Suez Routes 95-98
Table 3.5 Containers imported via Red Sea & Med. Routes 95-96 26
Table 3.6 Cargo exported via Aqaba Port 1994-1998 29
Table 3.7 Exports via Red Sea route in 1998 30
Table 3.8 Exports via Med.-Suez canal route in 1998 30
Table 3.9 Total exports vis a vis general cargo exports 92-98 31
Table 4.1 Container handling equipment in Haifa Port 39
Table 4.2 Berthing facilities and equipment in Ashdod Port 40
Table 4.3 Container handling equipment in Dubai Port 43
Table 4.4 Distances in km 50
Table 4.5 Ship draft in the concerned ports 51
Table 4.6 Container handling cranes, storage & berthing facilities
in the concerned ports 52
Table 4.7 Sea freight and port handling charges 53
Table 4.8 Container traffic in the concerned ports 90-98 54
Table 4.9 Container stuffing / unstuffing areas 55
Table 4.10 Average labour cost per hour in selected countries 56
Table 4.11 Ranking of concerned ports according to elements
of competition 58
List of Figures
Figure 2.1 Development imports & exports in Aqaba Port 9
Figure 2.2 Comparison of revenues and cargo handled 90-98 12
Figure 3.1 Incoming transit traffic from 83-98 19
Figure 3.2 Impact of political events Aqaba Port traffic 52-98 22
Figure 3.3 Comparison of containerised cargo imported via
Red Sea and Med.-Suez Canal routes 95-98 27
Figure 3.4 Commodities imported from EU & USA 94-98 28
Figure 3.5 G.C exports compared with total exports 92-98 31
Figure 4.1 Container traffic growth in Haifa Port 87-96 39
Figure 4.2 Container and G.C traffic growth in Ashdod Port 40
Figure 4.3 Container traffic growth in Jeddah Port 86-98 44
Figure 4.4 Imports via Aqaba Port by mode of discharge 90-98 49
Figure 4.5 Competitive position of ports with 11 elements 59
Figure 4.6 Competitive position of ports with 5 elements 60
Figure 4.7 Competitive ranking 60
Figure 5.1 Comparison between JICA forecast and actual
throughput in 000’ tons 64
Figure 5.2 JICA forecast compared with 2% assumed growth
of 1999 throughput in 000’ tons 65
List of Maps
Aqaba Port layout 8
Railway transport corridors 14
Middle East map 24
Map of Jordan 32
List of Abbreviations
ABMC Arab Bridge Maritime Company
ACT Aden Container Terminal
AGV Automated Guided Vehicle
ARC Aqaba Railway Corporation
CFS Container Freight Station
CTMS Container Terminal Management System
DPA Dubai Port Authority
EDI Electronic Data Interchange
G.C General Cargo
GCC Gulf Co-operation Council
GDP Gross Domestic Product
GNP Gross National Product
GPS Global Container Positioning System
HJR Hijaz Jordan Railway
JNSL Jordan National Shipping Lines
MDS Manifest and Documentation System
PC Ports Corporation
PSA Port of Singapore Authority
RTG Rubber Tyred Gantry
SEZ Special Economic Zone
SSA Stevedoring Services of America
SWOT Strengths, Weaknesses, Opportunities, Threats
TEU Twenty Equivalent Unit (twenty-foot container)
TSG The Services Group
UNCTAD United Nations Conference on Trade and
Development
WTO World Trade Organisation
Chapter
O
ne
Introduction
Since Aqaba Port Authority was founded in 1952, the Port has established itself as the main sea outlet of Jordan’s trade with the external world. More than 75% of Jordan’s exports and imports pass through the Port. However, the recent political and economic changes in the Middle East resulting from the peace process, along with the impacts of global economic and trade changes and technological
advances in the maritime industry, have created a highly competitive environment
and new trade practices in the region.
As a result, instead of being the main access for sea-born traffic into and out of Jordan on the one hand, and for transit cargo for some neighbouring countries on the other, the Port of Aqaba may soon find itself threatened by other ports on the Mediterranean like the ports of Ashdod and Haifa in Israel, the port of Beirut in Lebanon and the ports of Tartus and Latakia in Syria.
Suez Canal and on the main shipping route between Europe and South East Asia and Japan. Also, most of these ports are run and operated by either regional or global port operators like the Port of Singapore Authority (PSA), Dubai Port Authority (DPA) and Maersk Sealand.
As far as Mediterranean ports are concerned, they are not only geographically and logistically closer to the sources of production in Europe and North America but are located at a stone’s throw from the consumption, commercial and industrial zones in and adjacent to the capital Amman and the northern part of the country. Further, these ports are located closer to the main trade partner of Jordan; Iraq with its huge market, particularly when the sanctions are lifted. These ports are more likely to have a comparative and competitive advantage over the Port of Aqaba as they provide a shorter transit time to these areas in the medium and the long run when the border-related and other trade barriers are removed.
This growing threat raises the risk of a serious and considerable loss of a major part of what has been considered a traditional captive cargo of the Port of Aqaba to these ports. Further, this could create fierce competition which can hinder the attempts of the Port of Aqaba to increase its market share, particularly transit traffic, as this host of new terminals is likely to create an over-capacity in the region. One has also to take into consideration that the emerging climate of peace and stability in the region will not only contribute to boosting the economies of the countries of the region but is also likely to generate transit traffic eastward through Jordan from the Mediterranean ports.
finally, can the Port of Aqaba act as an efficient gateway for the regional manufacturing needs and services activities?
The answers to these questions along with suitable recommendations will be the area of discussion for this dissertation which will look at these issues from two angles. First, the potential impact on the local market imports and exports which are traditionally handled via the Port of Aqaba. Second, the potential impact on the transit traffic which formed a major part of the Port's traffic in the 1970s and 80s. For this purpose, this dissertation will be organised into six chapters:
The first chapter is an introduction presenting a background to the topic and reviewing the reasons for selecting it with a summary of the threats and challenges that may face the Port of Aqaba as a result of the political and economic changes in the region.
The second chapter will look into the role of the Port of Aqaba in the economic and social development of Jordan. In this connection, a background of the Port, its function, facilities and relation with other sectors will be given.
The third chapter will review the economic and political changes in the region, the peace process, forces of change and the implications of that change on the Port.
The fourth chapter will evaluate the potential emerging competitive environment in the region, the ports involved in that competition, the weaknesses and strengths of each port and the competition implications.
The fifth chapter will be devoted to discussing the new commercial role of the Port, developing alternatives and proposing a marketing strategy.
The last chapter will include the conclusions and recommendations.
Chapter
T
wo
2.
The role of the Port of Aqaba in economic development in Jordan:
2.
1 Background
2.2
Functions and facilities of the Port:
As the Port of Aqaba is Jordan’s only seaport, it has been functioning as the country’s main access for its exports of local mineral, agricultural and industrial products on the one hand and for its imports of manufactured goods on the other. The Port is considered a strategic asset for the country and has accordingly received great attention from the authorities at different levels. The Port started with a small quay for handling lighters and developed throughout the last five decades to become a major port in the Red Sea region with the facilities and equipment shown below.
2.2.1 Handling equipment:
Table 2.1 below shows the cargo handling equipment in the Port. This figure and the ones following it will be used later for comparison purposes with other rival ports.
Table 2.1
Cargo handling equipment in the Port of Aqaba
Equipment Capacity (ton) Number
Gantry Crane 40 2
Straddle Carrier 30 - 35 7
Super Stacker 40 - 50 2
Container Top Lifts 7 - 35 17
Mobile Cranes 90 - 120 2
Mobile Cranes 1 - 45 69
Forklifts 1.5 - 25 119
Tug-masters 60 - 70 25
Towing Tractors 20 - 25 46
Trailers 179
2.2.2 Storage facilities:
As far as storage is concerned, the Port has the following storage capacity:
Table 2.2
Storage capacity in the Port of Aqaba
Storage Area
Transit Sheds 62.000 sqm
Container Terminal 311.000 sqm
Covered Storage 41.000 sqm
Open Storage 245.000 sqm
Cold Storage 500 tons
Phosphate Storage 410.000 tons
Grain Silos 150.000 tons
Potash Storage 150.000 tons
Free Zone 19.000 sqm
Source: Aqaba Port Statistics Sheet 1998
2.2.3 Berthing facilities:
Table 2.3
Berthing facilities of the main port
Berth Depth/m Length/m
No. 1-6 G.C 11.2 - 13.4 1060
No. 7-9 G.C 5.8 - 8 450
No. 10 Tugboats 4.0 210
Phosphate A 11.0 210
Phosphate B 15.0 180
Source: Aqaba Port Statistics Sheet 1998
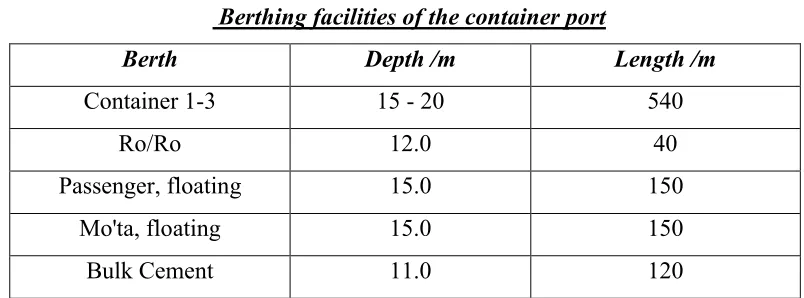
The other two parts of the Port are the container and the passenger port, and the industrial port. Berthing facilities in these ports are shown in tables 2.4 and 2.5 respectively.
Table 2.4
Berthing facilities of the container port
Berth Depth /m Length /m
Container 1-3 15 - 20 540
Ro/Ro 12.0 40
Passenger, floating 15.0 150
Mo'ta, floating 15.0 150
Bulk Cement 11.0 120
Source: Aqaba Port Statistics Sheet 1998
Table 2.5
Berthing facilities of the industrial port
Berth Depth/m Length/m Draft/m Ship L/m Displacemnt
Industrial Seaward 15.0 200 15.0 230 70.000 ton Industrial landward 11.0 190 11.0 190 40.000
Oil Jetty 25.0 140 24.0 370 406.000 Timber Berth 6.8 80.6 6.8 80(120) 14.000
The above mentioned three port components are shown in the following layout of the Port where number '1' points to the main port, '2' points to the container and the passenger port, and number '3' points to the industrial port.
2.3 The role of the Port in development:
The fact that the Port of Aqaba is Jordan’s only seaport shows the considerable importance of this port to the country’s economic and social development. For almost half a century, the Port has been serving the country’s economy in many ways both directly and indirectly. The direct economic impact of the port results from the port activities and cargo volumes handled through the port which generate income, employment and other services directly associated with such activities. The indirect economic impact involves industries and businesses created thanks to the Port in addition to the multiplier effect of the port on other economic activities like banking, insurance, land transportation, etc. Graph 2.1 shows the volumes of cargo handled via the Port since its establishment in 1952 up to 1998.
Graph 2.1
Source: Derived from Aqaba Port Statistics Sheet 1998
Development of Aqaba Port traffic from
1952-1998 in '000 ton
0
5000
10000
15000
20000
25000
These economic and social impacts can be summarised in the following aspects:
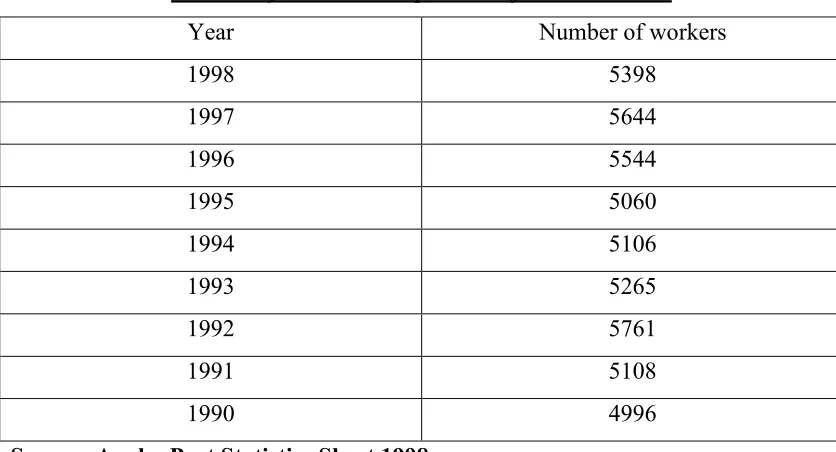
First, the port is a major employer of labour where the number of people employed by the port (both permanent and casual) ranged from 4996 in 1990 to 5398 in 1998 as shown in the following table.
Table 2.6
Number of workers in Aqaba Port from 1990-1998
Year Number of workers
1998 5398
1997 5644
1996 5544
1995 5060
1994 5106
1993 5265
1992 5761
1991 5108
1990 4996
Source: Aqaba Port Statistics Sheet 1998
Second, many economic activities, like shipping agents, road and rail transport, forwarding agents, customs, security administrations and other relevant services, depend in one way or another on the activities of the Port. It is estimated that each ton handled through the Port generates around $ 40 (Jordan, An Emerging Market, Transport Sector, 1998 http://www.nic.gov.jo/economics/invest/308html,) distributed among the different port-related activities mentioned above in addition to the port authority itself. According to this figure, the input of the Port in the national economy was about $ 500m or 7.3% of the GDP in 1998. However, one should bear in mind that estimation of the exact overall impact of the Port on the economy requires in-depth studies which is beyond the scope and purpose of this paper.
regional level, the Port generated considerable economic benefits to the country through its transit traffic which amounted to 35% - 40% of the total traffic of the Port during the 1970s and 1980s as will be seen in chapter three.
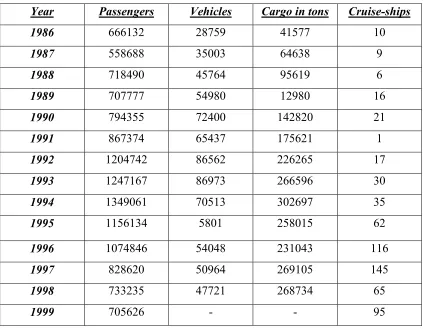
Fourth, the port is considered a growth centre as it encompasses a large proportion of economic interests, a wide range of industries and regional and international joint ventures like the agricultural, chemical and fertiliser industries. Among these are joint ventures to produce fertilisers and agricultural products with Japan, India and Norway. In addition, the Arab Bridge Maritime Company, which runs the ferry line between Jordan and Egypt, is one of the pioneer companies contributing considerably to the Port income and the national economy. Table 2.7 shows the ferry traffic between 1986-1998.
Table 2.7:
Passenger, vehicle & cargo via Aqaba-Nwebe´ferry line &cruise-ship taffic 86-98 Year Passengers Vehicles Cargo in tons Cruise-ships
1986 666132 28759 41577 10
1987 558688 35003 64638 9
1988 718490 45764 95619 6
1989 707777 54980 12980 16
1990 794355 72400 142820 21
1991 867374 65437 175621 1
1992 1204742 86562 226265 17
1993 1247167 86973 266596 30
1994 1349061 70513 302697 35
1995 1156134 5801 258015 62
1996 1074846 54048 231043 116
1997 828620 50964 269105 145
1998 733235 47721 268734 65
1999 705626 - - 95
Further, the Port is vital for the national trade and is likely to become a focus point for maritime traffic, particularly, in view of the government’s recent decision to transform Aqaba into a Special Economic Zone which is expected to generate more cargo into and out of the country and increase value-added activities.
Thus, we notice the pivotal role that the Port plays in the economic and social development of the country. Graph 2.2 shows a comparison between the total cargo handled ('000 tons) and the Port revenues ( '000 JDs) from 1990 –1998.
Graph 2.2
Source: Derived from Aqaba Port Statistics Sheet 1998
2.4 Connection with other sectors:
As has been mentioned, the Port of Aqaba has a great impact on the country’s economy either in terms of the number of people employed by the Port or with relation to its multiplier effect and the activities connected to the Port either directly or indirectly. These activities include:
cargo handled (000 ton) revenues (000JDs)
0 10000 20000 30000 40000 50000 60000
90 91 92 93 94 95 96 97 98
Comparison of revenues in
000 JD & cargo handled IN
1. Rail transportation represented by Aqaba Railway Corporation (ARC) and the Hijaz Jordan Railway (HJR). ARC, which is the major carrier of Jordan’s main mining resource; phosphate, was formed in 1972 and has recently been restructured and privatised with the aim of the construction of new railway connections and expansions which are necessary for enhancing the transportation capacity between the Port of Aqaba and the main cities and production centres within the country and with other neighbouring countries. This falls within a government comprehensive plan to expand the national railways network and convert it into a standard gauge to allow it to be linked to rail networks in other neighbouring countries. The plan involves the following projects:
-Amman Syrian border link -Amman Iraqi border link -Amman Aqaba link
-Shidya-Wadi links for the transportation of phosphate from the phosphate mines in the southern region to the Port of Aqaba.
-Light rail system for the transport of passengers.
competitive position of the Port of Aqaba in the short, medium and long term. Although this sector is being restructured and provided with new trucks as a result of the government’s policy to enhance the land transportation capacity, more investments are needed to enable the sector to meet the anticipated transit and internal transportation requirements. Working in the same direction, the Government has plans to develop the road network with the objective of improving the level of services and facilitating road transport, particularly for the trucking industry and services.
3. The maritime sector involves shipping and forwarding agents represented by the Shipping Agents Association, the Forwarders Association, Jordan National Shipping Lines Co. (JNSL), the Shipping Management and Chartering Company, Arab Bridge Maritime Co. (ABMC) and other private companies involved in different maritime-related activities. JNSL is the national carrier and represents the ship-owning activity along with other private sector activities. The company owns, operates and manages several multi-purpose ships. There is a great potential for developing this sector in many ways, including private sector involvement. On the other hand, ABMC, which was formed in 1985 after the inauguration of the ferry link between Jordan and Egypt and owned by Jordan, Egypt and Iraq, has played a major role in generating traffic to the Port as about 250-300 thousand tons of cargo is transported every year by its ferries in addition to around 0.7-1 million passengers as shown in table 2.7.
4. The industrialists, traders and shippers represented by the Chamber of Commerce, the Chamber of Industry and Jordanian Exporters Association.
with the possibility of using the latter as a joint Jordanian Israeli airport leading to enhancing the competitive position of the Port of Aqaba in the medium and the long run.
6. The customs and health authorities in addition to other authorities involved in cargo traffic into and out of the country.
These are the major sectors involved in maritime transport in Jordan. The quality and cost of their services is of paramount importance for enhancing the competitive setting of the Port and recovering its role as a transit point.
2.5 Conclusion
:Chapter
T
hree
3.
The economic and political changes in the Middle East:
3.1 The peace process:
3.1.1 Background:
confirmed in the Agreement on Transportation between the two countries, signed on the 21st of February 1995, which allowed for the free movement of cargo and vessels between the ports of the two countries and co-operation in shipping sectors, “The parties may mutually use each other’s ports for all services, including loading, discharging, transit and passenger services, on an economical basis.” (Article IV, 1), and “Cargo may be transferred from a port of one country to a port in the other country for the purpose of transhipment.” (Article IV, 3), and “Israel will, in accordance with its legislation, and upon request of the Jordanian Government, make appropriate arrangements for the leasing to Jordan of hinterland areas in Mediterranean ports for off-dock activities for Jordanian cargo. Jordan, will, in accordance with its legislation, enable equivalent off-dock activities for Israeli cargo in the Port of Aqaba.” (Article IV, 4). These provisions may pave the way for having co-operation agreements between the ports of the two countries which is one of the potential solutions to overcome the anticipated fierce competition. This point will be discussed in more depth later.
Also, the Agreement permitted transit transportation between the two countries, “The transport of freight by trucks on land between the two countries and in transit to a third country will be permitted on the basis of the ‘back-to-back’ system, …” (Article II, D, 1). This article was reviewed later where more freedom was given to the movement of trucks between the two countries.
3.2 Impact on the Port of Aqaba:
Although the Port of Aqaba has been the main sea access to Jordan’s exports and imports, it has played a major role as a transit point for other neighbouring countries particularly Iraq in the 1970s and 1980s where the transit traffic amounted to 35 - 40% of the total annual traffic of the Port as shown in graph 3.1 below.
Graph 3.1
Source: Aqaba Port Statistics Sheet 1998
The volumes and destinations of such traffic as shown in table 3.1 below, reveal the vast transit hinterland of the Port although with small volumes except for Iraq. This gives an indication of the traffic potential and the competitive advantage that the Port enjoys in this field.
Total traffic vis. a. vis incoming transit traffic from 83-98 in 000' ton
0 5000 10000 15000 20000 25000
83 84 85 86 87 88 89 90 91 92 93 94 95 96 97 98
Table 3.1
Incoming transit cargo to various countries from 1983-1998 in 000 tons Ir
aq
Syri a
Saudi Arabia
Leb an
Kuwa it
Yem en
U.A.E Other s
Total
83 2869 .138 51 4 6 .011 7 .040 2917
84 3182 .007 24 .918 9 .147 4 .300 3220
85 3969 000 24 .428 7 000 4 3 4007
86 4434 .192 13 .452 7 000 6 10 4470
87 5882 .272 34 .025 14 .118 6 5 5941
88 6853 .260 32 .009 19 1 11 13 6929
89 6087 .035 35 .232 20 2 8 11 6163
90 3154 1 42 1 15 1 9 6 3229
91 1440 .287 49 4 14 .203 10 9 1526
92 1959 2 78 5 30 3 13 4 2094
93 1088 2 117 2 36 2 17 10 1274
94 194 1 136 6 32 .455 16 1 386
95 513 .516 84 3 29 .041 29 13 671
96 278 .884 134 5 33 10 26 19 506
97 593 .423 179 5 26 8 48 29 888
98 510 .001 93 3 26 1 30 19 682
Source: Aqaba Port statistics, 1998
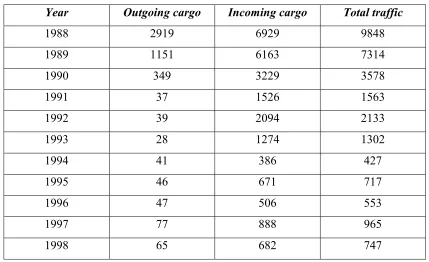
Table 3.2
Outgoing & incoming transit cargo and total traffic between 1988-1998 in 000 tons Year Outgoing cargo Incoming cargo Total traffic
1988 2919 6929 9848
1989 1151 6163 7314
1990 349 3229 3578
1991 37 1526 1563
1992 39 2094 2133
1993 28 1274 1302
1994 41 386 427
1995 46 671 717
1996 47 506 553
1997 77 888 965
1998 65 682 747
Source: Aqaba Port statistics, 1998
This transit traffic, which the Port of Aqaba is struggling to recover, as well as other traffic, especially the western traffic1, are threatened to be lost to both the Mediterranean ports and the Arabian Gulf ports, particularly Haifa and Dubai. The role of the Port of Aqaba as a transit point has also put tremendous pressures on it from time to time and has been affected in different ways by the political developments in the region starting from the first closure of the Suez Canal in 1956, followed by the second in 1967 following the 1967 Arab Israeli war, then the reopening of the Canal in 1976 after its closure in 1973 in the aftermath of the 1973 Arab-Israeli war, the civil war in Lebanon which started in the mid 1970s, the Iraq-Iran war from 1981 to 1988 and finally the 1990 Iraqi invasion of Kuwait and the
1 Traffic originating from or going to Europe, North and South America, North and West Africa, East
United Nations sanctions that followed. These events left their mark on traffic via the Port of Aqaba in different ways. While the civil war in Lebanon and the Iran Iraq war created a cargo traffic boom through the port, the closure of the Suez Canal and the Iraqi invasion of Kuwait affected cargo traffic badly. These impacts can clearly be seen in graph 3.2 which shows the variation of traffic via the Port from 1955 to 1999.
Graph 3.2
Source: Aqaba Port Statistics Sheet 1999
Thus, we notice the fluctuation of traffic as a result of the political events in the region since 1955 particularly during the years 1956, 1967, 1973 and 1990.
Similarly, the peace process is likely to have an impact on the Port in different forms as it has coincided with the wide range of economic changes in the world and the emergence of the world economic and liberal policies sponsored by WTO agreements. The result is that, in the medium and the long run, national governments, including Jordan2, will not be able to favour protectionism policies. On the contrary, these policies are likely to be abolished while free trade and unrestricted movement of cargo will be promoted. Thus, the Port of Aqaba, might be
2 Jordan has recently joined WTO and introduced several laws and policies for free market
0 5000 10000 15000 20000 25000
threatened by new players in the region, both on the Mediterranean and the Red Sea and the Arabian Gulf. These ports pose a real threat to the Port of Aqaba in two areas.
First, the Port's captive traffic of local imports coming from the European and North American markets, and non-mining exports going to these markets.
Second, the Port's transit traffic. The ports in question are the Port of Haifa and the Port of Ashdod in Israel, the port of Beirut in Lebanon and the port of Latakia in Syria. In addition, there is another potential threat coming from the East, that is the Port of Dubai with its large capabilities and world-wide reputation of container handling, transhipment and sea-air traffic from the Arabian Gulf to Europe. This port is preparing to enter the Iraqi market for the cargo coming from the Far East once the sanctions are lifted. In addition to the port of Dubai, there are the newly-established container terminals in Salalah in Oman, Aden in Yemen, Jeddah in Saudi Arabia and North el Sukhnah in Egypt. As far as Mediterranean ports are concerned, they are geographically closer to two major production centres in the world; Europe and North America. They are also located close to the north and the centre of Jordan where approximately 61% of the population live and most of the main industrial, commercial and financial activities are centred. Further, these ports are closer to the Iraqi market in comparison with the Port of Aqaba which means that they can provide a shorter transit time and less costly access to the Iraqi market in the long run when a comprehensive peace is reached and border barriers are removed.
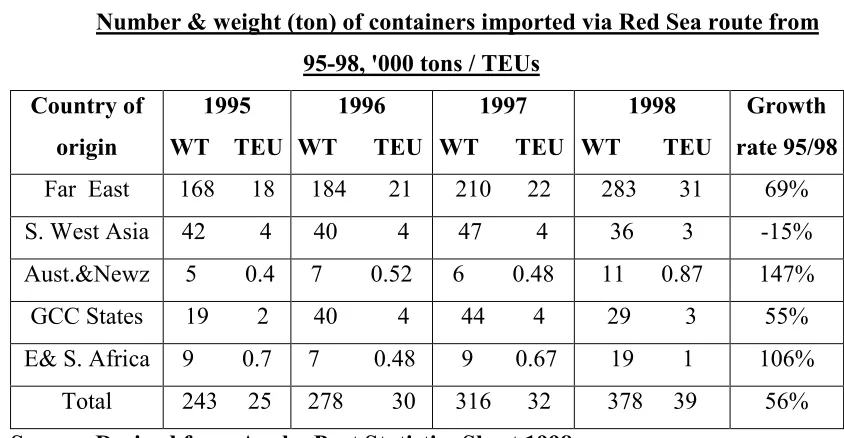
U.S.A and the EC countries accounted for 55.6% of the total number of incoming containers which reached 87 533 TEUs in 1998. In tonnage terms, 67% of the total imported cargo in 1998, which reached 5 333 727 million tons, was western traffic while the remaining 33% was eastern traffic. At the same time, about 20% of Jordanian exports via the Port of Aqaba, which reached 7.310 million in 1998, went to the west; Europe, North America, North Africa, East Europe, Russia and Central and South America as we will see later in this chapter. This shows the big amount of traffic of the Port, other than transit traffic, that is threatened to be lost to the Mediterranean ports in the medium and the long term. With regard to the transit traffic, it is likely also, that a considerable proportion of it will be shifted not only to these ports but also to the Red Sea and Arabian Gulf ports. Tables 3.3 and 3.4 show the total Jordanian imports in TEUs and weight in tons from 1995 – 1998 from Far East and South East countries on the one hand, and from U.S.A and E.U countries on the other.
Table 3.3
Number & weight (ton) of containers imported via Red Sea route from 95-98, '000 tons / TEUs
Country of origin
1995 WT TEU
1996 WT TEU
1997 WT TEU
1998 WT TEU
Growth rate 95/98
Far East 168 18 184 21 210 22 283 31 69% S. West Asia 42 4 40 4 47 4 36 3 -15% Aust.&Newz 5 0.4 7 0.52 6 0.48 11 0.87 147% GCC States 19 2 40 4 44 4 29 3 55% E& S. Africa 9 0.7 7 0.48 9 0.67 19 1 106%
Total 243 25 278 30 316 32 378 39 56%
Table 3.4
Number & weight (ton) of containers imported via 95-98 Med.- Suez Canal route in '000 tons / TEUs
Country of origin
1995 WT TEU
1996 WT TEU
1997 WT TEU
1998 WT TEU
Growth rate 95/98
W. Europe 299 27 388 35 384 34 444 39 48% E.Euro &Com. 5 0.4 2 0.19 4 0.4 2 0.24 -575 East Med. 2 0.2 6 0.5 15 1 13 1 731% USA& Canada 29 3 36 4 48 5 58 6 100% South America 4 0.25 3 0.2 7 0.45 13 1.1 235% N.&W. Africa 3 0.25 9 0.73 9 0.7 6 0.47 102% Others 2 0.16 3 0.27 000 000 000 000 -100%
Total 344 31 445 41 467 42 536 49 56%
Source: Derived from Aqaba Port Statistics Sheet 1998
The total tonnage and number of containers imported via both routes during the same period are shown in table 3.5 below.
Table 3.5
Total tonnage & TEUs imported via Red Sea and Med. Routes from 95-98
Year Weight in '000 tons '000 TEUs
1995 586 55
1996 724 70
1997 783 73
1998 914 87
Source: Derived from Aqaba Port Statistics Sheet 1998
55.6% of the total number of containers imported to the Port came through the Med.-Suez Canal route against 44.4% via the Red Sea route in 1998.
The above figures and the proportion for each route are shown in graph 3.3.
Graph 3.3
Comparison of containerised cargo imported via Red Sea & Med. Routes 95-98
Source: Derived from Aqaba Port Statistics Sheet 1998
In addition to what has been mentioned above, a quick glance at the commodities imported from the USA and Europe (Appendix C) gives a clear indication of the beginning of a shift of western cargo imports from the Port of Aqaba to Mediterranean ports. From this appendix, we notice the following:
1. 67% of Jordan's imports is western traffic.
2. As of 1994, the year in which the peace accord between Jordan and Israel was signed, imports of general cargo, rice, flour, sugar, mineral oils and vegetable oils have either been declining or fluctuating contrary to other commodities like grains, steel, ammonia and cars which have to go to Aqaba Port at this 0
5 10 15 20 25 30 35 40 45 50
95 96 97 98
RED SEA ROUTE
stage because they are either imported in big quantities or are needed for the industries located in Aqaba area. (appendix C). Graph 5.4 shows this trend.
Graph 3.4
Commodities imported from Europe & USA from 1994-1998 in '000 tons
Source: Aqaba Port Statistics 1998
Although the imports are the part of traffic that is more likely to be lost to Mediterranean ports as a result of the economic and political changes in the region, exports, other than mineral and bulk products, may be also affected as a considerable part of them go to Europe and North America (Appendix A). Table 3.6 shows the total exports via the Port of Aqaba during the period between 1994 and 1998 and their distribution among different commodities.
0
500
1000
1500
1994 1995 1996 1997 1998
Table 3.6
Cargo exported via Aqaba port from 1994-1998 in '000 tons
1994 1995 1996 1997 1998 Growth
rate 94/98
Phosphate 3825 3878 4350 4367 3729 -2.5% Chem.Fert. 518 637 674 724 1068 106% General C. 108 151 188 182 389 260%
Re-exports 33 31 38 57 46 39%
Trans-ship. 1 8 72 92 16 150%
Transit 41 46 47 77 64 56%
Empty Cont. 105 97 113 125 157 49.5% Potash 1501 1722 1698 1447 1508 0.47%
Cement 516 109 216 464 333 -35%
Total 6648 6679 7396 7535 7310 10%
Source: Aqaba Port Statistics 1998
Table 3.7
Exports via the Red Sea route to the East in 1998 in 000´tons
Region Total Traffic Main commodities
Far East 2007 Phosphate,Fertilizers, Potash, Empty cont. South West Asia 2583 Phosphate, Fertilizers, Potash, G.C Australia&Newzeland 540 Phosphate, Potash
G.C.C States 199 Cement, G.C, Re-xports, Emp.Cont. East Africa 416 Fertilizers,Potash, cement, Gen. Cargo
Total 5745
Source: Derived from Aqaba Port Statistics 1998 Table 3.8
Exports via Suez Canal-Med. route to the West in 1998 in 000’tons
Region Total Traffic Main Commodities
West Europe 919 Phosphate, Potash, G.C, Empty cont.
U.S.A & Canada 33 Gen. Cargo, Re-exports East Europe & Comm. 158 Phosphate, Potash, G.C
N. & W. Africa 280 Potash, Cement, G.C, Transhipment East Med. 61 Gen. Cargo, Re-exports, Empty cont.
South America 15 Potash
Total 1466
Source: Derived from Aqaba Port Statistics Sheet 1998
Table 3.9
Total exports vis a vis General Cargo exports from 1992-1998 in 000’tons
Year Total Exports General Cargo Percentage
1992 7362 139 1.9%
1993 6381 102 1.6%
1994 6648 108 1.6%
1995 6679 151 2.2%
1996 7396 189 2.5%
1997 7535 182 2.5%
1998 7310 389 5.3%
Source: Aqaba Port Statistics Sheet 1998
Graph 3.5 shows the growth of G.C exports compared with total exports from 92-98.
Graph 3.5
Source: Derived from Aqaba Port Statistics Sheet 1998
G. C
T. Ex.
0
2000
4000
6000
8000
92 93 94 95 96 97 98
G.C exports vis. a. vis. total
exports from 92-98 in 000'ton
What has been said about local trade can also be said about transit trade to Iraq and other surrounding countries as these ports provide a lower cost and a shorter transit access to west-bound trade and vice versa.
3.3 Forces of change:
Perhaps one of the greatest changes that has taken place in recent years is that the world is heading towards more stability, more co-operation, more globalisation and more inclination towards information technology use. The Middle East is, of course, not far from these changes. The result of these new developments is that competition is increasingly becoming more fierce as trade barriers are being removed either through liberal policies or by World Trade Organisation (WTO) agreements. Change is taking place rapidly and the future is no longer the next generation or even the next decade. It is, rather, the next few years. These changes will certainly have an impact on all products including port services where standards like quality, low cost and reliability will be on top of many increasingly additional sophisticated customer requirements. In this new highly competitive environment, the ability to compete is greatly dependent on the ability to adapt oneself to the changes created by the new developments regionally and globally. In this respect, it is worth discussing the forces of change that are likely to have a considerable impact on the direction and ability of most economic activities, including ports, to compete. (M. Gerhardt, Intermodal Freight Transportation. p.2). These forces of change are:
- Globalisation
- New and emerging technologies - Regulation and deregulation
3.3.1 Globalisation
:
thinking. What we are likely to witness in the near future is much more globally integrated economies and businesses. These fundamental changes are putting tremendous pressures on the maritime sector in general and on the port sector in particular from various aspects. First, in terms of competitive pressures and low profitability services, and, second, in terms of changing customer requirements and services offered by ocean carriers. These services have different shapes and new dimensions where a supply chain is offered rather than a single product or service; pure sea transportation. This trend will have a great impact on ports because it will make them part of the hinterland service chain (land and rail transportation). However, these changes may, at the same time, create opportunities for ports of the region as the Middle East can not be isolated from the outside world. The present and the anticipated economic boom in the Far East is a good example of these opportunities which the Port of Aqaba should take advantage of benefiting from its location as far as trade with these countries is concerned in comparison with other rival ports. Thus, due to its location and abundant natural resources, the Middle East will be in the heart of these changes. Those who are going to survive in this highly competitive environment are the most efficient, the best equipped, the fastest to respond to these changes and, of course, the best marketed.
3.3.2 New and emerging technologies
:
Breakthroughs in technology, communications and transportation are the main features of today’s economic equation . The new technological developments such as the internet, electronic data interchange (EDI) and other information systems, the container, fast and large ships and sophisticated cargo handling equipment pose a big and real challenge to today’s ports. Ports which can best use, own, harness and efficiently cope with these technologies will surely have a better chance. These changes can make or break any business and any delay or failure to keep up with them means a lost opportunity and the failure to remain competitive.
3.3.3 Regulation and deregulation:
Today, more open and liberal policies are needed and all constraints and unnecessary regulatory policies have to be removed if a full advantage of opportunities offered by the market is to be taken. However, this new spirit should not be understood as a way to affect, avoid or bypass the right of each state to regulate and control its economic activities within the framework of the emerging spirit of change where isolation and protectionism are increasingly diminishing.
3.4 Change implications:
Perhaps, the greatest impact resulting from the above change trend is that trade in the region, as well as in the world, is nowadays driven by profit, markets and competition. Moreover, and most importantly, the development of these forces of change outpaces the capabilities of most small ports like the Port of Aqaba. So, the Port is likely to suffer unless it is able to adapt to the winds of change through providing higher quality and fast and cost-effective service. This goal can not be achieved unless the growing gap of technological advances and opportunities is narrowed or entirely removed through acquiring technology, having access to new developments and information technologies like the internet.
medium and long term planning and training programmes are badly needed. It is true also that the Port of Aqaba has to take the new changes into consideration and best-benefit from its own capabilities and advantages like the location, the infrastructure, the skilled and cheap labour force and the surrounding markets, although these advantages are changing and enjoyed by other competitors. However, that may not be the best answer and the most appropriate response to these challenges unless a long term commercial strategy is set up taking into account the far-reaching effects of these changes, on top of which is the question of whether you can survive if you are not part of the 'production line' or the global network of these big players and whether you are able to respond to their fast and constantly changing requirements.
Chapter
F
our
4.
The emerging competitive environment:
4.1
The new players:
The new political climate in the Middle East has triggered off new economic and trade practices in the region in general and in Jordan in particular where exports and imports are being transported through different accesses and by different modes. Following the signing of the peace accord with Israel, Jordanian exporters and importers are more and more yielding to the temptation of using the Israeli ports located on the Mediterranean for their trade to and from Europe and North America. Similarly, these exporters and importers are looking to the Lebanese and Syrian ports for the same purpose and even to the new Gaza port in the long run. The Israeli ports are the ports of Haifa and Ashdod while the main Lebanese and Syrian ports are mainly the ports of Beirut and Latakia respectively. If trade barriers, whether political or regulative, are removed, these ports can provide a direct and short access to and from the European and North American markets for trade originating from or heading for both Jordan and the neighbouring countries.
drawing a comparison between the Port of Aqaba and the rival ports, a brief review of these ports and other regional ports that may have an impact on the port industry in the region will be given in the following few pages.
4.1.1 Haifa Port:
Located 120km north of Tel Aviv, Haifa Port is considered the oldest and the largest port in Israel. It was built by the British and started operations in 1933. The port is protected by two main breakwaters and has a total quay area of 6417m, 4932m of which form the main port and 1485m form the Kishon zone. The port has berths for handling general cargo, containers, roll on / roll off cargo and grain. It is divided up into two parts; the East Quay and the West Quay. The East Quay is 1000m long with 14m water depth, 780m of which are dedicated for handling containers and 220m for handling bulk cargo. This part has a storage capacity of 15000 TEUs and 900 electrical points for reefer containers. The West Quay has a quay area length of 400m with a depth of 10.5m and has a storage area for 700 TEUs. In 1996, the port handled 13.5 million tons of cargo excluding oil and 427.000 passengers. In order to develop the port's capacity, meet the projected growth of cargo and establish a modern overland transport network, Haifa port has set a $ 1 billion-programme for the port's 2000-2004 development plan. Currently, a US$ 224m programme is being implemented to double the berthing capacity and to increase the handling capacity to 900.000 TEUs per year. Due to its location, Haifa Port can provide short transit services to the north and centre of Jordan and other surrounding countries like Iraq.
Graph 4.1
Source: Derived from Haifa Port Web Site 1999
As far as the container handling equipment is concerned, Haifa Port has the following:
Table 4.1
Container handling equipment in Haifa Port
Type Capacity in tons Number
Gantry crane 35 8
Transtainer 35 15
Portable 5-35 17
Source: Derived from Haifa Port Web site
The implications of the development of these facilities and equipment will be the area of discussion later in this chapter.
4.1.2 Ashdod Port:
Located 40km south of Tel Aviv and considered the second largest port in Israel. It started operation in 1965. It is protected by two breakwaters and has 4000 meters of quays with a maximum water depth of 14m. The berthing facilities and handling equipment of the port are as follows:
Cont. traffic growth in Haifa
Port 87-96 in '000
0 100 200 300 400 500
87 88 89 90 91 92 93 94 95 96
Table 4.2
Berthing facilities and handling equipment in Ashdod Port
Berth Length/m Depth/m Crane No.
G.C, liquids, RoRo 770 5.10.5 8 - 25 ton 10
G.C 150 5 -
-G.C & bulk 620 5-11.5 25-50 ton 9
Passenger & G.C 207 12.5-13 8 ton 3
G.C, bulk, RoRo 477 7-13.8 32-35 ton 6
RoRo 150 7 -
-Containers & RoRo 481 10-12 35/70 5
Coal & containers 435 13.8 40 2
Phosphate & potash 400 12-14 -
-Liquid bulk 150 7 -
-Source: Derived from Ashdod Port Web site
As regards the throughput of the port, it was as follows during the period between 1990 - 1998.
Graph 4.2
Source: Derived from Ashdod Port Web site 1999
Growth of G.C & Cont. traffic
inAshdod Port 90-98 in '000
0 5000 10000 15000 20000
90 91 92 93 94 95 96 97 98
With regard to the development plan, Ashdod port has set a master plan to develop the port with three components:
1. Breakwaters
2. Quay layout and their uses
3. Development of operational areas
The plan, which is called Ashdod North, will take place in two stages. The first stage, Ashdod North A, and the second stage, Ashdod North B. The plan includes building an additional 3.850 meters of quayside which is equal to the present quay lengths of the port, 325 acres of operational areas (the present operational areas consist of 238 acres), 2150m of breakwaters (the present length of breakwaters is 3100m) and building a new container terminal. Ashdod North A is scheduled to be completed in 2002 and includes building 1150m of breakwaters, new general cargo and container quays with a length of 1900m and an operational area of 212 acres. The implementation of Ashdod North B plan will depend on future demand. The total cost of this development plan is estimated at $500 million for stage A and $400 million for stage B.
4.1.3 Beirut Port:
by Dubai Port Authority, is expected to add a further 400.00 TEUs to the port's capacity by 2001 noting that the Port handled 157070 TEUs in 1998. Another breakwater will be built.
Currently, the port area covers 61 hectares protected by a 2255m breakwater and has 14 berths for handling general cargo, bulk coal and break bulk distributed over four docks.
The port has also three mooring buoys for vessels handling cargo into lighters and one for tankers located 2.4km from the port's entrance where cargo is discharged through an underwater pipeline.
With regard to the storage capacity, the port has 75.000 square meters of covered storage, 120.000 sq. m of open storage and 90.000 sq. m of container stacking areas.
Finally, the port has a free zone area of 104.100 sq. m
4.1.4. Dubai Port:
One of the leading distribution and transhipment ports not only in the Middle East but also in the world. In 1997, it was ranked 10th among the container ports in the world as it handled 2.6 million TEUs in that year, while in 1999 the port handled 2.336.787 million TEUs and a total cargo of 32.409.991 million tons. The port is well-established, well-equipped and has the advantage of the existence of Jebel Ali Free Zone which is one of the largest free zones in the world. The port uses advanced computer technology in its operations including a container terminal management system (CTMS), global container positioning system (GPS), container freight station (CFS) and a manifest and documentation system (MDS).
Table 4.3
Container handling equipment and reefer points in Dubai Port
Container cranes panamax 15
Container cranes post panamax 10
RTGs 34
Straddle carriers 27
Forklifts 117
Empty container handlers 24
Top loaders 14
Trailers 274
Terminal tractors 152
Mobile harbour cranes (up to 120t) 2
Reefer points 950
Source: Derived from DPA Web site 1999
Due to its location, free trade policies, the existence of Jebel Ali Free Zone and the large and rich hinterland surrounding the area, Dubai Ports Authority has managed to attract a large number of shipping lines and cargo operations not only to the Arabian Gulf area but also to most Middle Eastern countries. The port has also established, for the first time, sea-air traffic to and from Europe and the Far East. In order to have a footstep on the Mediterranean, Dubai Ports Authority (DPA) managed, in 1998, to gain a management contract to operate Beirut Container Terminals. DPA managed also to win a 20-year concession contract to run the southern container terminal in Jeddah Port. The port has a ten-year investment plan with the aim of reaching a throughput of 3m TEUs in 2000 and 3.7m TEUs in 2005.
4.1.5 Jeddah Islamic Port:
through private management contracts and concession arrangements. The new North Terminal was developed by converting bulk and general cargo berths into a container terminal which became operational early this year. This terminal project includes building a 1000m quay, dredging operations to allow vessels up to 14.5m draft to berth and acquiring three post-panamax gantry cranes and seven RTGs in the first stage. The operator will be required to purchase another four post-panamax gantry cranes and five RTGs. On the other hand, the operation of the South Terminal was awarded to a different private operator who is a joint venture between Dubai Ports Authority and Saudi Maintenance Corporation in order to create a competitive environment in the port. This terminal will have 1.680m quayside length and be equipped with eleven gantry cranes, three of which will be super post-panamax. Graph 4.3 shows the container throughput of Jeddah Port in 1986 and from 1990 to 1998 in ‘000 TEUs.
Graph 4.3
Source: Derived from World Container Port, Markets to 2010,
Ocean Shipping Consultants Ltd.
Cont. traffic growth in
Jeddah Port from 86-98
0
200
400
600
800
1000
1200
86 90 91 92 93 94 95 96 97 98
4.1.6 Mina Raysut - Salalah:
A new hub, opened in 1998, owned and operated on a concession basis grouping Salalah Port Services with a 20% share, private investors with a 50% share, and most importantly Maersk Sealand with 30%. The hub has four berths with a total length of 1.236m and a water depth of 15m and is equipped with twelve super post-panamax gantry cranes, six of which have an outreach of 22 cell widths designed to handle the next generation of container ships of 10.000 TEUs. The future plan of this project envisages building 24 berths. This port will serve as a major transhipment centre for the whole region with feeder destinations to all Middle Eastern countries, the Arabian Gulf and the Indian Subcontinent. To the surprise of the port operators, this relatively new hub handled 666.000 TEUs in 1999, 40% more than the projected figure.
4.1.7 North el Sukhnah:
A new port being built 40 km south of the southern entrance of the Suez Canal south of Adabiya. The port will be constructed in four phases where four basins will be built. The first basin with a total cost of $ 200 million is expected to be completed by September 2000 and will have a quay length of 1500m for handling containers and bulk cargo. This project is a joint venture grouping local Egyptian companies and the Stevedoring Services of America (SSA) which has a 25% share. The project plans to have a capacity of 1.5 million TEUs per year to be increased to 5 million TEUs by year 2020.
4.1.8 Port Said Port
Lies on the northern entrance of Suez Canal and, due to its location, it has become the biggest transit port in the world. It has also become a target for many major shipping lines planning to build their transhipment terminals in it like P & O and Maersk-Sealand for traffic to the East Mediterranean and Black Sea regions.
4.1.9 Aden Port:
20-year contract. At present, the port has a 700-hundred meter quay with a depth of 16m equipped with four super post-panamax container gantry cranes. The next expansion phase of the port includes the deepening of the quayside draft to 18 meters, extension of the terminal to 1700m and purchasing 12 container gantry cranes. The plan also comprises the establishment of a free trade zone and an industrial area. ACT managed to handle 80.000 TEUs in the first nine months of its operation and is projected to hit 300.000 TEUs in 2000.
4.2
The potential challenge:
Having a quick glance at the capabilities and development plans of the above ports whether on the Mediterranean or on the Red Sea, the following is noticed:
1. All of the ports are trying to upgrade their berthing and handling capacity through building new terminals and purchasing new equipment. For this purpose large investments have been made in co-operation with foreign investors.
2. New ports have been built or are being built especially in the Red Sea region, opening the door wide for fierce competition and a potential over-capacity. 3. All port investments and expansions are focussing on container traffic. This is apparently in response to the anticipated growth in containerised traffic at the expense of breakbulk traffic. This trend has been shown in a recent demand forecast done by Ocean Shipping Consultants Ltd which anticipates a rise in demand for the East Mediterranean from 6.25 million TEUs in 1998 to 13.40 million TEUs in 2012, and for the Red Sea region from 1.42 million TEUs in 1998 to 7.25 million TEUs in 2012. (World Container Demand, Ocean Shipping Consultants Ltd, 1999).
4. The involvement of major shipping lines, like Maersk-Sealand, and major port operators like Port of Singapore Authority (PSA) and Port of Dubai Authority (PDA) is very clear in current and, most likely, in future development projects. 5. These projects reflect the general trend of the global carriers to serve major but a limited number of hub ports, in addition to the growing sophisticated requirements of these carriers; fast, efficient and timely service.
involvement as a guarantee for efficient, cost-effective and competitive service on the one hand, and the governments' unwillingness to continue to be involved in running and operating ports on the other.
These developments pose a real threat to the Port of Aqaba in the medium and the long term in various aspects:
First, they are likely to have a comparative and competitive advantage over the Port of Aqaba due to the huge investments made in building new terminals and purchasing new equipment. This means that they will be able acquire the most advanced technologies in port operations which will result in a competitive service.
Second, the involvement of major shipping lines in these ports will ensure a captive traffic for these ports.
Third, most of these ports are supported by sophisticated hinterland road and rail networks which will enable them to provide a full service package and multi-modal transport.
Fourth, in addition to the major shipping lines, some of these ports, like the Israeli and Arabian Gulf ports, are served by large national shipping carriers which are Zim and United Arab Shipping Company (UASC) respectively.
Fifth, the network nature of these developments is worrying where a major part of traffic will be concentrated in the hands of a few operators.
Sixth, the increasing number of newly-built terminals carries the risk of over-capacity which may have a negative impact on smaller ports in terms of price and competitiveness.
in the face of these challenges. This will be the area of discussion for the following section.
4.3
Weaknesses and strengths of Aqaba Port and rival ports
:
For the purpose of analysing the competitive position of the Port of Aqaba and the rival ports, the following criteria will be used:
I. A comparison will be made between these ports using the following eleven elements which are also considered vital for both the port and the port users or customers: (Port Marketing, Ma Shuo, WMU, 2000).
1. Geographical position 2. Nautical access 3. Port facilities
4. Hinterland connections 5. Port cost
6. Output 7. Value added
8. Information technology and other services that can be offered 9. Labour force and social climate
10. Development and institutional structure 11. Flexibility to change
II. The comparison will be made between the Port of Aqaba and the ports of Beirut, Haifa, Ashdod, Jeddah and Dubai as they pose a more direct challenge to the Port of Aqaba in terms of its local containerised and imports and exports on the one hand, transit cargo to and from surrounding countries via the Med. route and transit traffic coming through the Red Sea route on the other.
III. The comparison approach will mainly focus on container traffic and container berthing and handling facilities for the following reasons:
b. All of the ports in the East Mediterranean and Red Sea regions are focussing their development plans on enhancing their container handling capacity either through building dedicated container handling terminals or purchasing new container handling equipment.
c. The containerised traffic via the Port of Aqaba during the last ten years has been growing steadily at the expense of the non-containerised traffic which has been declining almost at the same rate as shown in graph 4.4 below.
Graph 4.4
Imports via Aqaba Port by mode of discharge from 90-98 in 000'
Source: Derived from Aqaba Port Statistics Sheet 1998
4.3.1 Geographical position:
This element is connected to the geographic location of the port in relation to both the main shipping routes and the production and consumption zones. Although it has been repeatedly said that the Port of Aqaba is located far from major shipping routes (180 km from Tiran Straits), this distance through clear and open seas can not be considered a severe hindrance to shipping lines if efficiency and handling speed at the Port compensate for that. The best example in this regard is the Port of Antwerp which is located 70 km from the North Sea and connected to it by the River Scheldt